Bartak, M., Drkal, F., Hensen, J.L.M. & Lain, M. (2000). Computer Simulations - Energy Saving Design Tool (Pocitace Simulace - Nastroj k dosazeni uspor energie) Proceedings of Energy Efficiency Business Week - EEBW 2000, Seven, Prague. (In English and Czech)
Computer Simulations – Energy Saving Design Tool Martin Barták, František Drkal, Jan Hensen, Miloš Lain Czech Technical University in Prague Faculty of Mechanical Engineering, Dept. of Environmental Engineering Technická 4, 166 07 Prague 6, Czech Republic phone: ++420-2-24352586, fax: ++420-2-24355606, e-mail:
[email protected]
Abstract: The paper deals with building energy simulations, their capabilities and applications in the design process of low-energy heating, ventilating and air-conditioning (HVAC) systems. Three recent studies concerning practical projects based on computer simulations are presented.
Introduction Computer modelling and simulation used in the design of buildings and HVAC systems as well as in the evaluation of buildings energy and environmental performance are expanding from the research and development stage into engineering practice. In contradistinction to the traditional simplified calculating methods (not considering the system dynamics), computer based modelling better approaches the reality. At present time building simulation techniques can be characterized by three trends: • development of integrated models used to predict and evaluate energy performance of buildings and HVAC systems, • implementation of CFD models for the simulation of air motion in rooms and buildings, • development of software tools for specific problems, focused particularly on the heating, ventilating and air-conditioning systems. Up-to-date review of building simulation techniques is presented at the international conferences Building Simulation organized by IBPSA every second year, BS '99 in Kyoto, Japan as the latest one [1]. Computer simulations are demanding at input information and data processing more than ordinary design work. On the other hand simulation techniques make possible to analyse in detail a number of solutions for the building geometry and construction as well as for the design and operation of HVAC systems. The aim of computer modelling is to optimise the design of a building and its service system according to the requirements for indoor air quality while keeping energy consumption at minimum levels. Different ways of energy saving are given in the following examples, which were solved by integrated simulation program ESP-r [2]: • Lower investments and operational costs can be achieved by the detailed analysis of airconditioning system and by the application of low-energy cooling techniques (Pavilion in Prague Zoo). • Considering the heat capacity of building walls we can not only decrease the cooling energy costs but also minimize the modifications in building construction. • The operation and control strategy analysis of existing air-conditioning system can decrease operational costs while minimizing over-steps of the required indoor air temperature (offices in the centre of Prague).
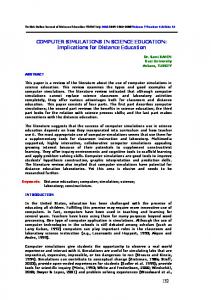
Adiabatic cooling of the pavilion Indonesian Jungle in Prague Zoo Computer model of the pavilion Indonesian Jungle in Prague Zoo was used as a primary information source for the estimation of energy demand in this unusual building [4]. With respect to the required relative humidity of indoor air, which was very high (70 to 90%), an alternative cooling technique was introduced using water sprayed into the pavilion interior. This decreased the maximum cooling capacity demand from 215 kW to 160 kW. The time when the cooling system is in use felt down from 2000 hrs almost to 1000 hours over the whole year. The simulation predicted also the number of operating hours with high cooling loads, for example cooling loads higher than 120 kW are required for only 80 hours per year. Summer cooling load Sensible cooling load
Cooling load with evaporative humidication
250 Indoor air temperature 25/21°C
Relative humidity 90%
Cooling load [kW]
200
150
100
50
0
V
VI
VII
VIII
IX
Cooling load - representative week Sensible cooling load
Cooling load with evaporative humidication
250 Indoor air temperature 25/21°C
Relative humidity 90%
150
100
50
19.7
18.7
17.7
16.7
15.7
14.7
13.7
12.7
11.7
10.7
9.7
8.7
0
7.7
Cooling load [kW]
200
Influence of accumulated energy in heavy construction on cooling energy demand One of the basic disadvantages of the traditional calculating and design methods for HVAC systems is the underestimation of the building heat capacity impact. Within the design process of new exhibition rooms in the historical building Sovovy Mlýny in Prague computer simulations were used to predict the required capacity of a cooling system. The former design made by a standard calculation estimated the cooling capacity up to approx. 100 kW and according to this were also the dimensions of the cooling device. The simulation showed that at the indoor air temperature of 24°C the cooling capacity 20 kW would be enough to remove both the external heat load and the internal heat gains from occupants and lights. The study helped not only to lower investment costs for cooling system but most of all to minimize changes in the construction of a valuable historical building. The simulation was combined with measurements in the existing building and the indoor environment was assessed also for the case without any cooling device. Cooling load time variation Cooling load
Heat gains
Ventilating air temperature
25
30
20 15 15 10 10
5
Air temperature [°C]
25
20
5
0
0
po
út
st
čt
pá
so
ne
Representative week
Time variation of air temperature and rel. humidity without cooling
Nooccupants
Infiltration 1,5 ACH
80
34
76
33
72
32
68
31
64
30
60
29
56
28
52
27
48
26
44
25
40
24
36
23
32
22
28
21
24
20
20
Humidity 312+313
19
16
Humidity 214
18
12
17
8
16
4
15
0 po
út
st
čt
pá
Representative week
so
ne
Outdoor temperature Temperature 214 Temperature 216+215 Temperature 217 Relative humidity [%]
Air temperature [°C]
35
Temperature 311 Temperature 312+313 Temperature 314 Humidity 217 Humidity 216+215 Humidity 314
Humidity 311
Control strategies and their influence on energy consumption of A/C device Air-conditioning system for offices in Prague city centre was assessed according to the existing standards and using computer simulation. Both methods gave very similar results in cooling loads and air conditioner sizes. The orientation and slope of garret windows caused relatively high solar heat gains during the whole day. Based on computer simulation the analysis of several control strategies was performed yielding interesting results: 1. When continuously operated, the air-conditioning device is capable to keep the indoor air temperature at 25 °C but the consumption of cooling energy is very high. 2. If the air conditioner is operated only in working days from 6 a.m. to 7 p.m. the indoor air temperature oversteps the required level (25 °C) and even exceeds 31 °C. 3. To operate the air-conditioning device also over night in a reduced-output mode (the temperature set-point is 32 °C over night) seems to be the optimum cooling strategy. The indoor air temperatures are very close to the required level while the energy consumption is almost as the same as in previous case. Tab. 1 Results of computer simulations – comparison of different cooling strategies Time when the Maximum Annual cooling Cooling Maximum Maximum temperature energy strategy temperature temperature cooling load in working hours exceeds 25°C consumption [°C] [hours] [kWh] [W] [°C] 1 25 25 3 570 3 330 0 2 31.4 43 3 780 2 905 214 3 26.7 32 3 780 2 975 82 Comparison of air temperatures for three control strategies Strategy 1
40
Strategy 2
Strategy 3
Outdoor temperature
Air temperature [°C]
35
30
25
20
0:00
23:00
22:00
21:00
20:00
19:00
18:00
17:00
16:00
15:00
14:00
13:00
12:00
11:00
9:00
10:00
8:00
7:00
6:00
5:00
4:00
3:00
2:00
1:00
0:00
15
Time [h]
References: [1] N. Nakahara, H. Yoshida, M. Udagawa, J. Hensen: Proceedings of the 6th International IBPSA Conference Building Simulation'99. Volume I,II,III. Kyoto 1999 [2] ESP-r, A Building Energy Simulation Environment. ESRU Manual. Energy Systems Research Unit. University of Strathclyde. Glasgow 1998 [3] M. Lain: Posouzení klimatizace kanceláří. [Výzkumná zpráva]. ČVUT v Praze. Praha 1999 [4] M. Barták, F. Drkal, J. Hensen, M. Lain: Analýza vnitřního prostředí pavilonu ZOO Praha Indonéská džungle. [Výzkumná zpráva]. ČVUT v Praze. Praha 2000 [5] M. Barták, F. Drkal, J. Hensen, M. Lain: Analýza tepelného stavu prostředí galerie v objektu Sovovy mlýny. [Výzkumná zpráva]. ČVUT v Praze. Praha 2000