Jl. of Technology and Teacher Education (2000) 8(4), 373-396
Computer Technology Training for Prospective Teachers: Computer Attitudes and Perceived Self-Efficacy YING-CHEN L. MILBRATH CPO Library, Berea College Berea, KY 47404 USA
[email protected] MABLE B. KINZIE Curry School of Education University of Virginia Charlottesville, VA 22903 USA
[email protected]
To be effective users of computer technologies and be models for students’ computer use, teachers must have positive computer attitudes and feel self-efficacious in using them. The computer training that teachers receive through their teacher education program is likely to foster positive computer affect, yet the change may require time and development. This longitudinal study examined prospective teachers’ changes in perceived anxiety/discomfort with and usefulness of computer technology, frequency of using word processing, e-mail, spreadsheets, database management, statistical packages, and CD-ROM databases, and perceived self-efficacy with the six selected computer technologies over three years of study. Statistical analyses of data involved three time periods and two student teacher cohorts. Significant time effect, cohort effect, and time by cohort interaction effect are discussed.
Technology is having a significant influence on the future of education. In some cases, computer technology has manifested its potential in helping
374
Milbrath and Kinzie
teachers facilitate students’ problem-solving skills, scientific inquiry, understanding of abstract mathematical concepts, communication skills, and workplace competencies (Office of Technology Assessment, 1995). Current learning theories, such as constructivism, emphasize using computer technology as a tool to access and organize information, and to construct personal knowledge. On the other hand, the Office of Technology Assessment (1995) reported that “despite technologies available in schools, a substantial number of teachers report little or no use of computers for instruction” (p. 1). Marcinkiewicz (1994) found that over half of the teaching population displayed a pattern of underuse or nonuse of computer-related resources in schools. Evans-Andris (1995) examined 72 elementary teachers’ computing styles and found that more than half (60%) of the teachers avoided using computers and treated going to the computer lab as an aimless activity. Many teachers have doubts about computer technology and their own ability to perform because computer technology was not part of their learning experience. In addition, the rapid evolution of computer applications in education appears to further complicate the situation. Therefore, teachers must have positive computer attitudes and feel self-efficacious in using computer technologies in order to model effective computer use for their students.
THEORETICAL AND RESEARCH BACKGROUND Computer Affect Affect such as attitudes, values, and self-judgments can exert a profound effect on behaviors. Negative emotions are more likely to deter a person from trying new things, while positive affect tends to strengthen a person’s belief and promote productive behavior (Campbell & Williams, 1990). The construct of computer attitudes has multiple dimensions. A substantial amount of literature suggests that computer anxiety can be a great obstacle for educators’ computer adoption (Gabriel & MacDonald, 1996; Hakkinen, 1995; Handler, 1993; Hunt & Bohlin, 1993; Kernan & Howard, 1990; Koohang, 1989; Liu, Reed & Phillips, 1992; Loyd & Gressard, 1984; McInerney, McInerney & Sinclair, 1994; Reed & Overbaugh, 1992; Reed & Overbaugh, 1993; Robertson, Calder, Fung, Jones & O’Shea, 1995; Stimmel, Connor, McCaskill & Durrett, 1981). Stressful encounters with computers are likely to cause aversive predisposition toward the object. Many studies also measured attitudes toward computer usefulness to help predict computer behavior. Campbell (1992) found that college students’ attitude toward the usefulness of computers were predictive of their enroll-
Computer Technology Training for Prospective Teachers
375
ments in college computer courses. Marcinkiewicz (1994) reported that teachers’ perceived relevance of computers for teaching was one of the factors that influenced their motivation to integrate computers into teaching. Perceived self-efficacy is defined as “personal judgments of one’s capability to organize and implement actions in specific situations that may contain novel, unpredictable, and possible stressful features” (Schunk, 1984, p. 48). Studies show that perceived self-efficacy with computers is a critical predictor for the use of computer technology (Delcourt & Kinzie, 1993; Ertmer, Evenbeck, Cennamo, & Lehman, 1994; Jorde-Bloom, 1988; Kinzie, Delcourt & Powers, 1994; Olivier & Shapior, 1993). In the past, a number of self-efficacy scales were developed to measure different types of self-efficacy. Olivier (1985) developed computer efficacy scales to assess subjects’ separate efficacy beliefs on programming and instruction. Murphy, Coover, and Owen (1989) later devised the Computer Efficacy Scale for measuring general efficacy beliefs with computers. Unlike attitudes, the interpretation of self-efficacy is identified with a set of clearly defined skills or behaviors (Bandura, 1986; Murphy et al., 1989). Ashton and Webb (1986) pointed out that “the development of perceived efficacy fluctuates with the specific educational experiences of teacher-education students” (p. 154). Delcourt and Kinzie (1993) recommended that when measuring computer self-efficacy, results with regard to each specific technology should be interpreted individually.
Training, Computer Attitudes, Perceived Self-Efficacy and Computer Use Computer affect tends to be influenced by training experience and is likely to exert an influence on future computer behavior. In a review of the computer attitudes literature, Dupagne and Krendl (1992) stated that “teachers who have had computer training are more likely to show positive attitudes toward computer use in the classroom” (p. 423), while those who had no prior experience exhibited high anxiety toward using computers (Liu et al., 1992). Reed and Overbaugh (1992) found that both an introductory computer course and a content-specific computer course influenced teacher education students’ attitude change. Others (Hunt & Bohlin, 1993; McInerney et al., 1994) reported that exposure to a variety of computer applications, word processing in particular, seemed to also have an effect on attitude change. Among studies on computer self-efficacy, Miura (1987) found that “completion of a high school computer programming course, and current and past enrollment in college computer science classes, were positively related to the self-efficacy scale” (p. 307). Ertmer et al., (1994) reported
376
Milbrath and Kinzie
that students who were more familiar with computers and who utilized word processing and e-mail technology more frequently, judged themselves as more effective users of those technologies. Training and educational practices can provide an important influence on a person’s sense of efficacy; however, “experience per se is not likely to exert a direct influence on people’s decisions to learn about or use computers, unless computer efficacy beliefs have been affected” (Hill, Smith, & Mann, 1987, p. 310). Adoption of computer technology requires time and development (Dwyer, Ringstaff & Sandholz, 1990; Faison, 1996; Hall, George, & Rutherford, 1977; Sheingold & Hadley, 1990). Therefore, it is essential to provide teachers with adequate computer training early in the educational process. Salomon (1984) cautioned educators not to overlook the long-range cumulative effects of computers. Studies on the relationship between computer training, development of computer affect, and computer use over time are needed.
PURPOSE OF THE STUDY The purpose of this longitudinal panel study was to examine the effects of computer training that two cohorts of prospective teachers received through their teacher preparation process at the University of Virginia (UVa). Most participants were required to complete three two-hour handson computing tool class sessions, and a two-credit full-semester Introduction to Instructional Technology course. Responses toward 14 selected computing variables (frequency of using six types of computer technologies, two computer attitudes and perceived self-efficacy with the six computer technologies) were analyzed to help understand prospective teachers’ change in computer affect and computer use over time.
METHODS Subjects Participants in this study were prospective teachers who entered the five-year teacher education program. These students first enrolled as regular liberal arts students in the College of Arts and Sciences and then applied for permission to enter the teacher education program in their second semester or during their second year of undergraduate study. After completing all requirements, they received both a Bachelor of Arts/Science degree and a
Computer Technology Training for Prospective Teachers
377
Masters of Teaching at the end of their fifth year. Besides technology courses, prospective teachers in this study observed and participated in various instructional technology activities. For example, the third-year students were encouraged to participate in the computer-based Curry Teaching Simulations which fostered basic classroom behavior-management skills (Strang, Landrum, & Ulmer, 1991). Faculty in different concentration areas demonstrated computer technology usage in the method courses. Teaching internships provided opportunities for prospective teachers to apply computer technology to classroom teaching.
Procedure The Computer Technology Survey (Kinzie et al., 1994) was used to collect data. The two prospective teacher cohorts received similar computer training. Panel One was admitted to the teacher education program a year before Panel Two. Both panels were surveyed three times. The first survey (pretest) took place in the first semester (or Summer term) after these prospective teachers entered the teacher education program (usually in their second year of undergraduate studies). Most prospective teachers completed the three two-hour computing tool class sessions (on word processing, electronic mail, and bulletin board systems) in their first semester of study in the program. The majority of prospective teachers enrolled in the two credit-hour mandatory, Introduction to Instructional Technology course in the Fall semester of their third year. The second survey (posttest) was administered at the end of this course. The course content included word processing, electronic mail, spreadsheets, computer graphic, instructional software, library databases, and audiovisual material production and utilization. The last survey (follow-up test) was given at the end of student teaching semester (Fall semester of their fifth year). Only a proportion of senior students took a three-credit elective advanced computer technology course.
Instrumentation The Computer Technology Survey includes three parts: demographic information and two instruments—Attitudes Toward Computer Technologies (ACT) and Self-Efficacy with Computer Technologies (SCT) (see Appendix). The demographic section contained questions to elicit the student’s identification number, age, sex, racial/ethnic status, degree/program enrolled, major, employment, frequency of use and course experience in using
378
Milbrath and Kinzie
six common technologies (word processing, e-mail, spreadsheets, database management software, statistical packages, and CD-ROM databases). Frequency of using each computer technology was assigned to five levels (never = 1; at least once/year = 2; at least once/month = 3; at least once/week = 4; daily = 5). Responses for course experience with the six types of computer technologies were coded as No = 0 and Yes = 1. The ACT scale consists of 19 items to assess perceived comfort/anxiety with (8 items) and perceived usefulness (11 items) of computer technologies. To obtain the ACT score, responses to the negatively phrased item stems were re-coded (1=4, 2=3, 3=2, and 4=1) and summed for each subscale. The highest possible score for the comfort/anxiety scale was 32 , and 44 for the perceived usefulness scale (the highest possible total score was 76). The SCT scale contains 46 items: 10 items on word processing, 9 items on electronic mail, 7 items on spreadsheet software, 7 items on database management software, 7 items on statistical packages, and 6 items on CDROM databases. The SCT scores were summed and reported separately for each type of computer technology. For the purpose of interpretation, the four-point scale discriminated four distinct levels of perceived self-efficacy with a computer technology: very low (strongly disagree), low (slightly disagree), high (slightly agree) and very high (strongly agree). Construct validity was tested using Principal Component Analysis with varimax rotation. Sets of item loadings indicated a valid measure of each factor extracted. High internal consistency reliability (alpha) estimates for the factors on the ACT scale and the SCT scale were also reported (Kinzie et al., 1994).
Data Collection and Analysis The data collection process started in the Fall semester of 1991. All surveys were conducted in a classroom setting so the response rates were generally high. Only those who failed to take the class or who were absent from the class when the survey took place did not respond. The same data collection strategy was used with the next prospective teacher panel in the Fall semester of 1992. The last set of data for this cohort was collected in the fall of 1995. Data collected over the three time periods were combined and matched by preservice teachers’ student IDs. Only responses from those who completed all three surveys were selected for statistical analyses. After data screening and matching, Panel One (n=108) was designated Cohort 1 (n=44), and Panel Two (n=104) was Cohort 2 (n=42). Demographic variables such as age, sex, ethnic background and computer course experience were analyzed using descriptive, t-test and Chi-Square statistics.
Computer Technology Training for Prospective Teachers
379
Fourteen individual univariate analyses (ANOVA) were conducted to analyze change over time. Each ANOVA was a repeated-measure two-factor (time by cohort) design. No control or manipulation was administered to the study sample.
RESULTS The data screening and matching process yielded an unexpectedly high data attrition rate (59%) even though each response rate was high. Possible explanations included: (a) a proportion of students dropped out of the program after the 1st or 2nd survey or did not complete the program at the same pace as their peers did; (b) some students joined the program late (in their third year instead of second year) but still graduated after the fifth year; (c) during the fifth-year students’ teaching internship, each contentendorsement group met at a different schedule, and attendance (and completion of the research measures) was subject to students’ teaching schedule; (d) a number of post-baccalaureate Master’s degree students were present at the teaching internship meeting with the fifth-year students and completed the measures. To find out if the selected sample was significantly different from the rest of the panel, each panel was divided into seven groups (based on their participation in the three surveys) for statistical comparisons. Significant group differences were found in Panel One between those who completed all three surveys (n=44) and the group (n=21) who participated only in the last survey (Lin, 1997). Nineteen out of the 21 respondents did not identify themselves as fifth-year preservice students. It was likely that members of this group were Master’s program students whose responses were collected by accident. The decision of only analyzing responses from those who completed all three surveys was retained. The selected study sample consisted of 86 subjects (Cohort 1: n=44; Cohort 2: n=42). The results of t-test and Chi-Square comparisons indicated no significant cohort differences in age, gender ratio, proportions of ethnic backgrounds and course exposure to six selected computer technologies (word processing, e-mail, spreadsheets, database management, statistical packages, and CD-ROM databases) at each time period. However, it was documented that Cohort 1 learned to use e-mail with an old Prime computer mail system and Cohort 2 with the newer VA-PEN system (Lin, 1997). Results of 14 ANOVAs indicated that changes in these variables were statistically significant. Tukey post hoc tests were done to identify when the change occurred. In the meantime, statistically significant differences between the two cohorts were found in some variables.
380
Milbrath and Kinzie
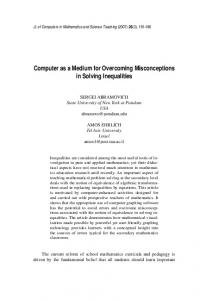
Change in Frequency of Use Over Time A significant time effect was found in frequency of using all six selected computer technologies. Between Time 1 and Time 3, frequency of using statistical packages was the only variable that did not change significantly. From Time 1 to Time 2, only frequency of using database management software did not show significant increase while from Time 2 to Time 3, only frequency of word processing continued to increase significantly. Table 1 contains the mean scores and summary of the Tukey post hoc tests for the six frequency of use variables. When looking at the variables individually, all three post hoc comparisons of frequency of word processing were significant (Time 1 < Time 2 < Time 3). For frequency of using e-mail, spreadsheets, and CD-ROM databases, significant increases were found between Time 1 and Time 2 but not between Time 2 and Time 3 (Time 1 < Time 2 = Time 3). Frequency of using database management software did not show significant increase from Time 1 to Time 2 and from Time 2 to Time 3. However, the overall increase between Time 1 and Time 3 was significant (Time 1 = Time 2; Time 2 = Time 3; Time 1 < Time 3). Frequency of using statistical packages showed significant increase between Time 1 and Time 2. However, the decrease between Time 2 and Time 3 canceled out the overall increase between Time 1 and Time 3 (Time 1 < Time 2; Time 2 = Time 3; Time 1 = Time 3).
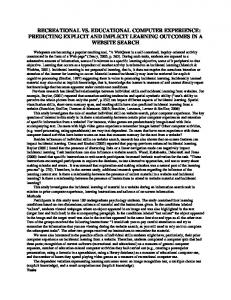
Change in Computer Attitudes Over Time A significant time effect was found in both attitudinal variables. No significant cohort effect or time by cohort interaction effect was found. A summary of mean scores and Tukey pairwise post hoc tests of computer attitudes can be found in Table 2. Both perceived computer comfort and perceived computer usefulness showed significant change between Time 1 and Time 3. For perceived computer comfort, increase between Time 1 and Time 2 was not significant but increase between Time 2 and Time 3 was (Time 1 = Time 2 < Time 3). For perceived computer usefulness, neither the increase between Time 1 and Time 2 nor the increase between Time 2 and Time 3 was significant (Time 1 = Time 2; Time 2 = Time 3; Time 1 < Time 3). Change in the two computer attitude variables did not quite follow the change pattern of frequency of using computer technology.
Computer Technology Training for Prospective Teachers
381
Table 1 Summary of Tukey Post Hoc Tests for the Time Effect of Frequency of Using Selected Computer Technologies Frequency of Use
Time 1
n Word processing M SD E-mail M SD Spreadsheets M SD
a
Tukey Post Hoc Test q 2&3 q 1&3 1&2
3
3.44a 0.88
3.91 0.73
4.22 0.71
6.71*
4.43*
11.14*
2.14 1.37
4.02 0.79
3.89 0.82
20.89*
1.44
19.44*
1.42 1.37
2.12 0.79
2.09 0.82
10.00*
0.43
9.57*
1.23 0.61
1.40 0.85
1.51 0.90
2.83
1.83
4.67*
1.04 0.19
1.26 0.78
1.20 0.56
4.40*
1.20
3.20
1.12 0.39
2.45 0.92
2.28 0.88
19.00*
2.43
16.57*
86
85
85
Database mgmt. 83 M SD Statistical packages 84 M SD CD-ROM databases 85 M SD Note.
q
2
out of 5 points possible;Tukey post hoc test a level = .05
Table 2 Summary of Tukey Post Hoc Tests for the Time Effect of Computer Attitudes Computer Attitudes
Time
n Perceived comforta 81 M SD Perceived usefulnessb 75 M SD Note.
a
1
Tukey Post Hoc Test 2
3
q
1&2
q 2&3
q
1&3
21.42 5.14
22.42 5.45
24.85 5.24
2.86
6.94*
9.80*
37.32 4.18
38.29 5.18
39.45 4.16
2.55
3.05
5.61*
out of 32 possible;b out of 44 possible;Tukey post hoc test a level = .05
382
Milbrath and Kinzie
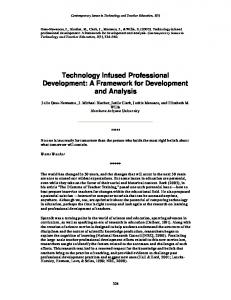
Change in Perceived Self-Efficacy Over Time A significant time effect was found in perceived self-efficacy with all six selected computer technologies. Mean scores of all six variables increased significantly between Time 1 and Time 3. From Time 1 to Time 2, four variables showed significant increase while from Time 2 to Time 3, only two indicated significant increase. Table 3 summarizes the mean scores and result of Tukey post hoc comparisons. For perceived self-efficacy with word processing, all three post hoc comparisons were significant (Time 1 < Time 2 < Time 3). For perceived self-efficacy with e-mail, spreadsheets and CD-ROM databases, significant change was found between Time 1 and Time 2 but not between Time 2 and Time 3 (Time 1 < Time 2 = Time 3). For perceived self-efficacy with database management software, no significant change was found between Time 1 and Time 2, and between Time 2 and Time 3 (Time 1 = Time 2; Time 2 = Time 3; Time 1 < Time 3). For frequency of using statistical packages, change between Time 1 and Time 2 was not significant but change between Time 2 and Time 3 was (Time 1 = Time 2 < Time 3). Table 3 Summary of Tukey Post Hoc Tests for the Time Effect of Perceived SelfEfficacy with Selected Computer Technologies Perceived Self-Efficacy
n Word processinga 86 M SD E-mailb 8 4 M SD Spreadsheetsc 83 M SD Database mgmt.d 81 M SD Statistical packagese 82 M SD CD-ROM databasesf 82 M SD Note.
a
Time 1
2
Tukey Post Hoc Test 3
q
1&2
q
1&3
34.78 5.91
36.98 3.69
38.74 2.47
6.47*
5.18*
11.65*
20.12 11.01
32.89 3.60
33.69 3.31
20.60*
1.29
21.89*
14.31 7.12
21.71 4.15
20.74 5.84
13.21*
1.73
11.48*
10.63 5.79
11.54 6.07
13.32 7.26
1.60
3.12
4.72*
9.29 4.84
9.40 4.57
11.49 5.34
0.24
4.54*
4.78*
7.83 4.35
16.67 5.64
15.88 6.38
16.68*
1.49
15.19*
out of 40 possible;b out of 36 possible;c out of 28 possible out of 28 possible;e out of 28 possible;f out of 24 possible Tukey post hoc test a level = .05 d
q 2&3
Computer Technology Training for Prospective Teachers
383
Cohort Difference Across Time A significant cohort effect was found in frequency of using e-mail and perceived self-efficacy with word processing. Separated cohort mean and standard deviation scores of frequency of using e-mail are presented in Table 4 and Table 5. Cohort 2 (Mean=3.59; out of 5 possible) showed a higher averaged frequency of use in e-mail than Cohort 1 (Mean=3.12). Cohort 2 (Mean=37.61; out of 40 possible) also had a higher level of perceived selfefficacy with word processing than Cohort 1 (Mean=36.09). A significant cohort effect as well as a significant time by cohort interaction effect were found in perceived self-efficacy with e-mail. Analysis of simple main effects for both factors is summarized in Table 6. Both cohorts showed significant increase in perceived self-efficacy with e-mail between Time 1 and Time 2, and between Time 1 and Time 3 but not between Time 2 and Time 3 (Time 1 < Time 2 = Time 3). Cohort 2 appeared to have a higher level of perceived self-efficacy with e-mail than Cohort 1 across time but the cohort difference decreased over time. Table 4 Means and Standard Deviations for Frequency of Using Electronic Mail of Cohort 1 and Cohort 2 Cohort
n
Meana
SD
1 2
44 42
3.12 3.59
0.98 0.96
Note. a mean score out of 5 possible
Table 5 Means and Standard Deviations for Perceived Self-Efficacy with Word Processing of Cohort 1 and Cohort 2 Cohort
n
Meana
SD
1 2
44 42
36.09 37.61
4.56 3.20
Note. a mean score out of 40 possible
384
Milbrath and Kinzie
Table 6 Summary of Separate Analyses for Interpreting the Cohort By Time Interaction Effect of Perceived Self-Efficacy with Electronic Mail Simple Main Effect
Time Effect
n
Cohort 1 43 Ma SD Cohort 2 41 M SD
Time 1 84 M Time 2 84 M Time 3 84 M
Tukey Post Hoc Test q 1&2
1
2
15.07 8.43
31.77 4.05
32.98 3.55
166.31*** 21.41*
25.41 10.99
34.07 2.62
34.44 2.90
27.85*** 8.93*
Cohort 1
Cohort Effect
F
Time 3
Cohort 2
q 2&3
q
1&3
1.55 22.96*
0.38
9.31*
t
15.07
25.41
4.85***
Cohort 1 < Cohort 2
31.77
34.07
3.18**
Cohort 1 < Cohort 2
32.98
34.44
2.23*
Cohort 1 < Cohort 2
Note.a mean score out of 36 possible;* p < .05** p < .01*** p < .001 Tukey post hoc test a level = .05
DISCUSSION Change Over Time Between Time 1 and Time 2, nine variables changed significantly and five variables did not. These five variables were: l l l l l
frequency of using database management software; perceived computer comfort; perceived computer usefulness; perceived self-efficacy with database management software; and perceived self-efficacy with statistical packages.
It was likely that the increases in use and self-efficacy with some of these technologies were related to course exposure and class assignments. For example, basic word processing and e-mail skills were introduced in the short computing tool class sessions. Using word processing, e-mail, and
Computer Technology Training for Prospective Teachers
385
spreadsheet programs was part of the introductory instructional technology course requirements. Cohort 2 also received training on library CD-ROM databases searching. Since database management software and statistical packages were never introduced in the three short class sessions or the one required introductory instructional technology course, it is not surprising that no significant increase related to them was found. However, the significant increase in frequency of using statistical packages might be due to the possibility that Psychology and Math Education majors often used some statistical packages within their subject area studies. On the other hand, the increase of perceived computer comfort and perceived computer usefulness at Time 2 were not statistically significant. It might be because the majority of preservice teachers in this study initially had positive computer attitudes. Between Time 2 and Time 3, only a proportion of prospective teachers took an elective instructional computing course. It is hard to determine the course effect on the study sample. While most variables did not show significant change, four variables did. They were: l l l l
frequency of using word processing; perceived computer comfort; perceived self-efficacy with word processing; and perceived self-efficacy with statistical packages.
In other research, teacher education students were found to have more experience using computers for word processing than for other purposes (Hunt & Bohlin, 1993; Mowrer-Popiel, Pollard, & Pollard, 1994). In this study, prospective teachers’ frequency of using word processing and perceived self-efficacy with word processing continued to increase significantly across time. It also appeared that as frequency of using one type of technology stopped increasing, the associated perceived self-efficacy level stopped increasing as well. The only notable exception was the significant increase in perceived self-efficacy with statistical packages between Time 2 and Time 3. This might be related to the previous significant increase in use between Time 1 and Time 2, or perhaps other factors. One thing to note is that the significant increase in perceived self-efficacy with statistical packages was caused by only a small number of prospective teachers (possibly psychology and math education majors) as the mean scores were small and the standard deviations were relatively large. Delcourt and Kinzie (1993) suggested, “experience with computer technologies, either through a course or through frequent use, is a critical area for examination in the study of attitudes and self-efficacy” (p. 40). Nevertheless, course exposure to, and frequent use of, computer technology may exert a more direct impact on the
386
Milbrath and Kinzie
development of perceived self-efficacy than on overall change in attitudes. The significant increase in prospective teachers’ perceived computer comfort was not found until after Time 2, and the significant increase in perceived computer usefulness was not detected until Time 3.
Cohort Difference The authors expected that Cohort 1 would not be statistically different from Cohort 2 since no significant cohort differences in age, gender, and ethnic background were found. However, statistical analyses showed that Cohort 2 had higher frequency of using e-mail and higher levels of perceived self-efficacy with word processing and e-mail than Cohort 1 across time. Although both cohorts appeared to have similar computer training, Cohort 2 entered the teacher education program a year later than Cohort 1 did. With the rapid advancement of technology, it was likely that some events or changes in the environment might affect the training outcomes. As mentioned previously, in Fall 1990, Cohort 1 was introduced to the email system on the Prime computers but in Fall 1991, Cohort 2 switched to the Virginia’s Public Electronic Network (VA-PEN) system, which had a better user interface. This difference might have contributed to the cohort differences found in the frequency of using e-mail and the perceived selfefficacy with e-mail.
Instructional Implications These changes suggested positive effect from the computer training that these prospective teachers received. The training experience would include three short computing tool class sessions, one required instructional technology course, a possible elective instructional computing course, and the educational environment that UVA’s teacher education program provided, such as faculty modeling in methods courses or prospective teachers’ learning with a practicing teacher during the teaching internship. Nevertheless, prospective teachers’ class experience with the three short class sessions and a mandatory course was strongly reflected in the measurements taken at Time 2. The development of computer attitudes and self-efficacy with computer technology requires time. The accumulative effect of computers may also play a role to the development. Certain limits prevented this
Computer Technology Training for Prospective Teachers
387
longitudinal study from addressing the causal relationship between selected variables. The educational intervention experience could not be controlled. When examining the change patterns, frequency of use and perceived self-efficacy with a type of computer technology appeared to be related. Word processing and e-mail were used by prospective teachers most frequently; thus, prospective teachers’ perceived self-efficacy with these two technologies was also higher. As database management software and statistical packages were used least frequently, the perceived self-efficacy levels turned out to be the lowest. This kind of contrast in change pattern suggests that if spreadsheets and database management have subject-specific instructional applications (such as math and social science), prospective teachers need to be exposed to them and encouraged to use them more frequently. This may also apply to those innovative technologies like multimedia project, hypermedia, distance education, and online learning available through the Web.
References Ashton, P.T., & Webb, R.B. (1986). Making a difference: Teachers’ sense of efficacy and student achievement. New York: Longman. Bandura, A. (1986). Social foundations of thought and action-A social cognitive theory. Englewood Cliffs, NJ: Prentice-Hall. Campbell, N.J. (1992). Enrollment in computer courses by college students: Computer proficiency, attitudes and attributions. Journal of Research on Computing in Education, 25(1), 61-74. Campbell, N.J., & Williams, J.E. (1990). Relation of computer attitudes and computer attributions to enrollment in high school computer courses and self-perceived computer proficiency. Journal of Research on Computing in Education, 22(3), 276-289. Delcourt, M.A.B., & Kinzie, M.B. (1993). Computer technologies in teacher education: The measurement of attitudes and self-efficacy. Journal of Research and Development in Education, 27(1), 35-41. Dupagne, M., & Krendl, K.A. (1992). Teachers’ attitudes toward computers: A review of the literature. Journal of Research on Computing in Education, 24(3), 420-429. Dwyer, D.C., Ringstaff, C., & Sandholz, J.H. (1990). Teacher beliefs and practice part I: Patterns of change (Apple Classrooms of Tomorrow Research Report #8). Ertmer, P.A., Evenbeck, E., Cennamo, K.S., & Lehman, J.D. (1994). Enhancing self-efficacy for computer technologies through the use of positive classroom experiences. ETR&D, 42(3), 45-62.
388
Milbrath and Kinzie
Evans-Andris, M. (1995). An examination of computing styles among teachers in elementary schools. ETR&D, 43(2), 15-31. Faison, C.L. (1996). Modeling instructional technology use in teacher preparation: Why we can’t wait. Educational Technology, 36(5), 57-59. Gabriel, M.A., & MacDonald, C.J. (1996). Preservice teacher education students and computers: How does intervention affect attitudes? Journal of Technology and Teacher Education, 4(2), 91-115. Hakkinen, P. (1995). Changes in computer anxiety in a required computer course. Journal of Research on Computing in Education, 27(2), 141-153. Hall, G.E., George, A.A., & Rutherford, W.L. (1977). Measuring the stages of concern about the innovation: A manual for use of the stages of concerns questionnaire. Austin, TX: Research and Development Center for Teacher Education, The University of Texas. Handler, M.G. (1993). Preparing new teachers to use computer technology: Perceptions and suggestions for teacher educators. Computers Education, 20(2), 147-156. Hill, T., Smith, N.D., & Mann, M.F. (1987). Role of efficacy expectations in predicting the decision to use advanced technologies: The case of computers. Journal of Applied Psychology, 72(2), 307-313. Hunt, N.P., & Bohlin, R.M. (1993). Teacher education students’ attitudes toward using computers. Journal of Research on Computing in Education, 25(4), 487-497. Jorde-Bloom, P. (1988). Self-efficacy expectations as a predictor or computer use: A look at early childhood administrators. Computers in Schools, 5(1/2), 45-63. Kernan, M.C., & Howard, G.S. (1990). Computer anxiety and computer attitudes: An investigation of construct and predictive validity issues. Educational and Psychological Measurement, 50, 681-690. Kinzie, M.B., Delcourt, M.A.B., & Powers, S.M. (1994). Computer technologies: Attitudes and self-efficacy across undergraduate disciplines. Research in Higher Education, 35(6), 745-768. Koohang, A.A. (1989). A study of attitudes toward computers: Anxiety, confidence, liking and perception of usefulness. Journal of Research on Computing in Education, (Winter), 137-150. Lin, Y.-C. (1997). Preservice teachers’ computer use, computer attitudes and perceived self-efficacy with computer technology: A longitudinal study. Unpublished doctoral dissertation, University of Virginia, Charlottesville. Liu, M., Reed, W.M., & Phillips, P.D. (1992). Teacher education students and computers: gender, major, prior computer experience, occurrence, and anxiety. Journal of Research on Computing in Education, 24(4), 457-467. Loyd, B. H., & Gressard, C. (1984). Reliability and factorial validity of computer attitudes scales. Educational and Psychological Measurement, 44(2), 501-505. Marcinkiewicz, H.R. (1994). Computers and teachers: Factors influencing computer use in the classroom. Journal of Research on Computing in Education, 26(2), 220-237.
Computer Technology Training for Prospective Teachers
389
McInerney, V., McInerney, D.M., & Sinclair, K.E. (1994). Student teachers, computer anxiety and computer experience. Journal of Educational Computing Research, 11(1), 27-50. Miura, I.T. (1987). The relationship of computer self-efficacy expectations to computer interest and computer enrollment in college. Sex Roles, 16(5/6), 303-311. Mowrer-Popiel, E., Pollard, C., & Pollard, R. (1994). An analysis of the perceptions of preservice teachers toward technology and its use in the classroom. Journal of Instructional Psychology, 21(2), 131-138. Murphy, C. A., Coover, D., & Owen, S. V. (1989). Development and validation of the computer self-efficacy scale. Educational and Psychological Measurement, 49, 893-899. Office of Technology Assessment, U. S. C. (1995). Teachers and Technology: Making the connection (OTA-EHR-616). Washington, DC: U.S. Government Printing Office. Olivier, T.A. (1985). The relationship of selected teacher variables with self-efficacy for utilizing the computer for programming and instruction. Unpublished doctoral dissertation, University of Houston, Olivier, T.A., & Shapior, F. (1993). Self-efficacy and computers. Journal of Computer-Based Instruction, 20(3), 81-85. Reed, W.M., & Overbaugh, R.C. (1992, ). The comparative effects of an introductory versus a content-specific computer course for educators on computer anxiety and stages of concern. Paper presented at the Annual Meeting of the American Education Research Association. Reed, W.M., & Overbaugh, R.C. (1993). The effects of prior experience and instructional format on teacher education students’ computer anxiety and performance. Computers in the Schools, 9(2/3), 75-89. Robertson, S.I., Calder, J., Fung, P., Jones, A., & O’Shea, T. (1995). Computer attitudes in an English secondary school. Computers Education, 24(2), 73-81. Salomon, G. (1984, October). Computers in education: Setting a research agenda. Education Technology, 7-11. Schunk, D.H. (1984). Self-efficacy perspective on achievement behavior. Educational Psychologist, 19(1), 48-58. Sheingold, K., & Hadley, M. (1990). Accomplished teachers: Integrating computers into classroom practice. New York: Center for Technology in Education, Bank Street College of Education. Stimmel, T., Connor, J.L., McCaskill, E.O., & Durrett, H.J. (1981). Teacher resistance to computer-assisted instruction. Behavior Research Methods & Instrumentation, 13(2), 128-130. Strang, H., Landrum, M., & Ulmer, C. (1991). A self-administered simulation for training basic classroom skills. Computers in the Schools, 8(1/ 2/3), 229-243.
390
Milbrath and Kinzie
APPENDIX Computer Technologies Survey The purpose of this survey is to find out how people feel about computer technologies in many professions. Results from this survey will be used to help determine how computer technologies are perceived and used in different professions. Your responses are an important contribution to the process. Within this survey, the term computer technologies is defined as the use of computers and related hardware and software to perform specific tasks. Computer technologies are most often used for: word processing (e.g., WordPerfect, Word, AppleWorks), communicating with others (e.g., electronic mail, bulletin boards), accounting (spreadsheets), database creation and management, statistical analysis, and searching CD-ROM bibliographic data bases (e.g., ERIC). When responding to the following statements, consider your use of any or all of these technologies. There are three segments to this survey: Background Information, Attitudes, and Confidence. It should take about 10 minutes to complete all sections. Your responses will be kept completely confidential. Thank you in advance for your participation.
Part One: Background Information Please respond to each of the following items: 1. ID Number (if currently enrolled as a student): 2. Age: 3. Sex (circle one):
male
female
4. Please indicate your racial/ethnic status (circle one): African-American Caucasian (non-Hispanic) Hispanic Native American Asian/Pacific Islander Other: 5. Please circle the highest degree you have received: High School Associate Bachelor’s Master’s Doctoral Other: _________
Computer Technology Training for Prospective Teachers
6.
391
If you are enrolled in a degree program at this time, please cir your current level: Undergraduate: 1st yr 2nd yr 3rd yr 4th yr Graduate: Post-Baccalaureate Master’s Specialist Other:_________
cle
5th yr Doctoral
Major (if one has been declared): 7.
Are you currently employed? (circle one): YES
• If yes:
8.
NO
Please indicate your current profession: Please indicate your current position:
How often do you use the following: (circle one number for each category)
Categories:
Never
At least once/year
At least once/month
Word Processing Software 1 2 (WordPerfect, Word, AppleWorks, etc.)
At least once/week
Daily
3
4
5
Electronic Mail 1 (e-mail, bulletin boards, etc.)
2
3
4
5
Spreadsheet Software 1 (Lotus, Excel, AppleWorks, etc.)
2
3
4
5
2
3
4
5
2
3
4
5
2
3
4
5
Data-base Management Systems 1 (dBase III, AppleWorks, etc.) Statistical Packages (SAS, SPSS, etc.)
1
CD-ROM data bases 1 (ERIC, MedLine, Dialog, Science Citation Index, etc., on CD)
9. Have you taken any courses in which you’ve learned to use these computer technologies? (please circle yes or no for each) Word Processing Software
YES
NO
Electronic Mail
YES
NO
Spreadsheet Software
YES
NO
392
Milbrath and Kinzie
Data-base Management Systems
YES
NO
Statistical Packages
YES
NO
CD-ROM
YES
NO
Part Two: Attitudes Toward Computer Technologies This survey has 19 statements about computer technologies. After reading each statement, please indicate the extent to which you agree or disagree, by circling the number to the right of each statement. Please respond to all statements. There are no correct or incorrect responses. Strongly Slightly Slightly Disagree Disagree Agree 1.I don’t have any use for computer technologies on a day-to-day basis.
1
Strongly Agree
2
3
4
2.Using computer technologies to communicate with others over a computer network can help me to be more effective in my job. 1 2
3
4
Slightly Agree
Strongly Agree
3. I am confident about my ability to do well in a task that requires me to use computer technologies. 1 2
3
4
4. Using computer technologies in my job will only mean more work for me. 1
2
3
4
5. I do not think that computer technologies will be useful to me in my profession. 1 2
3
4
6. I feel at ease learning about computer technologies. 1
2
3
4
7. With the use of computer technologies, I can create materials to enhance my performance on the job. 1 2
3
4
8. I am not the type to do well with computer technologies. 1
2
3
4
9. If I can use word processing software, I will be more productive. 1
2
3
4
Strongly Slightly Disagree Disagree
Computer Technology Training for Prospective Teachers
393
10. Anything that computer technologies can be used for, I can do just as well some other way.
1
2
3
4
11. The thought of using computer technologies frightens me.
1
2
3
4
12. Computer technologies are confusing to me.
1
2
3
4
13. I could use computer technologies to access many types of information sources for my work.
1
2
3
4
14. I do not feel threatened by the impact of computer technologies.
1
2
3
4
15. I am anxious about computer technologies because I don’t know what to do if something goes wrong.
1
2
3
4
16. Computer technologies can be used to assist me in organizing my work.
1
2
3
4
17. I don’t see how I can use computer technologies to learn new skills. 1
2
3
4
18. I feel comfortable about my ability to work with computer technologies.
1
2
3
4
19. Knowing how to use computer technologies will not be helpful in my future work.
1
2
3
4
Part Three: Self-Efficacy with Computer Technologies This survey has 46 statements about your confidence with computer technologies. The statements are grouped into 6 sub-sections, each dealing with a different aspect of computer technologies. After reading each statement, please indicate the extent to which you agree or disagree, by circling the number to the right of each sentence. Please respond to all statements, even if you have not had a great amount of experience with a particular type of computer technology. Your responses should reflect your current level of confidence with the activity described in each statement. For example: Strongly Slightly Slightly Strongly I feel confident... Disagree Disagree Agree Agree 0. Formatting a computer diskette.
1
2
3
4
By circling number 3, you indicate that you have some degree of confidence in formatting a diskette. There are no correct or incorrect responses.
394
Milbrath and Kinzie
Strongly Disagree
Slightly Slightly Disagree Agree
Strongly Agree
Word Processing:
I feel confident... 1. Using a word processing program to write a letter or a report. 1
2
3
4
2. Accessing previous files with a word processing program.
1
2
3
4
3. Making corrections while word processing. 1
2
3
4
4. Formatting text (e.g., bold, underlining) while word processing.
1
2
3
4
5. Moving blocks of text while word processing.
1
2
3
4
6. Using the spelling checker while word processing.
1
2
3
4
7. Using the searching feature in a word processing program.
1
2
3
4
8. Printing out files I’ve written while word processing.
1
2
3
4
9. Saving documents I’ve written with a word processing program. 1
2
3
4
10. Renaming a word processing file to make a back-up copy. 1
2
3
4
Electronic Mail:
I feel confident... 11. Logging on to e-mail.
1
2
3
4
12. Reading mail messages on e-mail.
1
2
3
4
13. Responding to mail messages on e-mail. 1
2
3
4
14. Deleting messages received on e-mail.
1
2
3
4
15. Sending mail messages on e-mail.
1
2
3
4
16. Sending the same mail message to more than one person on e-mail.
1
2
3
4
Computer Technology Training for Prospective Teachers
Strongly Disagree
395
Slightly Slightly Disagree Agree
Strongly Agree
I feel confident... 17.Responding privately to messages originally sent to more than one person on e-mail.
1
2
3
4
18. Forwarding messages received on e-mail.
1
2
3
4
19. Logging off of e-mail.
1
2
3
4
20. Formatting the columns and rows in a spreadsheet.
1
2
3
4
21. Naming the columns and rows in a spreadsheet.
1
2
3
4
22. Entering appropriate formulas for calculation in a spreadsheet.
1
2
3
4
23. Entering data in a spreadsheet.
1
2
3
4
24. Editing previous spreadsheet files.
1
2
3
4
25. Printing out the spreadsheet.
1
2
3
4
26. Saving a spreadsheet file.
1
2
3
4
27. Formatting data fields in a data-base.
1
2
3
4
28. Naming data fields in a data-base.
1
2
3
4
29. Entering records in a data-base.
1
2
3
4
30. Searching records in a data-base with specific terms.
1
2
3
4
31. Sorting records in a data-base.
1
2
3
4
32. Printing out records in a data-base.
1
2
3
4
33. Saving data-base files.
1
2
3
4
Spreadsheet Software:
I feel confident...
Data-base Management Systems:
I feel confident...
396
Milbrath and Kinzie
Strongly Slightly Slightly Disagree Disagree Agree
Strongly Agree
Statistical Packages:
I feel confident... 34. Entering data into a file for analysis.
1
2
3
4
35. Getting into a particular file.
1
2
3
4
36. Writing the statistical procedure.
1
2
3
4
37. Running a statistical procedure.
1
2
3
4
38. Correcting procedural errors.
1
2
3
4
39. Printing out statistical results.
1
2
3
4
40. Saving related files.
1
2
3
4
41. Using a data base on compact disc, such as ERIC, MedLine, Dialog, Science Citation Index, etc.
1
2
3
4
42. Selecting the right data base on compact disc for a specific topic.
1
2
3
4
43. Selecting search terms for a data base literature search.
1
2
3
4
44. Getting into a data base on compact disc and starting a literature search. 1
2
3
4
45. Using descriptors from a data base literature search to obtain new search terms. 1
2
3
4
46. Using the print function in a data base search on compact disc. 1
2
3
4
CD-ROM Data Bases:
I feel confident...
Thanks for your participation!