The Spanish Journal of Psychology 2012, Vol. 15, No. 1, 424-441 http://dx.doi.org/10.5209/rev_SJOP.2012.v15.n1.37348
Copyright 2012 by The Spanish Journal of Psychology ISSN 1138-7416
Computerized Adaptive Testing: The Capitalization on Chance Problem Julio Olea1, Juan Ramón Barrada2, Francisco J. Abad1, Vicente Ponsoda1, and Lara Cuevas3 1Universidad
Autónoma de Madrid (Spain)
2Universidad
3Universidad
de Zaragoza (Spain)
Complutense de Madrid (Spain)
This paper describes several simulation studies that examine the effects of capitalization on chance in the selection of items and the ability estimation in CAT, employing the 3-parameter logistic model. In order to generate different estimation errors for the item parameters, the calibration sample size was manipulated (! = 500, 1000 and 2000 subjects) as was the ratio of item bank size to test length (banks of 197 and 788 items, test lengths of 20 and 40 items), both in a CAT and in a random test. Results show that capitalization on chance is particularly serious in CAT, as revealed by the large positive bias found in the small sample calibration conditions. For broad ranges of θ, the overestimation of the precision (asymptotic Se) reaches levels of 40%, something that does not occur with the RMSE (θ). The problem is greater as the item bank size to test length ratio increases. Potential solutions were tested in a second study, where two exposure control methods were incorporated into the item selection algorithm. Some alternative solutions are discussed. Keywords: computerized adaptive testing, capitalization on chance, item parameter estimation. Se describen varios estudios de simulación para examinar los efectos de la capitalización del azar en la selección de ítems y la estimación de rasgo en Tests Adaptativos Informatizados (TAI), empleando el modelo logístico de 3 parámetros. Para generar diferentes errores de estimación de los parámetros de los ítems, se manipuló el tamaño de la muestra de calibración (N = 500, 1000 y 2000 sujetos), así como la ratio entre tamaño del banco y longitud del test (bancos de 197 y 788 ítems, longitudes del test de 20 y 40 ítems), ambos tanto en un TAI como en un test aleatorio. Los resultados muestran que la capitalización del azar es especialmente importante en el TAI, donde se obtuvo un sesgo positivo en las condiciones de escaso tamaño de la muestra. Para rangos amplios de θ, la sobrestimación de la precisión (Se asintótico) alcanza niveles del 40%, algo que no ocurre con los valores de RMSE (θ). El problema es mayor a medida que se incrementa la ratio entre el tamaño del banco de ítems y la longitud del test. Varias soluciones fueron puestas a prueba en un segundo estudio, donde se incorporaron dos métodos para el control de la exposición en los algoritmos de selección de los ítems. Se discuten también algunas soluciones alternativas. Palabras clave: tests adaptativos informatizados, capitalización del azar, estimación de los parámetros de los ítems.
This research was partly supported by two grants from the Spanish Ministerio de Educación y Ciencia (projects PSI2008-01685 and PSI2009-10341) and by the UAM-IIC Chair Psychometric Models and Applications.
Correspondence concerning this article should be addressed to Julio Olea. Facultad de Psicología, Universidad Autónoma de Madrid. 28049-Madrid (Spain). Phone: +34 914975204. E-mail:
[email protected]
424
425
CAPITALIZATION ON CHANCE IN CATS
The problem of capitalization on chance is common in different psychometric contexts when items or tests have to be selected based on their estimated parameters. An example of this problem occurs when items are selected to optimize test reliability using the classical indices of discrimination. In a subsequent administration, these same items, which were chosen because they had the highest correlation with the rest of the test, may not result in a test as reliable as in the first administration when item parameters were estimated. This happens because items with overestimated discrimination indices in the first administration have a higher probability of being selected. Capitalization also takes place in the estimation of the number of factors to retain in exploratory factor analysis models, in the evaluation of the fit of structural equation models, or in the estimation of the partial regression coefficients in regression models. The effects of capitalization on chance are directly related to the estimation errors of the parameters included in the statistical model, and depend primarily (though not exclusively) on the available sample size and the estimation method employed (Li & Lissitz, 2004). In item response theory (IRT), Bayesian estimation methods have proven to be effective when sample size is small, by incorporating into the estimation procedure information on the prior distribution of the parameters (Baker, 1992; Gao & Chen, 2005). The study of capitalization on chance in IRT models, initially pointed out by Lord (1980), was studied by Hambleton and colleagues in the 90s (Hambleton & Jones, 1994; Hambleton, Jones, & Rogers, 1993). These authors described the consequences of capitalization on chance when the usual IRT models are applied to dichotomous data obtained through the administration of random tests. The largest problem is produced by the positive estimation errors of the discrimination parameters (a). In many applied contexts, the items presented are those with a high discrimination parameter, which may increase the risk of selecting items that, on average, have positive estimation errors. If this happens, and if these errors are not considered in the estimation of the ability level (θ), the precision of the estimated ability levels may not be realistic. These authors also showed that the problem was greater when the calibration samples were smaller (! = 400) and when the item bank size to test length ratio was greater. This latter result entails important problems for the application of CATs, because the ratios tend to be higher than those available for the assembly of optimal tests. Many of the operative CATs have banks with over 500 or 1,000 items (Wise & Kingsbury, 2000). The basic idea of a CAT is to adapt the psychometric properties of the presented items to the ability level the examinee shows throughout the test. CATs are more efficient than fixed-length tests because they provide more reliable trait estimates for tests of the same length and are shorter (and need less administration time) when CATs and fixedlength tests have the same reliability (Ponsoda & Olea, 2003).
With respect to these advantages, many authors refer to the advantages of CATs, in comparison to conventional fixed-length tests, in terms of the efficiency in the precision with which θ parameters are estimated (e.g., Haley, Ni, Hambleton , Slavin, & Jette, 2006; Hambleton, Zaal, & Pieters, 1991; Luecht, Champlain, & Nungester, 1998; Nicewander & Thomasson, 1999). It is not very unusual to find statements as “For example, a 15-item CAT version of the Mathematics Knowledge test from the ASVAB has a reliability of .93 compared to .89 for the 25-item paper-andpencil version. This means that the CAT is 40 % shorter than the conventional test but has, on average, 5% higher measurement precision” (Nicewander & Thomasson, 1999, p. 239) or “In our study using a 10-item test, the average TIF [test information function] for the CAT is roughly 2.4 times larger (240% as efficient) than with a random selection of items. Translated as a reduction in test length, a 10-item CAT can provide the same precision as a 25-item test that uses a random selection of items” (Haley et al., 2006, p. 1179). One of the key objectives of the current study is to analyze the degree of overestimation of the benefits attributed to CATs (related to the precision of trait estimates) due to capitalization on chance. All of the procedures used for item selection in CAT involve optimization strategies, as they seek to reach either a minimum or a maximum on the established criterion. The item selection procedures most commonly used are Fisher’s maximum information criterion (Lord, 1977, 1980) and, in Bayesian CATs, the minimum variance criterion of the expected posterior distribution (Owen, 1975). If the 3 parameter logistic model is used in the calibration of the bank, the probability of answering an item correctly is (Birnbaum, 1968): (1) where a is the discrimination parameter, b is the difficulty parameter, c is the pseudo-guessing parameter and θ is the ability parameter for the subject. For this model, Fisher’s information function for an item can be computed using Equation 2 (Lord, 1977): (2) The test information function for each ability level is the sum of the information functions of the administered items. From the previous equations, one can verify that the information function of a test for a particular level of ability depends on: a) the discrimination parameter of the items (the larger the a parameters, the greater the information will be); b) the pseudo-guessing parameters (the smaller they
426
OLEA, BARRADA, ABAD, PONSODA, AND CUEVAS
are, the greater the information); c) the proximity between the θ ability level and the b parameters of the items; and d) the length of the test (each item adds a positive quantity to the sum). It is therefore understood that an item will maximally reduce the uncertainty about the subject’s ability parameter if its difficulty is adjusted to the ability level, if it’s highly discriminative, and if its pseudo-guessing parameter is close to zero. The problem that arises in the administration of CATs is that the item parameters that are estimated in the process of calibration of the bank are considered to be true parameters instead of parameter estimates; thus the estimation error involved in each estimate is disregarded. The effects on Equation 2 of the estimation errors of the three item parameters are not the same (van der Linden & Glas, 2000). The a parameter in the numerator of Equation 2 is squared, making its effect on the information function greater than in the other two parameters. Given the particularly relevant role of the discrimination parameter in the application of CATs, the problem of capitalization on chance can be expected to be especially important in the conditions where these parameters are overestimated. The pioneers in the study of the problem of capitalization on chance in CATs have been van der Linden and Glas. In one study, van der Linden and Glas (2000) manipulated the size of the calibration sample of an item bank. They studied the effects of the estimation errors generated in the different sample conditions on the exposure rates of the items and on the precision of the θ estimates. Some of the findings of this study were: – The items calibrated in the smaller samples had higher exposure rates for all θ levels, especially when ! = 250. – This pattern of results held even when a lax stopping criterion was in use (40 items administered). – These effects were robust with respect to the different criteria used for item selection (including maximum information and the minimum variance criterion of the expected posterior distribution) and the different methods applied for ability estimation (maximum likelihood and Bayesian). This result is consistent with those obtained in a later work by Li and Schafer (2003). – Items with a below-average discrimination parameter had virtually no exposure in any of the conditions or for any of the ability levels. – Under certain conditions of high bank size to test length ratio (for example, 1200/20), the average absolute error of estimation of θ was higher than in the conditions where the ratio was smaller. – Incorporating an exposure control method, such as the Sympson-Hetter method (Sympson & Hetter, 1985), in the item selection algorithm only partially alleviated the problem. In connection with this result, Willse (2002) constructed item pools from 1-PL, 2-PL and 3-PL models, and he compared several procedures for item selection in their ability to prevent capitalization on chance:
– a-stratified. Separating the bank into strata based on item´s a-parameter. When the CAT begins, more informative items are selected from the lower stratum. As the CAT progress, items are selected from the upper strata. – b-matching. Selecting the item with b-parameter closer to the current θ estimate. – Separate item-selection/items-scoring. Each bank was calibrated twice. The first item parameter estimates was used in the item selections. The second one was used to estimate ability and information. – 1PL only CAT. The item parameters were estimated with this model, assuming identical slopes for all items. Among the dependent variables selected, measures of information inflation (RMSE and bias of test information) were obtained. A-stratified and b-matching methods produced essentially unbiased estimates of information. The b-matching procedure was determined to be the best alternative to the maximum information CAT. Regarding possible solutions, van der Linden and Glas (2001) and Glas (2005) tested various methods in order to reduce the effects of capitalization, including cross-validation techniques and item cloning procedures. We believe that the problem of capitalization on chance in CAT deserves a more systematic analysis, because new in-depth studies might reach a different conclusion regarding the benefits that are traditionally attributed to CATs. The two major studies that have been conducted on capitalization on chance in CATs (van der Linden & Glas, 2000, 2001) had as their starting point the same calibrated item bank: 100 items from an evaluation of English proficiency in Dutch schools, calibrated with the 2PL model. In addition, the distribution of parameters in this item bank was idiosyncratic: the mean of the a parameters was .777, the mean of the b parameters was -.970 (with a maximum difficulty of 1.262), and the correlation between both parameters was positive and significant. Therefore, some of the results of these studies should be tested in other conditions, in order to assess their degree of generalization. In addition, as it will be argued later, we believe that the effects of capitalization should be studied on both the empirical and asymptotic errors that are made in the estimation of θ, because an indicator of empirical error (e.g., root mean squared error) is not always sensitive to the effects of capitalization (Li & Schafer, 2003). With this in mind, we have made some different choices compared to previous studies, which we now justify. First, the item bank that we use is eCAT-Grammar, a CAT that evaluates knowledge of written English and which is administered via the Internet for personnel selection and competency assessment of university students (Olea, Abad, Ponsoda, & Ximénez, 2004). This bank differs from the van der Linden and Glas item bank in important respects, as it has a larger number of items, and the items have a higher mean level of discrimination and more variability in difficulty.
427
CAPITALIZATION ON CHANCE IN CATS
Second, the model we use is the 3-parameter logistic model, which is the model initially used to calibrate the item bank. Thus, in contrast to the previous cited works, the errors for the pseudo-guessing parameters will also enter into the analyses. Third, the estimation method for the item parameters will be marginal Bayesian maximum likelihood (Mislevy, 1986). Other methods have more limitations regarding the consistency/bias of their estimators. This choice provides the most efficient estimation if the prior distributions of the parameters are established appropriately (Gao & Chen, 2005; Swaminathan, Hambleton, Sireci, Xing, & Rizavi, 2003). Also, more consistent with the real conditions of testing, the simulated calibration samples will not be smaller than 500 subjects. Fourth, the results of the CAT will be compared with those of a random test (RT) of the same length. The basic procedure for item selection in the administration of the adaptive test will be one that is empirically employed in eCAT-Grammar, the maximum information method, with the additional restrictions required by the selected exposure control method. Fifth, we will include measures of precision of the ability estimates that have not been used in previous studies. Successive replicas of the test will be generated, which will allow us to study the root mean squared error (RMSE) conditioned upon the levels of θ, and its two components (bias and estimated standard error) separately. In addition, we study the effects of capitalization on the asymptotic error (estimated standard error or information levels) as well, because these are the measures of precision that are obtained in actual CAT administrations. Sixth, the effects of adding to the item selection algorithm an exposure control method are also considered. From among the considerable number of control exposure methods available (Barrada, in press; Georgiadou, Triantafillou, & Economides, 2007), two methods of exposure control were selected. The first one was a well known, the b-matching method (Hulin, Drasgow, & Parsons, 1983): to select the item with a difficulty parameter that most closely matches the current estimate of the examinee´s ability. This method was the best in the Willse dissertation, because it does not consider the a parameter in the item selection. The main problem with the b-matching method is the increment in the measurement error, when comparaed with the selection by means of the Fisher information function (Barrada, Abad, & Olea, 2011; Li & Schafer, 2005). The second method selected was the progressive method (Revuelta & Ponsoda, 1998), as it is efficient both in preserving ability estimate precision and in increasing the security of the item bank. The general idea behind the progressive method is the use, at the beginning of the CAT, of a random or nearly random item selection strategy that gives a more active role to item information as the test progresses. We used the extension of the progressive method presented by Barrada, Olea, Ponsoda,
and Abad (2008), where an acceleration parameter that controls the speed at which the change from random to information-guided item selection takes place is included. The distribution of the a parameters of the items selected with the b-matching and the progressive methods is more similar to the original item bank distribution than that obtained when selecting items without an exposure control method, or with a method such as the Sympson-Hetter. Therefore, the use of these control exposure methods should reduce the selection of items with an overestimated a parameter. The main objective of our simulation studies is to describe how errors in the estimation of item parameters and capitalization on chance affects ability estimation error in adaptive and random tests (i.e., with randomly selected items). We are interested in describing the psychometric characteristics of the items administered in both types of tests. We will pay special attention to the consequences of the estimation errors of the discrimination parameters and their effects on the bias and precision of the estimated θ levels. To that end, item estimation errors are manipulated from calibrating the item banks using different sample sizes. In addition to sample size, another independent variable considered in the simulation studies is the ratio between item bank size and the test length. The main four hypotheses are listed below: a) The effects of capitalization (i.e., an overestimation of the precision) will be observed to a greater degree in the CAT than in the random test. b) In the CAT, these effects will be more pronounced in smaller item calibration sample sizes. c) They will also be more pronounced in larger bank size to test length ratios. d) If an exposure control method is incorporated into the item selection algorithm, the problems caused by capitalization will be mitigated.
Item banks
Method
Two different item banks were created, one with 197 and a second with 788 items. Ten replicas were made of each item bank. The parameters of the item banks were based on the actual item bank on which eCAT-Grammar operates, which is composed of 197 four-option items. The parameters for each replica of the bank were obtained by a random draw from a multivariate distribution having as means the a, b and c means of the parameter estimates, and as variance and covariance matrix the empirical variance and covariance matrix observed between the parameter estimates in the bank. Although the parameters of the bank have been recently updated (Abad, Olea, Aguado, Ponsoda, & Barrada, 2010), we used the original ones (Olea et al., 2004). With the same procedure, a second bank 4-times the size of the real bank (788 items) was also created. Values
428
OLEA, BARRADA, ABAD, PONSODA, AND CUEVAS
were truncated at the minimum and maximum values that were obtained from the calibration of the first bank. Both banks were calibrated under three different sample size conditions (500, 1,000 and 2,000 simulated subjects). The 3-parameter logistic model (normal metric) and the marginal Bayesian maximum likelihood procedure implemented in the BILOG program (Mislevy & Bock, 1990) were applied for their calibration. A !(0,1) distribution was assumed for the prior distribution of θ. The prior distributions assumed for the item parameters were a log-normal distribution (0.75, 0.12) for the a parameters, a !(0, 2) distribution for the b parameters, and a beta distribution (α = 76, β = 226)1 for the c parameters. Thus, c parameters have as mean the reciprocal of the number of options and as standard deviation the value .025.
Types of tests
1) Random test (RT). Items were randomly selected from the corresponding bank. 2) Two computerized adaptive tests were considered: – CAT without exposure control. The following conditions were established in the adaptive algorithm: a) A level of was randomly selected from the uniform distribution (-.5 , .5) at the beginning of the CAT; b) the maximum likelihood method was applied for ability estimation, incorporating the Dodd (1990) procedure as long as the response patterns were constant, and with the restriction that remained inside the interval (-4, 4); c) the selection of items was based on the maximum information criterion, which was evaluated according to Fisher’s function. – CAT with exposure control. From the wide variety of control methods available, we decided to use: a) the bmatching method, and b) the progressive method with an acceleration parameter equal to 1 (Barrada et al., 2008). Other choices related to item selection were the same applied in the no exposure control condition. For both types of tests, three lengths were established: 20, 30 and 40 items. Thus, 6 different ratios of bank size to test length were obtained. A thousand simulees were generated for each one of 9 θ levels, ranging from -2 to 2 in steps of 0.5.
Dependent variables
a) RMSE and bias of the administered items, with special attention given to the bias obtained for the a parameter.
1
b) P(â > a): Proportion of the items administered that have positive estimation errors in the a parameter (a proportion greater than .5 would indicate that capitalization on chance is present). c) RMSE associated with the estimation of θˆ. Its two additive components (bias and standard deviation) are also considered. d) Estimated standard error, Se, computed as the inverse of the square root of the information obtained for each ability level. Two types of estimated standard errors will be obtained for each condition, one from the item parameters and the other from their estimates. e) Relative efficacy: For each θ, the relative efficacy is defined as the ratio between the estimated information (Ie) and the real information (Ir). Ie values were calculated from item parameter estimates (aˆ, bˆ, cˆ ), while the Ir values were computed from item parameter values. A ratio above unity would indicate overestimation in precision if the parameter estimates of the items were to be employed in a real CAT administration
Parameter recovery
Results2
Table 1 contains (for different bank sizes and calibration sample sizes) the true item parameter distribution (lower lines), RMSE, bias, and Pearson´s correlation between true and estimated parameters. As expected, the results indicate good recovery of the b difficulty parameter in the different calibration conditions (r = .99). The recovery of the a discrimination parameter is better as the sample size increases, reaching a .83 correlation when the calibration is done with 1,000 subjects; the bias(a) is larger in the largest (i.e., 788) item bank condition. The recovery of the c parameter is not good even in the largest sample size condition, a result obtained in some classic studies (e. g., Hulin, Lissak, & Drasgow, 1982).
Parameter estimation errors and capitalization on chance
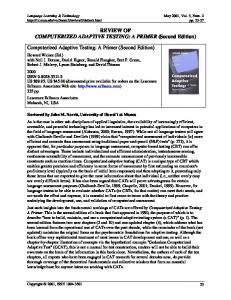
Figure 1 shows, for each θ, the RMSE values of the a parameter for the items administered in the CAT and in the random test (RT), for each calibration condition. In the random test, RMSE(a) values are fixed for the different θ values, so only one point for each condition is shown at
ALPHA and BETA as defined in BILOG (Zimowski, Muraki, Mislevy, & Bock, 2003).
The high number of studied conditions prevents us from providing results from all of them. For this reason, we will not show results from the condition that included a sample size of 2,000 or 30 and 40 items as the stopping criterion. The complete set of results can be requested from the first author. 2
429
CAPITALIZATION ON CHANCE IN CATS
Table 1 True item parameter distribution, RMSE, bias and Pearson’s correlation between true and estimated parameters for a, b and c parameters across bank size (197, 788) and calibration sample size (500, 1000) Mean SD RMSE Bias r
197
500
0.25 0.01 .73
a parameter
1.30 .31
1000 0.19 0.01 .83
500
0.25 0.05 .74
788
1.30 .31
197
1000 0.19 0.03 .83
500
.23 .98
0.15 0.04 .99
b parameter
1000 0.14 0.03 .99
500
0.16 0.04 .99
788 .22 .98
197
1000 0.13 0.01 .99
500
0.04 0.01 .48
.21 .03
c parameter
1000 0.04 0.01 .54
500
0.04 0.01 .48
788 .21 .03
1000 0.04 0.01 .53
Figure 1. RMSE(a) for CAT and random test across bank size (197: open symbols and dashed lines; 788: solid symbols and solid lines) and calibration sample size (500: circle; 1,000: triangle).
the left of the figure. First, it can be observed that the estimation errors decrease as the size of the calibration sample increases. Second, for a specific sample size, the RMSE(a) values of the administered items are in general lower in the RT than in the CAT condition, indicating that in this condition the selected items have larger estimation errors in the discrimination parameter. Third, the RMSE(a) values of the selected items in the CAT are larger for the medium and medium-high ability levels. Figure 2 shows, for the same conditions, the RMSE values corresponding to the b parameter of the items administered in the CAT and in the RT. It is can be
observed, again, the clear effect of the sample size in the estimation errors of the difficulty parameter. However, the CAT condition does not show a larger systematic estimation error than the RT condition for this parameter; for a specific sample size, the CAT selects items with a larger estimation error at the extreme levels, but not in the central part of the θ distribution. Figure 3 shows, for the same conditions, the RMSE values obtained for the c parameter of the items administered in the CAT and in the RT. The estimation errors of the pseudo-guessing parameters are larger in the items administered in the CAT for the lower θ levels. At these
430
OLEA, BARRADA, ABAD, PONSODA, AND CUEVAS
Figure 2. RMSE(b) for CAT and random test across bank size (197: open symbols and dashed lines; 788: solid symbols and solid lines) and calibration sample size (500: circle; 1,000: triangle).
Figure 3. RMSE(c) for CAT and random test across bank size (197: open symbols and dashed lines; 788: solid symbols and solid lines) and calibration sample size (500: circle; 1,000: triangle).
CAPITALIZATION ON CHANCE IN CATS
431
Figure 4. Proportion of applied items with â > a for the CAT and the random test across bank size (197: open symbols and dashed lines; 788: solid symbols and solid lines) and calibration sample size (500: circle; 1,000: triangle).
Figure 5. Bias of the a parameter for the applied items of the CAT and random test across bank size (197: open symbols and dashed lines; 788: solid symbols and solid lines) and calibration sample size (500: circle; 1,000: triangle).
432
OLEA, BARRADA, ABAD, PONSODA, AND CUEVAS
ability levels, items have lower difficulty parameters and c parameters play a more important role. It is also possible to verify that in the CAT changes in calibration sample size do not produce an effect in the RMSE(c) values of the items administered at very low levels of θ. Moreover, in general,
estimation errors reach higher levels in the RT than in the CAT condition. Figure 4 shows, for each θ level and calibration sample condition, the proportion of items administered in the CAT for which the estimator (â) exceeds the corresponding
Figure 6. RMSE(θ) values in the CAT (upper panel) and the random test (lower panel) across bank size (197: open symbols and dashed lines; 788: solid symbols and solid lines) and calibration sample size (500: circle; 1,000: triangle; true parameter: square).
CAPITALIZATION ON CHANCE IN CATS
parameter (a), P(â > a). In the case of no capitalization on chance (and assuming the absence of bias in the estimation of this parameter), the expected proportion would be .5. In fact, P(â > a) values are around this figure in the four RT conditions. Figure 4 provides strong support for the presence of capitalization when there is an adaptive selection of items. Specifically, three points stand out: 1) For almost all of the θ level range, the capitalization is larger in the smaller calibration sample condition. 2) The effects of capitalization on chance are not the same for the different levels of ability: with the largest item bank (788 items), the problem occurs to a greater degree for the central levels of θ. For some of them, when calibration sample size is 500, the proportion of administered items with overestimated a is above .9. These results also hold for greater sample sizes, for the central θ levels (approximately, between -1 and + 1.5). 3) The effects are small for extreme levels of θ. If we analyze the problem in terms of bias, Figure 5 shows the mean differences between the discrimination parameter estimates and the true parameters of the items administered in the CAT and RT conditions. A positive bias can be seen in the items selected by the CAT. Bias is larger in the smaller calibration sample, especially at the central levels of θ. In contrast, the bias of the a parameter in the RT is practically irrelevant.
Effects on the precision of the θ estimates
In order to describe the incidence of capitalization on chance on the ability estimates, the RMSE(θ) and bias(θ) values conditioned on the ability levels were computed. Figure 6 shows the RMSE values obtained for the ability estimates in the CAT (upper panel) and the RT (lower panel) for the different ratios between bank size and test length. Two additional lines were added to each figure showing what may be understood as the “true RMSE” or the RMSE obtained when the parameters of the items replace their estimates when selecting items and computing the ability level. Some interesting results should be noted. First, as expected, for both CAT and RT, the RMSE(θ) function provides smaller values for the “true RMSE” condition that for the other conditions (in which we used the estimates of item parameters), because the estimation errors of the item parameters play no role in ability estimation or item selection. Also, as anticipated, RMSE(θ) values are smaller in the CAT than in the RT condition. For the RT, very imprecise estimates were obtained for extreme levels of θ. The upper panel shows the joint incidence of the estimation errors of the three item parameters for ability estimation in a CAT. RMSE(θ) values become higher for very low levels of θ than for very high levels, because the incidence of the estimation errors of the c parameter become higher, as we have seen in Figure 3, for low ability levels.
433
In addition, the greatest differences are observed between the two sample calibration sizes at extreme θ levels. This result could be due to the higher estimation errors of b parameters for the items that are very easy or very difficult. However, no differences in RMSE(θ) are seen in the θ range [-0.5, + 1.5] between the different calibration conditions. Figure 7 shows the bias(θ) values obtained for the same simulated conditions, for both the CAT (upper panel) and RT (lower panel). A clear conclusion from the figure is that the bias obtained in the RT exceeds that obtained in the CAT condition, because in a random test item difficulties do not match ability estimates as well as they do in a CAT. Also, the bias found indicates that low θ levels are underestimated and high θ levels are overestimated, something characteristic of the maximum likelihood method which was used for the estimation of the ability parameters (Warm, 1989). With respect to the bias associated with estimations made from the CAT, the “true bias” function shows what is expected when there are no estimation errors in the item parameters. The bias function obtained for the sample conditions indicate that the CAT gives essentially unbiased estimates of ability (bias values range from -0.2 and + 0.1), that is not uncommon when the CAT length is above 10 items. The close similarity a CAT achieves between the difficulty of the items and the ability levels is the main explanation for these results, which implies that the RMSE(θ) values are mostly due to random rather than to systematic errors. The problem of capitalization on chance, which was evident when we studied the positive bias in the discrimination parameters of the CAT, does not show itself in the bias and RMSE of the θ estimates. Even though these results will be discussed later, lets observe now what happens if we obtain the estimated standard errors associated with the ability levels. Figure 8 shows the values obtained from Fisher’s information formula. The black lines refer to the standard error obtained in the “estimated” parameter conditions; that is, when the estimated parameters of the items are considered. The grey symbols refer to the standard error produced when the information is obtained with the “true” item parameters in each of the sample conditions. In the RT (represented in the lower panel), the estimated standard error that is obtained considering the real item parameters is in general below the estimated standard error obtained with the estimated parameters; obviously, both are higher to the corresponding ones obtained in the CAT. However, the estimated standard error obtained in the administration of the CAT (upper panel) shows that those obtained from the parameter estimates is less than those obtained from the item parameters within the range of θ from approximately -1 to 2. Quite likely, this estimated standard error, obtained from the parameter estimates, would be close to what researchers would find in applied contexts. Thus, this empirical measure of ability precision does show
434
OLEA, BARRADA, ABAD, PONSODA, AND CUEVAS
Figure 7. Bias of θ for the CAT (upper panel) and random test (lower panel) across bank size (197: open symbols and dashed lines; 788: solid symbols and solid lines) and calibration sample size (500: circle; 1,000: triangle; true parameter: square).
the effects of the capitalization on chance due to the adaptive selection of items with overestimated discrimination parameters. The effect can be seen more clearly if we obtain for each ability the relative efficacy, defined as the ratio
between the information obtained with estimates, Ie, and the information obtained with the item parameters, Ir (see Figure 9). If there were no estimation errors of the item parameters, the ratio between both functions for each θ value would be 1. Both panels show, for both types of tests,
CAPITALIZATION ON CHANCE IN CATS
some effects of the item estimation errors for extreme levels of θ. In addition, an important overestimation in the precision of the CAT can be seen in the range of θ between -1 and 2 when, as in empirical contexts, the estimated item
435
parameters are used to obtain the values of the information. It therefore seems clear that this overestimation is produced by capitalization on chance, because it increases with a smaller calibration sample size. For a sample size of 1,000
Figure 8. Theoretical estimated standard error of θ for the CAT (upper panel) and random test (lower panel) computed with estimated item parameters (black color) and true item parameters (grey color) across bank size (197: open symbols and dashed lines; 788: solid symbols and solid lines) and calibration sample size (500: circle; 1,000: triangle).
436
OLEA, BARRADA, ABAD, PONSODA, AND CUEVAS
Figure 9. Relative efficacy: I(estimated parameters)/I(true parameters) for the CAT (upper panel) and random test (lower panel) across bank size (197: open symbols and dashed lines; 788: solid symbols and solid lines) and calibration sample size (500: circle; 1,000: triangle).
subjects, the overestimation produced for the range of θ values between -1 and 2 is approximately between 12 and 24%. If a calibration sample of 500 subjects is used (something that is common in applied situations where the 3-parameter model is used), the information is overestimated
about 30%. In some conditions (sample size of 500 subjects, for θ equal to 1) the overestimation is close to 40%. If we observe the results obtained for the RT (lower panel) the problem is much less relevant and affects a much smaller range of ability values.
CAPITALIZATION ON CHANCE IN CATS
437
Figure 10. Proportion of applied items with â > a for the CAT across item selection method (maximum information – MI: continuous line and solid symbols; progressive – PG: discontinuous line with solid symbols; b-matching – BM: discontinuous line with open symbols) and calibration sample size (500: circle; 1,000: triangle).
Figure 11. RMSE(θ) values for the CAT across item selection method (maximum information – MI: continuous line and solid symbols; progressive – PG: discontinuous line with solid symbols; b-matching – BM: discontinuous line with open symbols) and calibration sample size (500: circle; 1,000: triangle; true parameter: square).
438
OLEA, BARRADA, ABAD, PONSODA, AND CUEVAS
Figure 12. Relative efficacy: I(estimated parameters)/I(true parameters) for the CAT across item selection method (maximum information – MI: continuous line and solid symbols; progressive – PG: discontinuous line with solid symbols; b-matching – BM: discontinuous line with open symbols) and calibration sample size (500: circle; 1,000: triangle).
Effects of including item exposure control
We will now describe the results of a CAT with and without exposure control using the b-matching method and the progressive method. The proportion of selected items with a positive bias in the a parameter will be studied first. Figure 10 describes the results obtained for each sample size (500 and 1,000 subjects) and the types of CATs. Figure 11 shows the mean values of the RMSE(θ) obtained in the simulation. Figure 12 shows the mean values of relative efficacy obtained for each θ level. The most notable results are the following: a) Introducing restrictions in the exposure control of the items in the maximum information procedure reduces the proportion of administered items that have a positive bias in their discrimination parameter. As expected, applying de b-matching method a similar proportion of items with overestimated and underestimated a parameter are selected. For most of the ability values, the reduction ranges between 5% and 10% with the progressive method. b) When the progressive method is applied, there were no differences in the precision of the θ estimations between both conditions, as reflected by the RMSE function. However, the b-matching method produces higher levels of RMSE(θ) than any other item selection methods.
c) At the θ levels where the capitalization occurred, when the control exposure method is used, a reduction in the overestimation of the precision is observed, as assessed from the relative efficacy of the asymptotic errors. This is especially important in the implementation of the b-matching method.
Discussion
The present work explores the incidence of the estimation errors of the item parameters, employing the 3parameter logistic model, in the ability estimates provided by a CAT. It includes a study of the empirical and asymptotic errors as well as the bias produced when the selection of items is performed by an adaptive algorithm. As expected, the study of parameter recoverability revealed problems in the estimations of the a and c parameters, with the first one being especially sensitive to the sample size used in the calibration of the item banks. In the simulated conditions, the estimation errors of the items that are selected in a CAT are very different from those randomly selected. Regarding the first hypothesis (more capitalization in the CAT than in the RT), the most relevant result is that the RMSE(a) values are higher in the
439
CAPITALIZATION ON CHANCE IN CATS
CAT, especially for θ levels above 0. For broad ranges of θ, in the CAT condition, it was also found that higher rates (and greater than .5) of items with an overestimated a were administered. It becomes obvious, therefore, that the problem of capitalization is produced to a greater degree in the adaptive selection of items than in the random selection, where the problem is basically irrelevant. With respect to the incidence of the capitalization on chance in the estimation of the ability levels of the subjects, we have verified that the problem does not occur in the RMSE(θ) levels. This can explain to a certain extent some of the “unexpected” results obtained in previous works (Li & Schafer, 2003). The empirical error (RMSE and bias) associated with the ability estimates is sensitive to the estimation errors of the item parameters, but it seems unaffected by the overestimation of the discrimination parameter. One of the contributions of the present work is the study of the effects of the capitalization on the estimated standard error (Se) of ability. It is in this measure of precision where the effects of the overestimation in the a parameter are detected, sometimes reaching levels close to 40% in the overestimation of the precision of the θ estimates. This result is relevant because, as it was remarked upon in the introduction, it is common to use the measure of information (or the estimated standard error of estimation) to evaluate the efficiency of the CATs with respect to fixed tests of the same length (e. g., Haley et al., 2006; Hambleton et al, 1991; Nicewander & Tomasson, 1999). In other words, some of the advantages of the CAT with respect to conventional tests are not as important as they have been typically considered. With respect to our second hypothesis (more capitalization in small sample size calibration), the most important results related to the condition of ! = 500 in comparison to the other sample sizes are: a) greater RMSE(a), RMSE(b) and RMSE(c), if we exclude in the latter case the results obtained when θ = -2.5; b) a greater proportion of items selected that have a positive error in the discrimination parameter; c) higher levels of bias(a); d) higher levels of RMSE(θ), although only slightly higher for the central range of θ; e) imperceptible differences in the bias(θ); and f) a higher relative efficacy (Ie/Ir) in the levels of ability between -1 and 2. It should be noted that the levels of θ that produce greater relative efficacy in the condition of smaller sample size corresponds to the range of values where the â estimates had a greater positive bias, and where the proportion of items with an overestimated a was higher. Therefore, it can be concluded that the largest capitalization on chance corresponds to the ! = 500 condition. Concerning the effects of the different ratios between the bank size and the test length (third hypothesis), the conditions of greater ratio produced: a) higher values of RMSE(a) and RMSE(b), despite similar values of RMSE(c) for the smallest ratios; b) greater values in P(â > a); c)
higher levels of bias(a) and imperceptible differences in bias(b) and bias(c); d) higher values of RMSE(θ), although only slightly higher for the central range of θ; e) imperceptible differences in bias(θ), except for very extreme levels of θ; and f) values of relative efficacy (Ie/Ir) higher than (in quantity and in ranges of ability values) under conditions of smaller ratios. The b-matching method as procedure of item selection almost eliminates the problem of capitalization on chance, although this greatly increases the estimation error of θ. Therefore, from a practical point of view, this may not be a satisfactory solution. The implementation of modified progressive method (Barrada et al., 2008) can be a good alternative because reduces the problem without loss in ability precision. Another option would be to combine the b-matching method, at the beginning of the test, with the maximum information criterion, for the last part of the test (Barrada et al., 2011; Leung, Chang, & Hau, 2005). There is still a need to develop parameter estimation procedures that can tackle the problem from its root, reducing the estimation errors of the item parameters, especially for the discrimination parameter. More attention should be given to the Bayesian alternatives (Tsutakawa & Jonson, 1990) or those based in the expected response functions (Mislevy, Wingersky, & Seehan, 1994). The results from some of the previous works are encouraging (Glas, 2005). In summary, we have described the problem of capitalization on chance in CAT and some of its effects on the precision of the ability estimations. We have seen that, amongst the estimation errors of the item parameters, the positive errors of a have the largest effect on the precision of the ability estimates. We have also verified the effect of the calibration sample size although our smaller sample size (500) is not unusually small. It seems reasonable then to expect that the capitalization problem would be even greater for smaller sample sizes. It also becomes evident that larger ratios between the bank size and the CAT length increase the problem, something that should be taken into account in the recommendations about the sizes of the item banks that are appropriate for CAT. A part of the percentage of the efficacy in precision that is attributed to CATs is due to capitalization on chance, but for the same test length they are still more reliable than fixed tests.
References
Abad, F. J., Olea, J., Aguado, D., Ponsoda, V., & Barrada, J. R. (2010). Deterioro de parámetros de los ítems en tests adaptativos informatizados: Estudio con eCAT. [Item parameter drift in computerized adaptive testing: Study with eCAT]. Psicothema, 22, 340–347. Baker, F. B. (1992). Item Response Theory. Parameter estimation techniques. New York, NY: Marcel Dekker.
440
OLEA, BARRADA, ABAD, PONSODA, AND CUEVAS
Barrada, J. R. (In press). Tests adaptativos informatizados: Una perspectiva general [Computerized Adaptive Testing: An overview]. Anales de Psicología. Barrada, J. R., Abad, F. J., & Olea, J. (2011). Varying the valuating function and the presentable bank in computerized adaptive testing. The Spanish Journal of Psychology, 14, 500–508. http://dx.doi.org/10.5209/rev_SJOP.2011.v14.n1.45 Barrada, J. R., Olea, J., Ponsoda, V., & Abad, F. J. (2008). Incorporating randomness in the Fisher information for improving item-exposure control in CATs. British Journal of Mathematical and Statistical Psychology, 61, 493–513. http://dx.doi.org/10.1348/000711007X230937 Birnbaum, A. (1968). Some latent trait models and their use in inferring an examinee´s ability. In F. M. Lord & M. R. Novick, (1968). Statistical theories of mental test scores (pp. 397-479). Reading, MA: Addison-Wesley. Dodd, B. G. (1990). The effect of item selection procedure and stepsize on computerized adaptive attitude measurement using the rating scale model. Applied Psychological Measurement, 14, 355–366. http://dx.doi.org/10.1177/014662169001400403 Gao, F., & Chen, L. (2005). Bayesian or non-Bayesian: A comparison study of item parameter estimation in the threeparameter logistic model. Applied Measurement in Education, 18, 351–380. http://dx.doi.org/10.1207/s15324818ame1804_2 Georgiadou, E., Triantafillou, E., & Economides, A. (2007). A review of item exposure control strategies for computerized adaptive testing developed from 1983 to 2005. Journal of Technology, Learning, and Assessment, 5. Retrieved from http://escholarship.bc.edu/ojs/index.php/jtla/article/viewFile/164 7/1482 Glas, C. A. W. (2005). The impact of item parameter estimation on CAT with item cloning. (Computerized Testing Report 0206). Newtown, PA: Law School Admission Council. Haley, S. M., Ni, P., Hambleton, R. K., Slavin, M. D., & Jette, A. M. (2006). Computer adaptive testing improved accuracy and precision of scores over random item selection in a physical functioning item bank. Journal of Clinical Epidemiology, 59, 1174–1182. http://dx.doi.org/10.1016/j. jclinepi.2006.02.010 Hambleton, R. K., & Jones, R. W. (1994). Item parameter estimation errors and their influence on test information functions. Applied Measurement in Education, 7, 171–186. http://dx.doi.org/10.1207/s15324818ame0703_1 Hambleton, R. K., Jones, R. W., & Rogers, H. J. (1993). Influence of item parameter estimation errors in test development. Journal of Educational Measurement, 30, 143–155. http://dx.doi.org/10. 1111/j.1745-3984.1993.tb01071.x Hambleton, R. K., Zaal, J. N., & Pieters, J. P. M. (1991). Computerized adaptive testing: Theory, applications, and standards. In R. K. Hambleton & J. N. Zaal (Eds.), Advances in educational and psychological testing. (pp. 341-366). Boston, MA: Kluwer. Hulin, C. L., Drasgow, F., & Parsons, C. K. (1983). Item response theory: Application to psychological measurement. Homewood, IL: Dow Jones-Irwin.
Hulin, C. L., Lissak, R. I., & Drasgow, F. (1982). Recovery of two and three parameter logistic item characteristic curves: A Monte Carlo study. Applied Psychological Measurement, 6, 249–260. http://dx.doi.org/10.1177/014662168200600301 Leung, C. K., Chang, H. H., & Hau, K. T. (2005). Computerized adaptive testing: A mixture item selection approach for constrained situations. British Journal of Mathematical and Statistical Psychology, 58, 239–257. http://dx.doi.org/10.1348/ 000711005X62945 Li, Y. H., & Lissitz, R. W. (2004). Applications of the analytically derived asymptotic standard errors of item response theory item parameter estimates. Journal of Educational Measurement, 41, 85–117. http://dx.doi.org/10.1111/j.1745-3984.2004.tb01109.x Li, Y. H., & Schafer, W. D. (2003 April). The effect of item selection methods on the variability of CAT’s ability estimates when item parameters are contaminated with measurement errors. Paper presented at the National Council on Measurement in Education Convention, Chicago, IL. Li, Y. H., & Schafer, W. D. (2005). Increasing the homogeneity of CAT’s item-exposure rates by minimizing or maximizing varied target functions while assembling shadow tests. Journal of Educational Measurement, 42, 245–269. http://dx.doi.org/10. 1111/j.1745-3984.2005.00013.x Lord, F. M. (1977). A broad-range test of verbal ability. Applied Psychological Measurement, 1, 95–100. http://dx.doi.org/10. 1177/014662167700100115 Lord, F. M. (1980). Applications of Item Response Theory to practical testing problems. Hillsdale, NJ: LEA. Luecht, R. M., De Champlain, A., & Nungester, R. J. (1998). Maintaining content validity in computerized adaptive testing. Advances in Health Sciences Education, 3, 29–41. http://dx.doi. org/10.1023/A:1009789314011 Mislevy, R. J. (1986). Bayes modal estimation in item response models. Psychometrika, 51, 177–196. http://dx.doi.org/10.1007/ BF02293979 Mislevy, R. J., & Bock, R. D. (1990). PC-BILOG 3: Item analysis and test scoring with binary logistic models (Computer Program). Mooresville, IN: Scientific Software. Mislevy, R. J., Wingersky, M. S., & Seehan, K. M. (1994). Dealing with uncertainty about item parameters: Expected response functions. Research Report 94-28-ONR. Princeton, NJ: Education Testing Service. Nicewander, W. A., & Tomasson, G. L. (1999). Some reliability estimates for computerized adaptive tests. Applied Psychological Measurement, 29, 239–247. http://dx.doi.org/10. 1177/01466219922031356 Olea, J., Abad, F. J., Ponsoda, V. & Ximénez, M. C. (2004). Un test adaptativo informatizado para evaluar el conocimiento de inglés escrito: Diseño y comprobaciones psicométricas [A CAT for the assessment of written English: Design and psychometric properties]. Psicothema, 16, 519–525. Owen, R. J. (1975). A bayesian sequential procedure for quantal response in the context of adaptive mental testing. Journal of the American Statistical Association, 70, 351–356. http://dx.doi. org/10.2307/2285821
CAPITALIZATION ON CHANCE IN CATS Ponsoda, V., & Olea, J. (2003). Adaptive and Tailored testing (including IRT and non-IRT application). In R. FernándezBallesteros (Ed.), Encyclopaedia of Psychological Assessment (pp. 9-13). London, England: SAGE. Revuelta, J., & Ponsoda, V. (1998). A comparison of item exposure control methods in computerized adaptive testing. Journal of Educational Measurement, 35, 311–327. http://dx.doi.org/10. 1111/j.1745-3984.1998.tb00541.x Sympson, J. B., & Hetter, R. D. (1985, October). Controlling itemexposure rates in computerized adaptive testing. In Proceedings of the 27th annual meeting of the Military Testing Association (pp. 973-977). San Diego, CA: Navy Personnel Research and Development Center. Swaminathan, H., Hambleton, R. K., Sireci, S. G., Xing, D., & Rizavi, S. M. (2003). Small sample estimation in dichotomous item response models: Effect of priors based on judgmental information on the accuracy of item parameter estimates. Applied Psychological Measurement, 27, 27–51. http://dx.doi. org/10.1177/0146621602239475 Tsutakawa, R. K., & Johnson, J. C. (1990). The effect of uncertainty on item parameter estimation on ability estimates. Psychometrika, 55, 371–390. http://dx.doi.org/10.1007/BF022 95293 van der Linden, W. J., & Glas, C. A. W. (2000). Capitalization on item calibration error in adaptive testing. Applied
441
Measurement in Education, 13, 35–53. http://dx.doi.org/10. 1207/s15324818ame1301_2 van der Linden, W. J., & Glas, C. A. W. (2001). Cross-validating item parameter estimation in computerize adaptive testing. In A. Boomsma, M. A. J. van Duijn, & T. A. M. Snijders (Eds.), Essays on Item Response Theory (pp. 205-219). New York, NY: Springer. Warm, T. A. (1989). Weighted likelihood estimation of ability in Item Response Theory. Psychometrika, 54, 427–450. http://dx.doi.org/10.1007/BF02294627 Willse, J. T. (2002). Controlling computer adaptive testing´s capitalization on chance errors in item parameter estimates. (Unpublised doctoral dissertation). James Madison University, Harrisonburg, VA. Wise, S. L., & Kingsbury, G. G. (2000). Practical issues in developing and maintaining a computerized adaptive testing. Psicológica, 21, 135–156. Zimowski, M. F., Muraki, E., Mislevy, R. J., & Bock, R. D. (2003). BILOG-MG: Multiple-group IRT analysis and test maintenance for binary items. Chicago, IL: Scientific Software International.
Received October 19, 2010 Revision received February 21, 2011 Accepted May 21, 2011