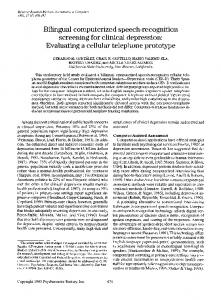
BATE predicted breakthrough curve for the Wausau, WI site adsorbers. tuned in order to understand the exact nature of the diffusion mechanism that con-.
COMPUTERIZED METHODOLOGY FOR EVALUATING DRINKING WATER TREATMENT TECHNOLOGIES: PART II IRENE M. C. LO1∗ and POTA A. ALOK2 1 Department of Civil Engineering, The Hong Kong University of Science and Technology, Clear Water Bay, Hong Kong, P.R. China; 2 Department of Civil Engineering, Kansas State University, Manhattan, U.S.A. (∗ author for correspondence)
(Received 7 August 1998; accepted 9 December 1998)
Abstract. The previously described computer based system, Best Available Technology Evaluator (BATE), is used for least cost comparison of AST and AST with GPGAC and LPGAC processes. The underlying LPGAC cost and process dynamics simulation models are complex and need to be modified and coupled in an efficient manner in order to yield useful preliminary design data. This paper discusses a technique for such model combination and a method for finding the LPGAC least cost. Sensitivity analysis of LPGAC cost and performance with respect to common operating parameters such as empty bed contact time (EBCT), hydraulic loading rate (HL), and process configuration is discussed in light of this efficient model combination and least cost finding technique. This study shows that there is an optimal combination of EBCT and LPGAC process configuration for which its cost is comparable to that of AST alone and AST with GPGAC. Such optimal combinations are discussed for some VOC scenarios. Keywords: adsorber configuration, least cost, multicomponent, liquid phase granular activated carbon adsorption, multicomponent
1. Introduction Liquid phase granular activated carbon (LPGAC) is a baseline technology for removing trace levels of many groundwater VOCs. Coupled with the versatile nature and high reliability of this process is a high treatment cost. Comparative cost analysis performed by Adams in 1991 shows that LPGAC is costlier than air stripping even when off-gas control by GPGAC is required. Because LPGAC is capable of removing organics to trace levels (sometimes to non-detectable levels, especially for drinking water treatment), efforts should be made to optimize the cost of this process. Typically, the protocol for evaluating the feasibility of LPGAC involves isotherm studies (to check if the theoretical usage rate is within acceptable limits), laboratory column studies (to find case specific rate coefficients) and pilot scale studies (to yield the most economical contact time and adsorber system configuration). In the absence of laboratory, pilot or field scale investigation, mathematical models can be used to simulate process dynamics and yield useful performance parameters such as bed life and carbon usage rate. Since it is not practical to set up a laboratory scale Water, Air, and Soil Pollution 117: 83–103, 2000. © 2000 Kluwer Academic Publishers. Printed in the Netherlands.
84
I. M. C. LO AND P. A. ALOK
study for evaluating various design alternatives and configurations of the LPGAC system, mathematical models are used for preliminary cost and performance optimization. Simulation results from these models can then be used to size laboratory and pilot scale columns. This paper looks at the ‘intelligent’ use of existing numerical models in predicting the optimal designs of LPGAC. An analysis of possible model combinations and how they process design relevant output is presented. Previous researchers (Adams, 1991; Dvorak et al., 1991) have stressed the cost competitiveness of LPGAC with AST and AST with GPGAC processes for different process configurations, but without thoroughly illustrating this for multicomponent scenarios. One aim of this paper is to illustrate the cost effective nature of different LPGAC configurations for different VOC scenarios using the proposed model combination and least cost finding technique.
2. Analysis of Existing LPGAC Numerical Models The objective of modelling the LPGAC adsorber process is to predict the breakthrough curve and related process design parameters such as carbon usage rate and carbon bed life. Existing models can be classified into the following two categories: 2.1. A DSORPTION
EQUILIBRIUM MODELS
These are based on classical thermodynamic theory, i.e., Polanyi potential theory (Polanyi, 1920), attempt to correlate the concentration of the adsorbate in the two phases of interest. These correlations are derived for a particular GAC type irrespective of the reference adsorbate used to obtain the curve. Usually, laboratory studies are conducted to obtain emperical Freundlich isotherm parameters, i.e., K (the adsorptive capacity) and 1/n (the rate of adsorption). Freundlich K and 1/n are useful in obtaining equilibrium adsorption capacity and are used extensively in mass transfer models. In the absence of laboratory studies, Freundlich K and 1/n for many compounds can be obtained from the modified Polanyi potential theory based equation proposed by Manes-Hofer (1969). These equations require simple adsorbate properties like molecular weight, solubility and density for estimating the isotherm parameters. Multicomponent equilibrium betweem adsorbates is usually modelled by the ideal adsorbed solution theory (IAST) as proposed by Luft (1985) and Crittenden et al. (1985), who give details of the IAST model development. The IAST has been successful in modelling many complex multicomponent scenarios. 2.2. A DSORPTION
COLUMN MODELS
These are used to predict the behavior of adsorbates as they travel through the fixed bed and undergo chromatographic separation. These are again classified as equilibrium models (ECM) and mass transfer models. The details of the ECM are given by
EVALUATING DRINKING WATER TREATMENT TECHNOLOGIES
85
Crittenden et al. (1987). The ECM assumes that mass transfer is negligible. It can be used for preliminary design calculations for the fixed bed LPGAC by reducing the number of components that need to be described in the mass transfer models. The procedure of reducing adsorption capacity parameters of the components to be modelled to account for the competitive effects of stronger adsorbing compounds is a useful technique to reduce the number of compounds to be modelled (Alben et al., 1992). Through a cyclic application of ECM, individual adsorbate adsorption capacity is adjusted until the ECM bed volume fed (BVF) for this individual adsorbate matches the BVF for the same adsorbate under multicomponent conditions. In this way, the Freundlich capacity parameter is adjusted for competition. The single solute mass transfer zone (MTZ) generated for the target compound should exit the column at approximately the same time as the MTZ of the target compound generated with the original mix of compounds. The ECM gives an estimate of the approximate mid point of the breakthrough curve and also evaluates the steep breakthrough profiles of certain compounds which cannot be evaluated using mass transfer models. The ECM also gives the overshoot concentration of the first compound to break through in a mixture and the minimum carbon usage rate realized under competition. This information can be used to assess the feasibility of the adsorption process and a rough estimate of the LPGAC cost. The more complex adsorption mass transfer models are: constant pattern homogenous surface diffusion model (CPHSDM) described by Hand et al. (1984), Homogenous Surface Diffusion Model (HADM), the more surface diffusion model (PSDM) and the pore diffusion model (PDM) described by Friesman et al. (1984) and Crittenden et al. (1986). All mass transfer models are pivoted on three basic mass transfer mechanisms: 1) external bulk liquid phase film transfer rate, which is characterized by the film transfer constant (Kf ), 2) Fick’s law diffusion along the GAC pore surface, which is characterized by the surface diffusion coefficient (Ds ) as in Equation (1), and 3) Fick’s law diffusion inside the inner GAC pore volume, which is characterized by the pore diffusion coefficient (Dp ) as in Equation (2). These coefficients indicate the type of transfer mechanism that dominates in a VOC scenario and thus aid in choosing the right type of model for LPGAC designs simulation. Ds = SP DF R× Dp =
εp Dl T or
εp Co Dl ρa qe
(1)
(2)
where εp , Dl , Co , ρa , qe , Tor and SPDFR are inner pore porisity of the GAC particle, free liquid diffusivity (m2 s−1 ), initial VOC concentration (µg L−1 ), apparent density of the GAC bed (kg m−3 ), equilibrium adsorption capacity (µg g−1 ), tortuosity factor of the GAC particle to account for the resistance to the intra-particle pore volume diffusion, and surface to pore diffusion flux ratio, respectively. SPDFR
86
I. M. C. LO AND P. A. ALOK
and Tor typically characterize the extent of surface diffusion and pore diffusion, respectively, by making changes to the diffusion coefficients. The CPHSDM is a simple model consisting of algebraic equations. It is applicable in systems where a single weakly adsorbing VOC limits the adsorber performance and breaks through first. For a single solute with l/n < 1, the MTZ spreads out as it travels through the fixed bed until it attains a constant shape (or constant pattern). CPHSDM is usually applicable for the following conditions: 1) influent concentrations not varying more than 10–30%, 2) bed long enough to allow the MTZ to develop fully and attain a constant pattern, and 3) plug flow conditions maintained by keeping the MTZ greater than 30 times the GAC particle size. The CPHSDM is used in conjunction with ECM such that the single critical compound and its overshoot concentration identified by the ECM are plugged into CPHSDM to yield the constant pattern breakthrough profile. The ECM with CPHSDM combination is thus an effective substitute for the more complex PDM, HSDM and PSDM, especially for scenarios where there is a weakly adsorbing VOC. This VOC travels through the bed faster than the competing VOCs and thus escapes competition and, essentially, the mixture behaves as a single VOC. The HSDM, PSDM and PDM are applicable when surface diffusion alone, both pore and surface diffusion, and pore diffusion alone, are respectively, the limiting intra-particle mass transfer mechanisms. The basic model assumptions are: 1) plug flow conditions exist in the fixed bed 2) IAST theory is applicable for multisolute equilibrium competition and 3) there is no interaction between solutes during the diffusion process. Applicability of these models for simulating breakthrough curves has been studied by several researchers (Pirbazari et al., 1991; Kuennen et al., 1989). For multicomponent scenarios where CPHSDM constraints cannot be satisfied and especially when a single VOC cannot be identified to be limiting, it becomes essential to use one of these models. The models incorporate mass transfer mechanism equations along with IAST equations and in this respect they model multicomponent scenarios. The models consist of a system of partial differential equations which are solved to yield breakthrough data. For modelling multiple VOCs, these models may encounter a ‘stiffness’ problem during the integration routine. The problem of stiffness is explained as the difficulty in finding the appropriate integrator time interval for a scenario, where the breakthrough profiles of two VOCs are totally different. That is, the breakthrough profile of VOC 1 is quite steep, while the breakthrough profile of VOC 2 is very shallow. In that case: 1. An appropriate integrator time interval for the shallow breakthrough profile will lead to a round-off error in the case of the steep breakthrough profile. 2. An appropriate integrator time interval for the steep breakthrough profile will lead to a truncation error in the case of the shallow breakthrough profile. Given this numerical difficulty in attaining reliable results, it becomes essential to reduce the number of compounds input into these models.
EVALUATING DRINKING WATER TREATMENT TECHNOLOGIES
87
3. Technique for Model Combination Because equilibrium models cannot simulate real life adsorbers by themselves and because mass transfer models show stiffness problems for complex multicomponent mixtures, a technique is developed to combine the ease of use of equilibrium models with the complexity of mass transfer models. This can be done by an effective combination of ECM and the CPHSDM, HSDM, PSDM and PDM such that the number of VOCs to be used in the mass transfer model is reduced. Since there is a decrease in the final number of VOCs, the model no longer simulates LPGAC performance for the original mixture of VOCs, and therefore appropriate reductions in the adsorptive capacity and adsorption kinetic parameters are made for the compounds included so that the effect of competition from the non-modelled compounds is automatically accounted for. The ECM is initially run to find out the limiting VOC(s). If more than one VOC is identified as a target, ECM is run till a maximum of two of three VOCs are identified as critical. This is done because of the instability of the mass transfer models for large numbers of compounds. The Freundlich parameters of the critical compounds are adjusted by running the ECM cyclically until the BVF of an individual critical adsorbate (say A) matches that of adsorbate A in the presence of other adsorbates. Once the reduced Freundlich parameters are obtained for each critical VOC, the kinetic parameters of adsorption are adjusted in the following manner suggested by Bhuvendrulingam, in 1992. If the original mixture consists of several VOCs (>5) at low concentrations (5) at high concentrations (>1 mg L−1 ), then surface diffusion is expected to dominate. The SPDFR value is higher and hence the surface diffusion coefficient increases. The SPDFR is then given by Equation (5) (Arora, 1989). SP DF R = 16.273×EBCT −0.843
(5)
88
I. M. C. LO AND P. A. ALOK
In this case, after the initial ECM run, if more than one VOC is found to be limiting, then HSDM is run to find the breakthrough profile. If one VOC is found to be limiting, the CPHSDM is run. The CPHSDM is in fact a special case of the HSDM. If the compound being modelled is a pesticide, then the effect of competition on the adsorption capacity is simulated by assuming a capacity equal to 5% of the equilibrium capacity. Several researchers (Kruithoff, 1989; Alben et al., 1992; Kuennen et al., 1988) have shown that effluent profiles of lindane, alachlor and atrazine showed reductions up to 95–99% in the equilibrium capacity in the presence of competition. Pore diffusion has been proven to be the dominant transport mechanism in the case of pesticides (Pirbazari et al., 1991). For pesticides, the Tor value was found to be independent of the EBCT (Arora, 1989). Since only the pore diffusion is expected to dominate, the PDM is run for the ECM identified limiting VOCs to obtain the breakthrough profile. 4. Modelling Adsorber Configurations With the technique described above, it is possible to get accurate estimations for the carbon usage rate for single fixed bed adsorbers. To obtain further reductions in the usage rate by effective running of adsorbers, a suitable adsorber configuration, i.e., series, parallel and series-parallel, should be designed. Let ns, np and nr be the numbers of columns in series, in parallel and those to be regenerated at any one time. Figure 1 shows the different LPGAC configurations possible. 4.1. S INGLE
COLUMN SYSTEMS
(ns = 1, np ≥ 1, nr = np)
For these systems, np ≥ 1 if the flow is too large to be handled by a single column. All columns are taken out of operation and regenerated whenever the effluent in any of the columns reaches breakthrough level. This system is not effective as it does not use the inividual carbon column to its full capacity. As shown in Equation (6), the usage rate is calculated using a single column carbon mass and the effluent at the end of the single column. Rt QCo t − Q o Ce dt Usage rate = (6) Rt � � C dt M Co − o t e where: Ce Co M t Q
= = = = =
the single column effluent concentration; the influent concentration; mass of GAC in a single contactor; the time of breakthrough; flow rate to a single column.
EVALUATING DRINKING WATER TREATMENT TECHNOLOGIES
89
Figure 1. Various process configurations of LPGAC adsorbers.
4.2. PARALLEL
COLUMN SYSTEMS
(ns = 1, np ≥ 1, nr = 1)
The columns in this system have their regeneration cycles staggered and hence at any time each column will be at a different point in the cycle. The effluent from each column is blended to give the net effluent. In this way, the columns can be operated until they reach an individual column breakthrough level beyond the maximum allowable effluent limit. Whenever the system’s effluent is reached by the blended effluent, the column in operation with the longest bed life, which will also have the highest loaded carbon, is taken out of operation and regenerated. The high individual column breakthrough levels allow the GAC of this column to approach a very high loading before regeneration, thereby reducing the usage rate.
90
I. M. C. LO AND P. A. ALOK
4.3. S ERIES
COLUMN SYSTEM
(ns > 1, np ≥ 1, nr = np)
The series system can best be described as a set of columns in series operated until the effluent of the end column reaches the maximum effluent level. At this point, the lead column is taken out of operation for regeneration and a fresh column is added as the end column. Thus, the columns taken out of operation from a series system would have used more of their adsorptive capacity than those of a single column system. They, therefore, provide a more economical alternative as the usage rate is less than that of the single column systems. Although it would be ideal to have more columns in series in order to reduce the usage rate, practical adsorber systems limit the value of ‘ns’ to three or four because of complicated piping that would be required for higher order series systems. Also, a higher water loading rate would be required for series systems. Rt QCo t − Q o C1 dt Usage rate = Rt � � C dt M Co − o t e
(7)
Equation (7) shows the usage rate for series systems. The difference between Equations (6) and (7) is in the integral in the numerator. In Equation (7), C1 is the effluent concentration from the first column, M is the mass of GAC in the first bed, Ce is the effluent from the end column, and t is the service time based on when the end column reaches breakthrough. 4.4. PARALLEL - SERIES
COLUMN SYSTEMS
(ns > 1, np ≥ 1, nr = np)
The parallel-series system consists of groups of columns in series that are purposely operated with the starting points of their operation staggered at regular intervals. Basically, it consists of a parallel system comprised of sets of columns in series rather than a single column. However, instead of removing from operation the set of columns in series that has reached the end of its operating cycle, only the lead column of the group is removed and replaced by a fresh column. This type of arrangement has the advantages of both series and parallel systems and therefore has the least carbon usage rate.
5. Cost and Least Cost Model for LPGAC The BATE program uses the LPGAC cost model proposed by Adams (1991). These equations are modular and can be easily used for sensitivity analysis of the individual cost components. Given the complex nature of the process design and costing equations, it is not feasible to combine them into a single objective function and thus a formal optimization technique cannot be used for finding the least cost. For optimization, an enumeration technique was applied wherein the simulation
EVALUATING DRINKING WATER TREATMENT TECHNOLOGIES
91
and cost models are run iteratively over the EBCT and process configuration to be used. Figure 2 shows the schematic of the least cost design model. It should be noted that the algorithm does not optimize the LPGAC with respect to the regeneration cost primarily because 1) limited data is available on the relationship between cost and regeneration cycle of the bed (time required to saturate the GAC bed), and 2) there are three reactivation options and each option has a different critical variable. Therefore, the cost of one option (off-site reactivation) will not be sensitive to changes in the critical variable of another option (multihearth furnace loading rate of on-site regeneration), thus making it difficult to compare the three options on a common basis.
6. Results and Discussion 6.1. S ENSITIVITY
OF LPGAC COST AND PERFORMANCE WITH CRITICAL OPERATING PARAMETERS
Cost and performance sensitivity analysis of certain multisolute cases based on BATE simulations yielded some preliminary process design heuristics. The important process operating parameters are EBCT and process configuration. Table I lists some multisolute scenarios considered in this study. Table I indicates that for the same compound (in multisolute cases) under different influent concentrations, a different diffusion mechanism can be limiting, resulting in different designs VOCs. Vinyl chloride is limiting in case A1 and not in case B1, despite its very low adsorbability, because the high influent concentration of o-DCB in case B1 makes it the limiting VOC. Another noticeable fact is that in scenarios consisting of a mixture of VOCs varying widely in their adsorbability (cases A1 and C1), both pore and surface diffusion are limiting mechanisms and thus PSDM is the model of choice to simulate the adsorber performance. In cases where only surface diffusion is the limiting mechanism, usually the competing VOCs show slight variation on their adsorbability (cases E1 and F1). Figure 3 is a comparison of the carbon usage rates and the unit total LPGAC cost with respect to EBCT and HL for a variety of VOC scenarios for a single column system. All cost curves show an optimum with respect to EBCT. Usually, the carbon usage rate is related to the Operation and Maintenance (O & M) cost and the EBCT to the capital cost of LPGAC. With an increase in EBCT, one would expect a rise in capital cost and a corresponding decrease in O & M cost (because of the decrease in carbon usage rate as shown in the figure). This simultaneous increase and decrease of cost components gives rise to a ‘U’-shape curve for all EBCT values. The cost optimum EBCT range for most VOC scenarios is 10–25 min. This range is a function of HL, the type of VOC being removed, treatment objective and the influent VOC concentration. Figure 3 indicates that for weak adsorbates (case A) the optimum range is shifted to the right (indicating higher EBCTs are required
92
I. M. C. LO AND P. A. ALOK
Figure 2. Flowchart for finding the least cost of LPGAC system.
EVALUATING DRINKING WATER TREATMENT TECHNOLOGIES
93
TABLE I List of single and multiple contaminant cases considered for cost sensitivity analysis of LPGAC Single solute scenarios Case
VOC
Freundlich Ka (µM g−1 )/(L/µM)1/n
A B C D E F G H I
Vinyl chloride 1,2-dichloroethane Trichloroethene o-Dichlorobenzene 1,2-dichloroethane o-Dichlorobenzene Benzene Toluene o-xylene
10.83 15.09 193 866 15.09 866 82.7 348 689.9
Freundlich 1/n
0.5150 0.4820 0.378 0.5150 0.378 0.398 0.365 0.22
Influent concentration (µg L−1 ) 200 200 200 200 1000 1000 1500 1500 1500
Multiple solute scenarios Case
VOC
Dominant mechanism
Design VOC
Model used to simulate
A1 B1 C1 D1
A,B,C,D.G A,F,C,B,G E,F,G,H B,C,I,H
PD + SD PDb PD + SD SD
PSDM PDM PSDM HSDM
E1 F1
D,H,I C,G,H
SDb SD
Vinyl Chloride o-dichlorobenzene 1,2-dichloroethane 1,2-dichlorothane, trichloroethane toluene, o-xylene benzene
HSDM ECM + CPHSDM
All LPGAC usage rates are based on C/Co = 0.02. Water temperature is 10 ◦ C. Water flow rate is 3780 m3 /d. The design VOCs shown are those obtained for the optimal design. Where only one VOC is critical and surface diffusion is dominant, ECM + CPHSDM can also be used to model the case. a The Freundlich constants were adjusted for temperature using the Polanyi Theory. b PD = Pore diffusion; SD = Surface diffusion; GAC properties are bulk density = 0.8034 g cm−3 ; void fraction = 0.641; GAC particle diameter = 0.104 cm.
for attaining the treatment objective) as compared to strong adsorbates, for which the optimum range is low (case D). The effect of HL on LPGAC cost is not as drastic as the effect of EBCT. Figure 3 clearly indicates the relative insensitivity of carbon usage rate and LPGAC cost with respect to HL. The effect of HL on both the usage rate and the cost is less at higher EBCTs than at lower EBCTs, which implies that HL becomes a dominant process parameter for short adsorbers and not
94
I. M. C. LO AND P. A. ALOK
Figure 3. Effect of EBCT on LPGAC cost and carbon usage rate for some single solute cases.
Figure 4. LPGAC least cost sensitivity to influent concentration and treatment objective for case A1.
for deep fixed beds. Because EBCT was found to influence the LPGAC cost and carbon usage rate more than HL, it was used as one of the decision variables in the least cost calculation algorithm. From the process operation point of view, it means that it is only slightly advantageous to operate at high HL. On the other hand, it is very advantageous to design for long EBCTs. It should be noted, however that LPGAC cost and usage rate are extremely dependent on the treatment objective (C/Co ) set and influent VOC concentration. Figure 4 shows that sufficient savings in LPGAC cost can be obtained for single column systems by making the treatment objective less stringent (increasing the
EVALUATING DRINKING WATER TREATMENT TECHNOLOGIES
95
Figure 5. Variation of LPGAC cost for series system.
value of C/Co ). This is especially important for single column systems where carbon usage rate is very sensitive to the treatment objective of the column. Typically, upon violation of the objective (column breakthrough), all columns on-line are taken out for regeneration. This can result in excess O & M costs. Unlike the LPGAC cost, air stripping cost is sensitive to influent VOC concentration. Figure 4 indicates a steep rise in cost at higher VOC concentrations. The rise in LPGAC cost with strict treatment objective and high influent VOC concentrations is low as the EBCT increases. This would indicate that for single fixed bed obsorbers with large depths, not much saving in cost can be obtained by reducing either the influent concentration or the treatment objective. To economize on operating costs of existing single adsorber systems, one would have to either reduce the influent VOC concentration using some pre-treatment method (i.e., air stripping as the preliminary polishing unit) or make the treatment objective less stringent. The LPGAC process is used for removing VOCs to trace or non-detectable levels and hence it is economically impractical to employ single column systems for treating very high influent concentrations and achieve non-detectable level effluents at the same time. Hence, from a design standpoint, it would seem ideal to use single column systems only when the treatment objective is less strict and influent VOC concentration is not very high. Since carbon usage rate is a function of both EBCT and configuration, it is possible for a given EBCT to reduce the usage rate by having a series system, parallel system with effluent blending or a parallel-series system, which has the dual advantage of both the series and the parallel system. Significant reduction in the LPGAC costs can be obtained by different configurations for the same EBCT. It should be noted that multiple units will always more capital cost than single units for any process. However, the main purpose of having different configurations is to reduce usage rate and hence O & M costs. For LPGAC, O & M costs
96
I. M. C. LO AND P. A. ALOK
form a significant portion of the total costs and hence an appropriate configuration is necessary. BATE simulations for a range of EBCT and HL combinations and the optimum ‘ns’ and ‘np’ values were obtained as shown in Figure 5. Certain observations can be made from this figure: 1) The total cost decrease with an increase in hydraulic loading, i.e., the least cost system operating at HL = 30 m hr−1 offers savings of around 10 cent m−3 over that of the optimal systems operating at HL = 5 mL hr−1 . 2) As the loading rate increases, the optimum value of ‘ns’ at which the total cost is minimum increases. This would be expected because as the loading rate is increased, the number of adsorbers in series will have to be increased proportionately to maintain the desired EBCT. The lead column in series operating at a high HL will use more adsorptive capacity, thereby reducing the usage rate and cost. Thus, it is advisable to operate a series adsorber system as the maximum allowable loading rate. The upper limit is generally determined by backwash frequency considerations, which in turn are linked to HL and influent VOC concentration. 3) There exists an optimum value for the number of series adsorbers for a given EBCT and loading rate. All curves in Figure 5 show a typical ‘U’ shape similar to that obtained for EBCT, showing the compensating effect of increasing capital cost and decreasing O & M cost. 4) As the number of adsorbers in series moves away from the optimum value (for that HL rate and EBCT), the rise in cost is drastic. Figure 5 thus illustrates a noticeable fact that unlike single column systems where HL does not influence usage rate (and hence the cost) very much, HL in series systems plays an important role, with EBCT, in controlling the optimum LPGAC cost. Usually, series systems are employed where the treatment objective is extremely strict. Unlike single column system, series can effectively handle high influent VOC concentrations and still attain non-detectable levels of VOC in the effluent. Given this capability, series systems are more effective in maximizing the adsorptive capacity of column. The results for cost analysis of parallel systems are shown in Figure 6, which shows variation of total LPGAC costs with the number of columns in parallel at different loading rates. The total LPGAC costs increase with an increase in loading rate. This behavior of parallel systems if contradictory to that of series systems and can be explained as follows. In a series system, when the loading rate is increased, in order to keep the total EBCT constant, one can either increase EBCT per column (by increasing the depth) or increase the number of columns (by keeping the EBCT per column constant, i.e., the depth per column constant). An increase in either of these will decrease the usage rate and hence the O & M cost and the total LPGAC cost. However, in a parallel system, increasing the loading rate will decrease EBCT per column (as the EBCT of all columns in same) and thus increase the usage rate and total costs. There exists an optimum value for np at which the total costs are minimum and this optimum decreases with the increase in loading rate. The reason is that at lower loading rates, the total adsorber sectional area will increase and since the parallel adsorber requirement is based on the sectional area, the np value will increase.
EVALUATING DRINKING WATER TREATMENT TECHNOLOGIES
97
Figure 6. Variation of LPGAC cost for parallel system.
The curves show a ‘U’ shape but, unlike the series system, there is a wide optimal region after which the capital costs increase. Also, the rise in cost for np values away from the optimal is not drastic, as opposed to the series system. The parallel system is slightly more economical than the series system, even when operated at low loading rates. This fact can be used in treating water with high solids content because a low loading rate will not necessitate the use of frequent backwashing. Parallel systems are best suited for scenarios where the treatment objective is not too strict and the influent flow rate is large to justify the use of a large number of columns staggered in operation. Figure 7 illustrates the advantage of having different adsorber configurations as opposed to the single column system. The cost difference between the single column system and the next economical series configuration is high when compared to the difference between series and other oconfigurations. Even though this trend is VOC specific, it is clear that single column systems are the least economical option for a given EBCT and that other configurations need to be investigated. For the scenario considered, the series-parallel system seems to be most economical among all other configurations for a range of EBCTs. Figure 7 also shows that for a series system, the optimal EBCT is higher (20–30 min) than that of the other configurations (10–20 min). 6.2. C OST
COMPARISON OF LPGAC WITH OTHER TREATMENT TECHNOLOGY
VOC
REMOVING
BATE simulations were run to yield a cost comparison of LPGAC under different process configurations with other competitive technologies like air stripping (AST) and air stripping with off-gas control by GAC (AST + GPGAC). The comparison is
98
I. M. C. LO AND P. A. ALOK
Figure 7. Cost comparison of different LPGAC adsorber configuration. Cost comparison of treatment processes for o-Dichlorobenzene (good adsorbate, poor bolatile).
based on certain common treatment parameters like influent VOC concentrations, water temperature, system flow rate and overall removal requirement. 6.3. S YSTEM
FLOW RATE
The economy of scale principle applied to all process treatment contactors. According to this rule, unit process costs decrease as the amount of total average system flow rate increases. BATE compared the cost of AST, AST + GPGAC and LPGAC (with different process configurations) for single solute scenarios consisting of a variety of VOCs. The VOCs considered were vinyl chloride (VC), 1,2-dichloroethane (1,2-DCA), trichloroethene (TCE), and o-dichlorobenzene (oDCB) from cases, A, B, C and D of Table I, respectively. The order of volatility for these compounds is: 1,2-DCA < o-DCB < TCE < VC and the order of adsorbability is VC < 1,2-DCA < TCE < o-DCB. Figure 8 shows the trend with respect to flow rate. For all cases, it was observed that the order of treatment cost was ASTalone < ASTcombined < AST + GPGAC. The differences in cost between ASTalone and ASTcombined were greatest for the less adsorbable VOC (i.e., VC). This is because in the AST + GPGAC system, the cost of AST is compromised in order to reduce the overall cost and this is true especially for VOCs with low gas phase adsorbability. LPGAC (single column system) showed the highest cost for all cases except o-DCB (for which LPGAC was found to be the most cost effective), primarily because o-DCB is more adsorbable than other organics. The cost differ-
EVALUATING DRINKING WATER TREATMENT TECHNOLOGIES
Figure 8. Cost comparison of treatment processes with respect to system flow rate.
99
100
I. M. C. LO AND P. A. ALOK
ences between LPGAC and AST + GPGAC were greatest for VOCs with very poor liquid phase adsorbability (i.e., VC). For TCE (which is moderately adsorbable and moderately volatile), the difference in this cost was nominal, thus indicating that further reductions in LPGAC cost are possible if proper configurations are considered. Figure 8 shows that LPGAC cost becomes competitive with that of ASTalone at very high EBCT (for single column systems) or with an increasing number of columns in series (i.e., series column systems, ns = 3). In order to find the least cost configuration for the TCE case, BATE simulations were run for a range of EBCT and usage rate, and then for each trial of EBCT, different configurations were tried. As indicated previously in Figure 7, for the same EBCT, a series-parallel system (ns = 3; np = 3; nr = 3) was found to be the most economical followed by a parallel system (with optimal number of columns shown in Figure 6), a series system (with optimal number of columns shown in Figure 5) and finally the single column system (EBCT = 45 min). 6.4. OVERALL
REMOVAL REQUIREMENT AND INFLUENT CONCENTRATION
VOC
BATE simulations were run for all these processes for numerous removal requirements ranging from low (85%) to very high (99.9%) for o-DCB, TCE„ 1,2-DCA and VC. It was found that both stripping and adsorption are effective in achieving very high VOC removal efficiency. However, stripping costs increase drastically if VOCs are to be removed to non-detectable levels. This is true for moderately volatile VOCs (i.e., TCE) which show good adsorption capacity. Usually, for VOCs with Henry’s constants greater than 1.0, 99.9% removal can be economical. But for those VOCs with Henry’s constants between 0.5 and 1.0, very high removals are not economical. It was found that, for moderately volatile VOCs (i.e, TCE), most of the rise in cost is between 90 and 100% removals. For the case of tripping, the rise in cost is more than that for LPGAC. This indicates that stripping a moderately volatile compoundto high levels in costlier than adsorbing it for trace level removals. 6.5. C OMPARISON
OF
BATE
PREDICTED RESULTS WITH PILOT SCALE DATA
The model combination scheme of BATE was verified by comparing the simulation results for the LPGAC process with pilot scale data from the Wausau, WI site (Miller, 1988). Pilot scale data consisted of removal of cis-1,2-dichloroethene (cis1,2-DCE), TCE, perchloroethene (PCE) and toluene at influent concentrations of 71, 48, 39 and 19 µg L−1 , respectively, in the presence of background organic matter (BOM). This study did not include the characterization of BOM in the least cost finding or model combination technique because of the large variety of BOMs that exist in nature. Nevertheless, suitable parameters like the SPDFR were fine
EVALUATING DRINKING WATER TREATMENT TECHNOLOGIES
101
Figure 9. BATE predicted breakthrough curve for the Wausau, WI site adsorbers.
tuned in order to understand the exact nature of the diffusion mechanism that controls the transport in this case. BOM is usually found to make pore diffusion more dominant. BATE idenified cis-1,2-DCE as the limiting VOC. Figure 9 compares the pilot scale curve with that obtained from predictions of PSDM, HSDM and ECM + CPHSDM. Of the three model curves, PSDM model predictions are closet to the pilot scale data, showing that pore diffusion is the dominant mechanism controlling the adsorption phenomenon. The HSDM model and ECM + CPHSDM model show similar trends and match the pilot scale data only at low SPDFR values.
7. Conclusions Existing numerical mass transfer models fail to yield useful design results for multicomponent scenarios in which there is a wide variation in the nature of the individual VOCs being adsorbed. A model combination technique proposed in this study reduces the number of contaminants to be modelled by the mass transfer models and thus increases the efficiency of the existing models and makes them practical to use in simulating complex VOC mixtures. Breakthrough data results obtained from this model combination scheme and the pilot scale data agree well, indicating that the proposed scheme can be used for predicting preliminary breakthrough data. This study concludes that EBCT and process configuration are the two most critical process parameters for optimizing LPGAC costs. For single column systems, optimum EBCTs were found in the range of 10–25 min. Much higher EBCTs (45 min) need to be used for very poor adsorbates, high influent concentration and strict overall removal requirement scenarios. For the same EBCT, further re-
102
I. M. C. LO AND P. A. ALOK
ductions in PLGAC costs are obtained by providing different configurations. The parallel-series systems, parallel systems and series systems are more economical, in that order. The optimal number of adsorbers to be put in series and parallel is a function of EBCT, HL and the type of adsorbate and is determined by BATE so that the best possible configuration is chosen for a given scenario. LPGAC cost comparison with ASTalone, ASTcombined and AST + GPGAC processes shows that the cost of LPGAC arranged in single column systems is the highest except for cases where the target VOC is a very good adsorbate. LPGAC in single column systems is competitive with ASTalone only at very high EBCTs (45 min), and are more economical at these EBCTs than AST + GPGAC. This high value of EBCT at which LPGAC in single column systems becomes competitive decreases as the target VOC becomes more adsorbable such that for a very good adsorbate, LPGAC becomes competitive at EBCT as low as 15–20 min. From the operation standpoint, it is advisable to employ multiple column systems with their regeneration cycles staggered and hence series-parallel, parallel and series systems should be employed. These systems are competitive with ASTalone at low EBCTs for moderate adsorbates.
Acknowledgement This research work was supported in part by Grant CF93/94.EG.01 from the Croucher Foundation, Hong Kong. The author thanks Calgon Coporation, Pittsburgh for supplying relevant real-life pilot and full-scale data in the form of manuals and catalogues for comparative purposes. The contents do not necessarily reflect views and policies of the foundation, nor does the mention of trade names or commercial products constitute endorsement or recommendation for use. References Adams, J. Q. and Clark, R. M.: 1991, J. Am. Works Assoc. 83, 49. Alben, K., Shpirt, E., Mathevet, L., Kaczmarczyk, S., Nothakun, S., Bhuvendrulingam, S., Hand, D. and Crittenden, J. C.: 1992, Consistent SOC Removal by GAC Adsorption under Dynamic Conditions. AWWA Research Foundation Report, Denver, CO. Arora, H.: 1989, Modelling of Fixed Bed Adsorbers for Multicomponent Mixtures of Known and Unknown Components. Dissertation, Michigan Tech. Univ., Michigan. Bhuvendrulingam, S. A.: 1992, Decision Algorithm for Optimizing Granular Activated Carbon Process Design. Dissertation, Michigan Tech. Univ., Michigan. Crittenden, J. C., Luft, P., Hand, D. W., Oravitz, J. L., Loper, S. W. and Ari, M.: 1985, Environ. Sci. Tech. 19, 1037. Crittenden, J. C., Speth, T. F. and Hand, D. W.: 1987, J. Environ. Engrg., ASCE, 113, 1363. Crittenden, J. C., Hutzler, N. J., Geyer, D. J., Oravitz, J. L. and Friedman, G.: 1986, Water Resources Research 22(3), 271. Dvorak, B. I., Lawler, D. F., Speitel, G. E. Jr., Jones, D. L. and Boadway, D. A.: 1991, Water Environ. Research 65(7), 827.
EVALUATING DRINKING WATER TREATMENT TECHNOLOGIES
103
Friedman, G.: 1984, Mathematical Modelling of Multicomponent Adsorption in Batch and Fixed Bed Reactors, Masters Thesis, Michigan Tech. Univ., Michigan. Hand, D. W., Crittenden, J. C. and Thacker, W. E.: 1984, J. Environ. Engrg. ASCE, 110(2), 440. Kuennen, R., Dyke, V. N., Crittenden, J. C. and Hand, D. W.: 1989, J. Am. Water Works Assoc. 81(12), 46. Kruithoff, J. C., Puijker, L. M. and Janssen, H. M. J.: 1989, Aanwezigheid en Verwijdering van Bestrijdingsmiddelen, Concept H2 O – publicatie, The Netherlands (in Dutch). Luft, P. J.: 1985, Modelling of Multicomponent Adsorption onto Granular Carbon in Mixtures of Known and Unknown Composition. Masters Thesis, Michigan Tech. Univ., Michigan. Manes, M. and Hofer, L. J. E.: 1969, J. Phys. Chem. 57, 634. Miller, J. M.: 1988, An Economic and Performance Evaluation of Air Stripping and Granular Activated Carbon for the Removal of Organic Contaminants Based on Full Scale Studies at Wausau, WI, Masters Thesis, Michigan Tech. Univ., Michigan. Pirbazari, M., Badriyaha, B. N. and Miltner, R. J.: 1991, J. Environ. Engrg., ASCE, 117(1), 80. Polanyi, M.: 1920, Adsorption von Gasen Durch ein Festes Nichtfluchtiges Adsorbens, Z. Physik 2, 111–22 (in German).