Blignaut, A. S., & Els, C. J. (2009, 27-29 May). Computers in Classrooms: Contextualising the South African Participation in the SITES 2006 Module. Paper presented at the eLearning Africa, 4th International Conference on ICT for Development, Education and Training, Dakar, Senegal.
Computers in Classrooms: Contextualizing the South African Participation in the SITES 2006 Module Prof Seugnet Blignaut Christo J. Els School for Continuing Teacher Education Faculty of Education Sciences North-West University, Potchefstroom Campus Potchefstroom, South Africa
[email protected]
Abstract The International Association for the Evaluation of Educational Achievement (IEA) initiated the Second International Technology in Education Study (SITES), a longitudinal large-scale international comparative survey on the use of Information and Communication Technologies (ICTs) in schools. The goal is to understand how ICTs effect teaching and learning in schools. SITES 2006 was the third module in this program to determine how teachers use ICTs, and to find out how school and education system factors influence teachers’ pedagogical orientation. SITES 2006 administered three questionnaires: one for school principals, one for technology coordinators, and one for mathematics and science teachers, around 400 schools in each of 23 education systems. The main study took place during 2005-2007. This paper describes the South African educational context, provides an overview of the South African participation, speculates on South Africa’s future participation, and provides a comparative glimpse of the use of ICT in South African mathematics and science classrooms.
INTRODUCTION In the 1990s the International Association for the Evaluation of Educational Achievement (IEA) initiated comparative research on the use of Information and Communication Technologies (ICTs) in schools. The Second International Technology in Education Study (SITES) aimed to uncover how ICTs influence teaching and learning processes in schools. Up to now, three international SITES studies (modules) contribute to this understanding. The first module was a school-based survey; the second module comprised a comprehensive study on how teachers use ICTs, and included comparative case studies of innovative pedagogical practices supported by ICTs. SITES 2006 (module 3) involved an international comparative longitudinal large-scale survey on the use of ICTs in schools. It investigated how school and education system factors influence teachers’ pedagogical adoption of ICTs (Pelgrim & Law, 2008). SITES 2006 started in October 2004 and the main data collection took place during 2006. In 2005 the participating countries adapted, translated and piloted three survey instruments, and trained their local project personnel and supplementary fieldworkers. Researchers from the University of Twente, the Hong Kong University, and the IEA Data Processing Centre in Hamburg Germany, coordinated this study, while National Research Coordinators (NRCs) of each country managed the local data collection and data capturing. M3 participation related to education systems, rather than to countries (Pelgrim & Law, 2008). SITES 2006 aimed to produce international comparisons of multitude indicators, recommendations for policies on ICTs in education, as well as in-depth analyses of how ICTs impact teaching and learning processes. The main SITES 2006 research questions were: What pedagogical practices do schools adopt and how do they use ICTs to implement their goal? In schools that use ICTs extensively, what ICTs do they use and how is it used? What teacher, school, community and system factors are associated with complementary pedagogical approaches and ICT use? Can an explanatory model be identified? The SITES 2006 survey of schools and teachers compared the pedagogical practices adopted in 22 participating educational systems (Table 1) and their ICT use. SITES 2006 administered three questionnaires: a questionnaire for school principals, a questionnaire for technology coordinators, and a questionnaire for mathematics and science teachers. Samples comprised around 400 schools and four teachers per school for each education system. Although most education systems collected data via an online data collection (ODC) system specially developed for this research, some education systems used a mixed-mode consisting of ODC and paper-and-pencil responses. South Africa was the only country to follow an unadulterated paper-based data collection strategy (Pelgrim & Law, 2008).
AIM OF THIS PAPER
To understand the role of ICTs in teaching and learning of a particular education system, it is imperative to place the findings of an international comparative study against the nature and trends of the national education system under investigation (Anderson & Plomp, 2008). This paper intends to provide an introduction to the South African educational context and demographics, furnish an overview of the South African participation in the SITES 2006 project, speculate on South Africa’s participation in future modules, and offer a comparative glimpse of the pedagogy use of ICTs in South African mathematics and science classrooms. We will also examine the extent to which the South African governments’ ICT policies have been implemented, as well as the effect they have on mathematics and science classrooms.
ATTRIBUTES OF THE SOUTH AFRICAN PARTICIPATION IN SITES 2006 Nature and Structure of the South African Education System Nearly a third (29.7%) of South Africa’s population is younger than fourteen. More than 90% of South Africa’s over 12.3 million potential students attend schools, a higher enrolment rate than most developing countries (South Africa.info, 2006). In 2006 the gender ratio was roughly equal (5 895 188 female and 5 913 189 male primary and secondary students attended school). In 2005, South Africa had 26 592 ordinary schools made up of 19 260 primary schools with 7,681,324 students and 228 957 teachers; 5 851 secondary schools with 3 828 705 students and 123 947 teachers; and 1 481 combined schools (Grades 1 to 12) and intermediate schools (both primary and secondary grades, but not all twelve grades) with 707 736 students and 29 229 teachers. In government-funded public schools, the average ratio of students per teacher is 31.8, while independent schools generally have one teacher for every 17.5 students. In reality, many classes regularly exceed forty students (Department of Education, 2006b). Although education is the single largest category of the government’s spending (about 24%), poverty-related educational challenges remain central. Approximately 40% of schools are classified as poor or very poor. About half of these students are exempted from school fees. About 60% of schools have electricity and 67% have telephone lines. Although many schools have sub-standard facilities, “schools-under-trees” have greatly diminished (Department of Education, 2006d). A consolidation of these statistics indicates that approximately 20% of schools meet the three basic telecommunications connectivity prerequisites, i.e., grid electricity, exchange telephone lines, and two or more connected computers per school (Holcroft, 2004). South Africa’s ICT Policy The Constitution of South Africa guarantees access to basic education for all. Consequently, legislative mandates aim to increase access to education, to equitably distribute resources and to redress past discrimination (Department of Education, 2006a). In order to consolidate and guide diverse initiatives towards educational transformation, the Ministry of Education published the White Paper on e-Education: Transforming Learning and Teaching through Information and Communication Technologies during August 2004 (Department of Education, 2004). This policy presents a framework for the strategic, political, pedagogical, and developmental facets of implementing e-Education in South Africa. The strategic objective of this e-Education policy states: “Every South African manager, teacher and student in the general and further education and training bands will be ICT capable, that is, use ICTs confidently and creatively to help develop the skills and knowledge they need as lifelong learners to achieve personal goals and to fully participate in the global community by 2013” (Department of Education, 2004, p. 17). The policy intends students to enhance their learning through the use of ICTs. Teachers are encouraged to make use of ICTs to improve effective teaching and learning practices, to enhance their management and administration, to access resources that support curriculum delivery; and to connect with other teachers and students through ICT infrastructure. The policy envisions the realisation of its strategic goals according to a multi-year implementation plan comprising of three phases: • Phase 1: Enhancing system-wide and institutional readiness to use ICTs for learning, teaching and administration • Phase 2: Integrating system-wide ICTs into teaching and learning • Phase 3: Integrating ICTs at all levels of the education (management, teaching and learning and administration) (Department of Education, 2004). The e-Education policy framework supports four key elements of ICT use in teaching and learning: equity, access to ICT infrastructure, capacity building, and norms and standards. Equal access and equal competence require the development of a technology baseline for using ICTs in education. Stable, reliable and regular access propels the effectiveness of ICTs, as well as the extent to which students, teachers, managers and administrators can access the infrastructure and build inclusive competencies. ICTs also require extensive staff development and support, as well as the professional development of practising teachers. Revision of the Norms and Standards for Educators, and the review of in-service training policies and programmes intends to ensure that teachers understand and use ICTs competently (Department of Education, 2006c). The policy on e-Education acknowledges the massive investment required to attain its strategic goals. Although the current budget provides for inherent costs, the technology component requires sustainable and predictable resources. Also, the ongoing and often escalating costs involved in providing access to technology, teacher development, pedagogical and technical support, digital content, telecommunication, as well as maintenance, upgrades and repairs to infrastructure, are all expenses not yet acknowledged in the national educational budget (Department of Education, 2004). This will require significant commitment from both public and private partnerships.
Although publishing a policy document on e-Education represents a major step into the information era, no one knows to what extent these policies make a difference in practise. The SITES 2006 study provides baseline information almost halfway into the lifespan of the e-Education policy. Future Expectations In order to put the expected growth of ICTs in South African schools into perspective, one also has to review the five-year broad national priorities of the Department of Education. These list the government’s commitment in dealing with poverty by establishing zero-fee schools, accomplishing a national schools nutrition programme, developing skills, human development, improving the quality of education in schools, improving the health of teachers and students, and developing FET colleges and Higher Educational institutions (Department of Education, 2005). In spite of the absence of a definite commitment to ICTs in the Department of Education’s five year broad priorities, the current Minister of Education acknowledged her pledge to ICT: “Bringing ICT connectivity to our schools and education institutions will and must happen … alongside the provision of basic educational infrastructure. The pace of delivery has to be accelerated” (Pandor, 2007a). The role of private and public partnerships can hardly be overstated. Demographics of the South African Education System The above overview, in combination with the issues listed in Table 1, provides a brief background of the South African education system and its participation in the SITES 2006 project. Table 1 illustrates the diversity and variation between the different education systems. In Africa, only one in every 700 people has Internet access, versus one in four in Europe. However, in South Africa, the proportional ownership of cellular phones to Internet access is high and until issues regarding African access to the Internet have been resolved, it seems wise to focus on the development of 21st century skills via cellular networks (WorldPress.org, 2004).
SOUTH AFRICAN PARTICIPATION IN SITES 2006 National Research Coordination Prof. Sarah Howie (Centre for Evaluation and Assessment, University of Pretoria (UP)) and Prof. Seugnet Blignaut (formerly from the Tshwane University of Technology (TUT)) shared the responsibility of South African National Research Coordinators (NRCs) for SITES 2006 (M3). The NRCs obtained permission from the national, as well as provincial Departments of Education, to administer the battery of surveys to schools throughout the nine South African provinces. During the national pilot study, the NRCs and a team of co-researchers administered the instruments to fifteen suburban, inner-city, semi-rural and deeprural schools from the public as well as private educational sector in Tshwane and Pretoria. The NRCs encountered minimal problems with the instruments in terms local language or comprehensibility, but determined that submitting the survey instruments as a personal interview schedule would be the most suitable, if not the only viable strategy for the South African context. Although this strategy contained a disadvantage, i.e. a single survey instrument took about an hour to complete; it also offered a decisive advantage in that it precluded missing data and also fostered a high completed survey return rate. After consultation with the IEA and the Data Processing Centre in Hamburg Germany, the South African NRCs proceeded by training fieldworkers and executing the main South African study in September 2006. Due to insufficient internet access, an online data collection (ODC) option was at best unreliable, and often unavailable, for most schools in the South African sample. The NRCs consequently invited 384 TUT Masters-level students to full-day workshops on quantitative research and fieldworker training. The NRCs conducted workshops in all nine provinces in order to prepare TUT students nationwide to act as proficient fieldworkers. Apart from a thorough theoretical grounding in quantitative research, the aspirant fieldworkers were also trained for challenging situations by practicing role playing sequences. The students also received a course pack containing high quality information on survey research, data collection and analysis, and fieldwork strategies. Before distribution, the NRCs obtained formal permission from the Dramatic Artistic and Literary Rights Organisation (DALRO) to copy these materials. Using a Geographical Information System (GIS), the NRCs matched the sampled schools to either the homes or work places of the 102 fieldworkers. As TUT had very few students in the Kwa-Zulu Natal and Northern Cape Provinces, a team of specifically trained research assistants performed fieldwork in these areas. Administrative personnel contacted each school to determine the school’s location, to ensure the school has Grade 8 mathematics and science teachers, to make appointments with the headmaster, to identify teachers for the survey interviews, and to reconfirm the fieldworker appointments at the schools. They also liaised with the fieldworkers to coordinate the school appointments and handle the provision of bursaries to the fieldworkers on acceptance of the completed survey instruments.
Fieldworkers completed an additional observation schedule on the contextual variables for each school they visited. They couriered these, as well as their completed survey instruments, to the data capturing centre at UP. The NRCs remunerated fieldworkers who presented fully completed survey instruments for their effort and travelling costs. The students experienced their training valuable and preoperational for the many challenging situations they encountered during their fieldwork: I never knew so much can go wrong, and that you have to prepare so well. I have learnt so much about research ... and how to deal with difficult headmasters. I am now trained as a fieldworker ... I think I can handle my own project much better now (Fieldworker).
The additional administration and management of the survey instruments to ensure integrity of the data, as well as the physical and financial management of the large number of fieldworkers, created an enormous administrative and managerial load on the research team. These responsibilities did not form part of the ODC mode most other NRCs followed. Complicating matters further, the two NRCs were employed by two different Higher Education Institutions (HEIs). Sampling The South African SITES 2006 sample was selected in accordance with the IEA Data Processing Centre. The Higher Education Management Information System (HEMIS) database was used to identify South African schools with Grade 8 learner. The schools were then divided into two sub-strata consisting of computer-using schools and non-computer-using schools. 504 schools were randomly selected. To protect the integrity of the data, the NRCs identified four replacement schools (two for each sub-stratum) for cases where the survey instruments could not be submitted due to unforeseen circumstances. However, in spite of meticulous selection, management, and monitoring, we encountered seven schools where the survey instruments could not be administered. Consequently, we used the school replacement option. This included sampled schools that did not exist, fieldworkers who could not get access to their assigned schools, and schools that did not honour appointments with the fieldworkers. Data Collection Collecting large amounts of data in international surveys over the internet offers substantial benefits of costs and time. However, these advantages do not provide enough grounds to implement online questionnaires unless one can prove quality in terms of high participation rates and comparable data. The SITES 2006 study provided an opportunity for the IEA to explore the feasibility of collecting data over the internet in addition to the traditional paper-based questionnaires (Law et al., 2008). During the pilot phase of the study, the IEA employed a split-sample design to identify, investigate, and statistically control possible measurement problems related to different data-collection methods. The two data collection modes yielded comparable data, thus allowing the implementation of both modes within and across countries. No substantial differences exist between the data derived from paper and those from the online mode. Nonetheless, the NRCs had to ensure which mode of data collection was acceptable and feasible for their education systems before administering survey instruments. Seventeen of the 22 education systems opted to implement ODC as the default data collection mode. Four education systems followed a hybrid approach of an ODC strategy augmented with paper-based schedules (Law et al., 2008), while South Africa exclusively followed a paper-based mode of data collection. The South African data collection took place during October and November 2007. Although the South African NRCs faced many challenges during the SITES 2006, the selected mode of data collection paid off (Table 2). The research team obtained, on average, an instrument return rate of more than 90% — far more than the IEA required return rate of 85%. The IEA commended the South African team for this milestone and recommended this approach for use in other developing contexts. The IEA also acknowledged the quality of the fieldworker training and data integrity. Data Capturing, Analysis and Reporting The data was captured in WINDEM, a special software package used by the IEA for all its large scale surveys. World-wide data capturing took place from November 2006 to January 2007. During February and March 2007, the IEA Data Processing Centre in Hamburg, Germany, performed data cleaning, processing and weighting. The International Research Coordinators (IRCs) analyzed the data of the 22 participating countries and compiled an initial draft report in April 2007. The NRCs of the participating countries discussed the initial comparative findings at the third NRCs meeting, 16-19 April 2007, Frascati, Italy. The final report of the SITES 2006 project (Law, Pelgrum, & Plomp, 2008) was released in 2008. The South African report will follow.
METHODOLOGY
Law et al. (2008, p. 5) state that “SITES 2006 aims to provide an overall picture of the status of pedagogical practice and ICT use in the participating countries and systems. Therefore, survey methodology is considered to be appropriate”. While the Teacher Questionnaire addressed research questions one and three (see Introduction section of this paper), the Principal and Technical questionnaires generated data on school-levelled policy, school context and technical ICT issues. The concepts addressed through the questionnaires are operationalised in the international report (Law, Pelgrum, & Plomp, 2008). The international desired school population was defined as all schools with students enrolled in the target grade, i.e., schools with students studying in the grade that represents eight years of schooling. The two teacher populations targeted in SITES 2006, the population of all teachers of mathematics teaching in the target grade, and the population of all teachers of science (or, depending of the educational systems, biology, physics, chemistry and earth science if appropriate) teaching the target grade in the school year of the main study (Law et al., 2008, p. 12). The SITES 2006 sample design features a stratified two-stage sample. Schools constitute the first level and teachers the second level. The school sample size per education system was fixed at a minimum of 400 schools. The teacher questionnaire required the teacher to refer to a particular class in the target grade they taught during the school. One of the classes in the target grade taught by that teacher had to be randomly selected to be the target class (Law et al., 2008, p. 13).
PEDAGOGY AND ICTs IN SOUTH AFRICAN SCHOOLS The discussion of South Africa’s participation in SITES 2006 takes place on three levels: the educational system (already discussed above), school and teacher levels. On the school level, infrastructure, facilities, and maintenance facilitate ICT for teaching and learning. Five conceptual domains potentially affect the school practices and conditions for teaching and learning with ICTs: the vision of the school, the ICT infrastructure, and the staff development, support, and the organization of educational reform initiatives (Pelgrim, 2008, p. 4). In this paper we use the availability of infrastructure as indicator of South Africa’s overall participation in SITES 2006.
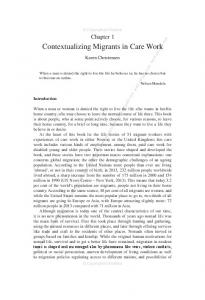
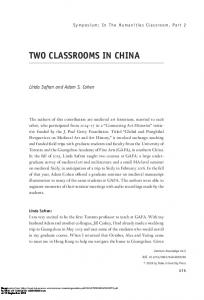
Figure 1 illustrates the student-Internet-computer ratio for schools possessing computers as an indicator ICT of infrastructure (hardware and software); while Table 3 provide the percentage ICT equipment and applications needed in the South African compared with the education systems with the lowest need. The SITES 2006 data analysis indicated that about 38% of South African schools had access to computers for student use in Grade 8 (Pelgrim, 2008). This number has doubled from M1 study in 1998 that indicated a number less than 20%. This figure remains dismally low when compared to education systems such as those of Estonia, Chile, and Israel. These educational systems indicated almost a hundred per cent access to computers for their students. To achieve education goals such as fostering collaborative skills and teamwork and preparing students for responsible Internet behaviour in the 21st century, Internet connectivity becomes increasingly important. Figure 1 illustrates huge ICT infrastructure differences among the participating education systems. In developing contexts such as Italy, Russian Federation, Slovak Republic, South Africa and Thailand, hardly any schools have a student-computer ratio less than ten. In South Africa the majority of schools have a student-internet-computer ratio of more than forty. The availability of more modern ICT equipment such as smart boards (interactive whiteboards), mobile devices, digital resources, modelling software, multimedia production tools, and electronic laboratory equipment was even lower. Throughout the analysis of the comparative data, the trend persisted; South Africa did not compare favourably with the mostly northern hemisphere education systems that participated in M3. To be able to meet the e-Education White Paper’s (Department of Education, 2004) expectations of full ICT integration by 2013, schools can deliver only through sufficient and suitable infrastructure. On the teacher level, three sets of core indicators for pedagogical orientations steered the study: curriculum goal, teacher practice and student practice. Across the study teachers believed traditional curriculum goals more important than those of the 21st century. Factor analysis indicated that preparing students for upper secondary education and beyond, improving students’ performance in examinations, and satisfying parents’ and community expectations, were perceived more important than preparing students for competent ICT use, preparing students for responsible internet behaviour, and fostering communication skills on and off-line. In addition, teachers were asked to indicate how often they adopted each of the listed teacher practices, and also to indicate whether they have used ICT for conducting such practices (Law & Chow, 2008, p. 19). Figure 2 shows the mean ICTusing teacher practice indicators for the three orientations (traditionally important, lifelong learning, and connectedness) as re-
ported by mathematics and science teachers in the participating education systems. The traditionally important orientation remains the highest for ICT-using teacher practices for most systems. However, the ICT use of South African mathematics and science teachers remains persistently low (Table 4).
CONCLUSIONS South Africa is rich in diversity in terms of income, culture, languages, and technology. On the one hand, South Africa is renowned for its technological innovation and development; and on the other, the majority of South Africa’s students do not share in the expectations of the information age. These inequalities are obvious in the delivery of education. In the light of South Africa’s less than adequate performance in the recent International Mathematics and Science Study (TIMMS), the Progress in Reading Literacy Study (PIRLS), as well as SITES 2006, strategic policies should demand and provide equal access and opportunities for all. “It is time to declare war on the failure of foundational learning in our schools” (Pandor, 2007b). Cutting edge technology will have to come to the rescue, or “… if the current pace is maintained we will lose the gains made thus far” (Pandor, 2007a). For the first time in the history of SITES, modules were flagged in the international tables by response rate. While the South African study was more time, logistic and cost intensive, the quality of the paper-based data collection strategy reflected in a very high survey return rate and very few missing data. Our strategy also led to the development of a large number of fieldworkers gaining a marketable skill. However, if the IEA should follow up the successful implementation of ODC in SITES 2006 and use ODC as default data collection strategy for future SITES modules, it could lead to South Africa’s exclusion from forthcoming SITES studies. Such a decision will deter South Africa’s participation in the series of SITES modules after participation in three successive modules. To summarise our SITES 2006 expectations, the words of the Minister of Education, Naledi Pandor, rings true. South Africa is “Not yet where we want to be.”
REFERENCES Anderson, R., & Plomp, T. (2008). Chapter 3: National Contexts. In Law, N., Pelgrum, W. J. & Plomp, T. (Eds.), Pedagogical Practices and ICT Use Around the World: Findings from the IEA International Comparative Study SITES 2006. CERC Studies in Comparative Education. Hong Kong: Comparative Education Research Centre, The University of Hong Kong, and Dordrecht: Springer. Department of Education. (2004). White Paper on E-Education: Transforming Learning and Teaching through Information and Communication Technologies (ICTs). Retrieved 26 July 2006. from http://www.info.gov.za/whitepapers/2003/e-education.pdf. Department of Education. (2005). Annual Report 2004/2005. Retrieved. from http://www.education.gov.za/dynamic/dynamic.aspx?pageid=329&catid=10&category=Reports&legtype=null. Department of Education. (2006a). Annual Report 2005/2006. Retrieved. from http://www.education.gov.za/dynamic/dynamic.aspx?pageid=329&catid=10&category=Reports&legtype=null. Department of Education. (2006b). Education Statistics in South Africa at a Glance in 2005. Pretoria: Government Printing Works. Department of Education. (2006c). National Targets for ICT Implementation during Phase 1 as Aggregated from Provincial Targets. Pretoria: Department of Education. Department of Education. (2006d, 11-14 December). South African Country Paper. Paper presented at the 16th Conference of Commonwealth Education Ministers: Access to Education for the Good of All, Cape Town. Holcroft, E. (2004). Chapter 7. SchoolNet South Africa. In James, T. (Eds.), Information and Communication Technologies for Development in Africa: Networking Institutions of Learning -- SchoolNet (Vol. 3, Available from http://www.idrc.ca/en/ev-71274-201-1DO_TOPIC.html Law, N., & Chow, A. (2008). Chapter 5: Pedagogical Orientations in Mathematics and Science and the Use of ICT. In Law, N., Pelgrum, W. J. & Plomp, T. (Eds.), Pedagogical Practices and ICT Use Around the World: Findings from the IEA International Comparative Study SITES 2006. CERC Studies in Comparative Education. Hong Kong: Comparative Education Research Centre, The University of Hong Kong, and Dordrecht: Springer. Law, N., Pelgrum, W., Monseur, C., Brese, F., Carstens, R., Voogt, J., et al. (2008). Chapter 2: Study Design and Methodology. In Law, N., Pelgrum, W. J. & Plomp, T. (Eds.), Pedagogical Practices and ICT Use Around the World: Findings from the IEA International Comparative Study SITES 2006. CERC Studies in Comparative Education. Hong Kong: Comparative Education Research Centre, The University of Hong Kong, and Dordrecht: Springer.
Law, N., Pelgrum, W. J., & Plomp, T. (Eds.). (2008). Pedagogical Practices and ICT Use Around the World: Findings From the IEA International Comparative Study SITES 2006. CERC Studies in Comparative Education. Hong Kong: Comparative Education Research Centre, Universities of Hong Kong and Dordrecht: Springer. Pandor, N. (2007a, 9 January 2007). E-learning in South Africa. Address by the Minister of Education, Naledi Pandor MP, at the World Ministerial Seminar on Technology in Education Moving Young Minds Retrieved 14 February, 2007, from http://www.education.gov.za/dynamic/dynamic.aspx?pageid=306&id=2471 Pandor, N. (2007b). A “foundation for learning” strategy to be gazetted. Retrieved 12 December, 2007, from http://www.education.gov.za/dynamic/dynamic.aspx?pageid=310&id=6931 Pelgrim, W. (2008). Chapter 4: School Practices and Conditions for Pedagogy and ICT. In Law, N., Pelgrum, W. J. & Plomp, T. (Eds.), Pedagogical Practices and ICT Use Around the World: Findings from the IEA International Comparative Study SITES 2006. CERC Studies in Comparative Education. Hong Kong: Comparative Education Research Centre, The University of Hong Kong, and Dordrecht: Springer. Pelgrim, W., & Law, N. (2008). Chapter 1: Introduction to SITES 2006. In Law, N., Pelgrum, W. J. & Plomp, T. (Eds.), Pedagogical Practices and ICT Use Around the World: Findings from the IEA International Comparative Study SITES 2006. CERC Studies in Comparative Education. Hong Kong: Comparative Education Research Centre, The University of Hong Kong, and Dordrecht: Springer. South Africa.info. (2006, December 2006). South Africa: Fast Facts. Retrieved 14 February, 2007, from http://www.southafrica.info/ess_info/sa_glance/facts.htm WorldPress.org. (2004). Bridging the Digital Divide: Africa's Poor Connection. Retrieved 12 December, 2007, from http://www.worldpress.org/Africa/1744.cfm
Student-Internet-computer ratio 2,3 Alberta Province, Canada Catalonia, Spain 1 Chile Chinese Taipei 2 Finland 2 Hong Kong, SAR Israel 1 Italy 1 Japan
40
Singapore Slovak Republic Slovenia South Africa 2 Thailand Denmark# Estonia# France# Norway#
0%
20%
40%
60%
80%
100%
Percentage
# 1 2 3 4
School participation rate after including replacement schools is below 70%. School participation rate before including replacement schools is below 85%. School participation rate after including replacement schools is below 85%. Less than 70% of the school level questionnaires in the participating schools were returned. National defined population covers less than 90% of the national desired population.
Figure 1:
Percentages of Schools Indicating Student-Internet-Computer Ratio (Pelgrim, 2008, p. 25)
Science teachers
Mathematics teachers ECT
ECT
1 CHL
1 CHL
TWN
TWN
2 FIN
2 FIN
2 HKG
2 HKG
4 ISR
4 ISR
1 ITA
1 ITA
1,3 JPN
1,3 JPN
2 COT
2 COT
SGP
SGP
SVK
SVK
SVN
SVN
†,2 CAB
†,2 CAB
# DNK
# DNK
# EST
# EST
# FRA
# FRA
†,2 LTU
†,2 LTU
† RUM
† RUM
# NOR
# NOR
† RUS
† RUS
† ZAF
† ZAF
†,1 THA
†,1 THA
0
10
20 20
30 30
40 40
50 50
60 100
00
Percentage reporting ICT use
Lifelong learning
20 20
30 30
40 40
50 50
60 100
Percentage reporting ICT use
Teachers practice orientation: Traditionally important
10 10
Teachers practice orientation: Connectedness
Traditionally important
Lifelong learning
Connectedness
#
School participation rate after including replacement schools is below 70% † International procedures for target class selection were not followed in all schools 1 School participation rate before including replacement schools is below 85% 2 School participation rate after including replacement schools is below 85% 3 Teacher participation data was collected after survey administration 4 National defined population covers less than 90% of the national desired population
Figure 2:
Mean ICT-using Teacher Practice Orientations Reported by Mathematics and Science Teachers (Law & Chow, 2008, p. 5)
Table 1: Demographic a Factors by Educational System (Anderson & Plomp, 2008, p. 6) Education System Alberta, Canada Catalonia, Spain Chile Chinese Taipei Denmark Estonia Finland France Hong Kong SAR Israel Italy Japan Lithuania Moscow, Russian Fed. Norway Ontario, Canada Russian Fed. Singapore Slovak Republic Slovenia South Africa Thailand a
b
c d
Population in Millions
% Urbanization
GDP per Capita (US$)
3.3 7.2 16.1 23 5.4 1.3 5.2 60.3 7 6.6 58 127.9 3.4 10.9 4.6 12.5 143.9 4.3 5.4 2 47.2 63.7
70 82 87 60 86 69 61 77 100 92 68 66 67 79 77 82 73 100 56 51 59 32
29,263 29,645 10,874 12,941 31,914 14,555 29,951 29,300 30,822 24,382 28,180 29,251 13,107 9,902 38,454 32,663 9,902 28,077 14,623 20,939 11,192 8,090
Income Inb equality (US$) 9,400 10,300 40,600 18,400 8,100 6,500 5,600 9,100 17,800 13,400 11,600 4,500 10,400 13,700 6,100 9,400 12,700 17,700 6,700 5,900 33,100 12,600
Cell Phone c Per 1K 469 905 593 677 956 931 954 738 1,184 1,057 1,090 716 996 617 861 489 517 910 794 951 428 430
Internet Users d Per 1K 646 336 267 273 696 497 629 414 506 471 501 587 282 211 390 689 111 571 423 476 78 109
Primary source of the indicators is the UNDP Human Development Report, 2006 (United Nations Development Program, 2006). Except where otherwise noted, the statistics were based upon 2004. Income inequality is measured by subtracting the average per capita income of the lowest-earning 10% of the population from topearning 10% (figures in US$). Cell Phone users are the number of users per 1,000 population in 2003 Internet users per one thousand population in 2003.
Table 2: Milestones and Challenges Experienced During the South African Participation in SITES 2006
Milestones
Challenges
For the 1st time in of SA’s participation in SITES, the education system is fully reflected in all the main data tables. Even through the use novice fieldworkers, the NRCs maintained data integrity.
No single large-scale project funding, e.g. National Research Foundation (NRF) funding for the SITES 2006 data collection. Limited and distributed funding compelled a late project start and constantly affected management of the project.
The SA NRSc completed data collection on time. Much time was lost due to a late project start and managerial issues.
Settlement of invoices was almost impossible due to incompatibility of hosting HEIs.
The research team completed data capturing and on time exported the data to the IEA Data Processing Centre in Hamburg, Germany.
Training of fieldworkers, matching them to schools, managing of the instruments and fieldworkers generated much additional responsibilities for the researchers.
More than a hundred TUT Masters-level student received intensive, hands-on research and fieldworker training. Students can use these skills in their own research projects.
Detailed and repetitive financial management of individual payments to a large number of fieldworkers.
TUT students gained a marketable vocational skill as trained and experienced fieldworkers.
Costly mode of data collection when compared to ODC.
The NRCs and research team demonstrated effective management of a large-scale survey research project.
Insufficient internet and extended ICT infrastructure in SA for ODC.
Table 3: ICT Equipment and Applications Needed*
Need in South Africa (%)
Education System with the Lowest Need (%)
ICT equipment
83.12%
Singapore 2%
Tutorial software
88.49%
Slovenia 5%
General software ( word processing, spreadsheet and presentation software
64.30%
Canada, Norway, Hong Kong, Singapore 0%
Multimedia production tools
90.87%
Hong Kong 3%
Simulation
93.05%
Singapore 24%
Communication software
83.00%
Singapore 0%
Digital resources
79.64%
Denmark 6%
Digital e-mail accounts
84.04%
Slovenia 5%
ICT Equipment and Applications Needed**
* Pelgrum (2008, p. 83) ** SITES 2006 Technical questionnaire frequencies for items 4A, 4B, 4C, 4D, 4F, 4G, 4H and 4M, respectively
Table 4: Percentage frequencies of Mathematics and Science teachers who use ICTs for pedagogical activities
South African Mathematics Teachers
South African Science Teachers
Presenting information, demonstrations or instructions
16.9%
18.0%
Remedial individual or small group instruction
14.5%
14.0%
Assisting students in exploratory and inquiry activities
11.7%
16.2%
Assessing learning through tests or quizzes
13.0%
17.9%
Effective classroom management
9.3%
12.4%
Organising, supporting and monitoring team building and collaboration among student
9.0%
10.3%
Use ICT for the following activities*
* SITES 2006 Mathematics and Science Teacher Questionnaire frequencies for items 14Ab, 14Bb, 14Cb 14Eb, 14Gb and 14Hb, respectively