systems, or laptop computers, is limited by the lifetime of the included batteries. ... With the proliferation of cheap wireless access technolo- gies, such as wireless ...
Computing Battery Lifetime Distributions Lucia Cloth, Marijn R. Jongerden, Boudewijn R. Haverkort University of Twente Design and Analysis of Communication Systems [lucia,brh,jongerdenmr]@ewi.utwente.nl http://dacs.ewi.utwente.nl/
Abstract
that becomes, due to the reasons mentioned, more and more important. A key issue to be addressed is to find the right tradeoff between battery usage and required performance: how can we design a (wireless) system such that with a given battery, good performance (throughput, reachability, and so on) is obtained, for a long-enough period. Stated differently, how should the processes in the wireless device be organised such that the battery lifetime (which determines the system lifetime) will be as high as possible. Indeed, it has been observed recently that due to the specific physical nature of batteries, achieving the longest battery lifetime is not always achieved by “just” trying to minimise the power consumption at any point in time. Instead, also the way in which the power is consumed, that is, the current-extraction patterns and the employed current levels play a role in the battery lifetime.
The usage of mobile devices like cell phones, navigation systems, or laptop computers, is limited by the lifetime of the included batteries. This lifetime depends naturally on the rate at which energy is consumed, however, it also depends on the usage pattern of the battery. Continuous drawing of a high current results in an excessive drop of residual capacity. However, during intervals with no or very small currents, batteries do recover to a certain extend. We model this complex behaviour with an inhomogeneous Markov reward model, following the approach of the so-called Kinetic battery Model (KiBaM). The state-dependent reward rates thereby correspond to the power consumption of the attached device and to the available charge, respectively. We develop a tailored numerical algorithm for the computation of the distribution of the consumed energy and show how different workload patterns influence the overall lifetime of a battery.
In order to obtain a better insight in the lifetime of batteries, a wide variety of models has been developed. We will discuss some of these models in the next section, thereby focusing on the Kinetic Battery Model (KiBaM). What has not been done, however, is the combination of such power consumption models in a versatile way with performance models for mobile communication systems, thereby taking into account typical physical aspects of battery operation. It is exactly this issue that we address in the current paper.
1 Introduction With the proliferation of cheap wireless access technologies, such as wireless LAN, Bluetooth as well as GSM, the number of wireless devices an average citizen is using has been steadily increasing since a few years. Such devices not only add to the flexibility with which we can do our work, but also add to our reachability and our security. Next to these personal wireless devices, an ever growing number of wireless devices is used for surveillance purposes, most notably in sensor-type networks. A common issue to be dealt with in the design of all of these devices is power consumption. Since all of these devices use batteries of some sort, mostly rechargeable, achieving low power consumption for wireless devices has become a key design issue. This fact is witnessed by many recent publications on this topic, and even a special issue of IEEE Computer (November 2005) devoted to it [1]. Low-power design is a very broad area in itself, with socalled “battery-driven system design” a special branch of it,
Our approach will be to describe the operation of a system with an abstract workload model, describing the various states the wireless device can be in, together with the energy consumption rates in those states. Also, the transition possibilities between these states will be represented in the workload model. Such a description can be interpreted as a Markov-reward model in which accumulated reward stands for the amount of energy consumed. The system or battery lifetime would then be equal to the time until a certain level of consumption (the available charge of the battery) is reached. Determining this time, or better, its distribution, could be done with well-known techniques for performability evaluation. However, such an approach does not well take into account the physical aspect of battery operation. Indeed, studies on batteries reveal that the battery depletion rate in general is non-linear in time, and, moreover, 1
also depends on the amount of energy still in the battery. Furthermore, in periods when a battery is not used, subtle but important battery-restoration effects are in place, that apparently refill the battery. Translating such effects to a Markov reward model context, this would amount to models in which, possibly, the reward and transition rates depend on time and/or on the amount of reward accumulated so far, and in which both positive and negative reward rates are in place. In this paper we take the analytical KiBaM as a starting point and combine it with performance models. We also present a tailored algorithm for evaluating battery lifetime distributions for the so-called KiBaMRM (Kinetic Battery Markov reward model). The rest of the paper is organised as follows. We introduce into the world of batteries in Section 2. Section 3 refers to battery models and describes the KiBaM in detail. We then fix some notation for inhomogeneous Markov reward models and present the Markov reward models for batteries used in the rest of the paper in Section 4. In Section 5 we describe the algorithm for the computation of the battery lifetime. Section 6 discusses the results obtained for the models and in Section 7 we conclude this paper.
are released into the (connected) circuit. At the cathode a reduction reaction takes place. Here electrons are accepted from the circuit and consumed in the reaction: O1 + ne− → R1 , R2 → O2 + me− .
cathode anode
As an example of a chemical reaction, this is what happens in the highly-used Lithium-ion batteries [3]: Li1−x CoO2 + xLi+ + xe− → LiCoO2 , CLix → C + xLi+ + xe− . These are the reactions for discharging the battery. For charging the battery the arrows in the reaction equations are directed to the left. In a lithium ion battery, the Li+ ions made at the anode have to diffuse to the cathode when a current is drawn from the battery. When the current is too high the internal diffusion cannot keep up with the rate the ions react at the cathode. As a result, the positive charge at the cathode drops and rises at the anode. This causes a drop in the output voltage of the battery. However, when the battery is less loaded for a while, the ions have time enough to diffuse again and charge recovery takes place. Another effect that occurs when high currents are drawn is that no reaction sites (molecules) are available in the cathode. At small load (low currents) the reaction sites are uniformly distributed over the cathode. But at high currents the reduction takes place only at the surface of the cathode. Due to this, the reaction sites in the internal of the cathode become unreachable. This also results in a drop of the effective capacity of the battery.
2 Batteries The two most important properties of a battery are its voltage (expressed in volts V ) and its capacity (mostly expressed in Ampere-hour, Ah); the product of these two quantities gives the energy stored in the battery. For an ideal battery the voltage stays constant over time until the moment it is completely discharged, then the voltage drops to zero. The capacity in the ideal case is the same for every load for the battery. Reality is different, though: the voltage drops during discharge and the effectively perceived capacity is lower under a higher load. In the ideal case it would be easy to calculate the lifetime of a battery. The lifetime (L) in the case of a constant load is the capacity (C) over the load current (I (Ampere)), L = C/I. Due to various nonlinear effects this relation does not hold for real batteries. A simple approximation for the lifetime under constant load can be made with Peukert’s law [2]: a L = b, I
3 Battery models In an attempt to get a grip on the above physical battery processes, a variety of models has been proposed. The simplest models are purely analytical and similar to Peukert’s law. With more detail, so-called equivalent electrical circuit models have been introduced, that can be evaluated (simulated) using a package such as Spice [4]. With even more detail, electro-chemical models have been developed; although these models can be very accurate for predicting battery lifetime under concrete loads, these models are often too large and complicated to be used as part of highlevel system models [5]. Recently, also stochastic models have been proposed, in which the battery charge is discretised and in which probabilistic transitions between charge levels are included to account for the above presented effects [6]. With these, in essence, Markovian models, also the effect of workload variations (around a given mean) has been studied [7]. The Kinetic Battery Model (KiBaM) [8] is an intuitive analytical battery model. It is called kinetic because it uses a chemical kinetics process as its basis. The battery
where a > 0 and b > 1 are constants which depend on the battery. This relation does not hold for a variable load. Following Peukert’s law, all load profiles with the same average would have the same lifetime. Experimentally it can be shown that this is not the case. One of the effects playing an important role here is the recovery effect of the battery, as follows. All batteries are driven by electro-chemical reactions. During the discharge, an oxidation reaction at the anode takes place. In this reaction electrons are produced, which 2
c
1−c
4500
y1 y2
4000
h2
3500
h1 charge (mAs)
3000
y1
y2
2500
2000
1500
k bound charge
I
1000
available charge
500
0
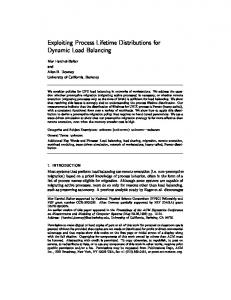
Figure 1. Two well model of the Kinetic Battery Model
0
2000
4000
6000
8000
10000
12000
t (seconds))
Figure 2. Evolution of the available-charge and the bound-charge for f = 0.001Hz
charge is distributed over two wells, the available-charge well and the bound-charge well, see Figure 1. The available charge well supplies electrons directly to the load, the bound-charge well supplies electrons only to the availablecharge well. The rate at which charge flows between the wells depends on the difference in heights of the two wells, and on a parameter k. The parameter c gives the fraction of the total charge in the battery that is part of the availablecharge well. The change of the charge in both wells is given by the following system of differential equations: � dy1 dt = −I + k(h2 − h1 ), (1) dy2 dt = −k(h2 − h1 ),
Frequency
Exp. lifetime
KiBaM lifetime
(Hz) Continuous 1 0.2
(min) 90 193 230
(min) 91 203 203
Modified KiBaM lifetime stochastic numerical (min) (min) 90 89 193 193 226 193
Table 1. Experimental and computed lifetimes
with initial conditions y1 (0) = c·C and y2 (0) = (1−c)·C, where C is the total battery capacity. For h1 and h2 we have: h1 = y1 /c and h2 = y2 /(1 − c). When a load I is applied to the battery, the available charge reduces, and the difference in heights between the two wells grows. Now, when the load is removed, charge flows from the boundedcharge well to the available-charge well until h1 and h2 are equal again. So, during an idle period, more charge becomes available effectively and the battery lasts longer than when the load is applied continuously. A special case arises if c = 1, that is, all charge is readily available. The pair of differential equations (1) then reduces 1 to a single equation dy dt = −I, because y2 = 0 at any time. The system of differential equations can be solved analytically when the load current I is constant. This solution can be used to calculate the battery lifetime for any given workload with piecewise constant currents. We calculated the battery lifetime for simple workloads consisting of a square wave with fixed frequency. In Figure 2 the charges in the available-charge and bound-charge well are given as a function of the time for such a workload with a frequency of f = 0.001Hz. The current drawn during the on periods was set to 0.96A. We see the charge in the availablecharge well decreasing when the current is drawn from the battery and rising again during the idle periods. The flow of charge from the bound-charge well starts slowly and gets faster over time, because of the increasing difference of the heights h2 − h1 of the two wells.
To be able to do these calculations, the parameters c and k have to be determined. The parameter c can be calculated from the capacity delivered under very large and very small loads. At very large loads the battery lifetime is short, and there is no time for the charge to move from the boundcharge well to the available-charge well. The capacity delivered equals the amount of charge in the available-charge well. At very small loads, however, all the charge from both the bound and available-charge well is delivered. The quotient of these two numbers is exactly c, from [9] we take c = 0.625. We set the parameter k in such a way that the calculated lifetime for a continuous load of 0.96A corresponded to the experimental value given in [9]. In Table 1 we see the battery lifetimes according to the KiBaM and some experimental results given in [9]. We see that for KiBaM the lifetime is constant for both frequencies. However, the experimental results show a longer lifetime for the slower frequency. To overcome this problem Rao et al. have developed a modified Kinetic Battery Model [9]. In the modified model the recovery rate has an additional dependence on the height of the bound-charge well, making the recovery slower when less charge is left in the battery. With a stochastic simulation of this model they obtain very good results for the battery lifetimes. However, we numerically evaluated the modified KiBaM with a deterministic workload and saw that the lifetime still does not depend on the frequency (see Table 1). Personal correspondence with the authors of [9] has not shed light on the discrepancy. 3
4 Inhomogeneous MRMs for Batteries
The equation describes the rate of change at the end of the interval [t1 , t2 ] and so the reward rate depends on t2 . The accumulated reward until time t in this case is defined as � t Y (t) = rX(s) (s, Y (s))ds.
We first introduce the notation for inhomogeneous Markov reward models and their measures of interest. We then show how the KiBaM can be integrated into a CTMC workload model. Finally we present several small example workload models.
4.1
0
An MRM can easily have more than one reward structure. State i is then equipped with reward rates ri,1 through ri,K , i.e., we have a reward matrix R(t, y) ∈ RN ×K for y ∈ RK . The accumulated reward is then a vector of random variables Y (t) = (Y1 (t), . . . , YK (t)) and its distribution is defined as
Inhomogeneous MRMs
Homogeneous case. A (homogeneous) Markov reward model (MRM) consists of a finite state space S = {1, . . . , N }, the transition rate matrix Q ∈ RN ×N and a reward vector r ∈ RN . The matrix Q is an infinitesimal generator � matrix, i.e., with entries qi,j � 0, j �= i, and qi,i = − j∈S,j�=i qi,j . The diagonal entry qi,i , which is often denoted as −qi , describes the rate at which state i is left. This rate is to be interpreted as the rate of a negative exponential distribution, i.e., the probability that state i is left within s seconds is given as 1 − e−qi ·s . The next state then is j with probability qi,j /qi . The initial distribution of states at time t = 0 is denoted as α . The generator matrix Q together with α determines the CTMC X(t). When in state i, reward is accumulated with rate ri which might be positive or negative. The total reward accumulated when residing in state i from time t1 until time t2 � t1 is denoted yi (t1 , t2 ) and equals
F Y (t, (y1 , . . . , yK )) = Pr {Y1 (t) � y1 , . . . , YK (t) � yK } . Battery case. For the KiBaM we need an MRM that is time-homogeneous but reward-inhomogeneous and has two types of rewards. We therefore denote the generator matrix as Q(y1 , y2 ) and the reward rates as R(y1 , y2 ) ∈ RN ×2 . The reward accumulated in a state i between time t1 and time t2 is described by the following differential equations with initial values yi,1 (t1 , t1 ) = yi,2 (t1 , t1 ) = 0: � dyi,1 (t1 ,t2 ) = ri,1 (yi,1 (t1 , t2 ), yi,2 (t1 , t2 )) , dt2 dyi,2 (t1 ,t2 ) = ri,2 (yi,1 (t1 , t2 ), yi,2 (t1 , t2 )) . dt2 The accumulated reward is then defined as Y (t) = (Y1 (t), Y2 (t)) � t = r X(s) (Y (s))ds 0 � t � � rX(s),1 (Y1 (s), Y2 (s)) , rX(s),2 (Y1 (s), Y2 (s)) ds, =
yi (t1 , t2 ) = ri · (t2 − t1 ). Given the state process X(t), the accumulated reward at time t, Y (t), is defined as � t Y (t) = rX(s) ds.
0
and its distribution equals
0
F (Y1 ,Y2 ) (t, y1 , y2 ) = Pr {Y1 (t) � y1 , Y2 (t) � y2 } .
The distribution of Y (t), the so-called performability distribution [10, 11], equals F Y (t, y) = Pr {Y (t) � y}. The corresponding density (with respect to y) equals
(2)
We assume that the accumulated rewards have to be nonnegative and are bounded by a minimum l = (l1 , l2 ) and a maximum u = (u1 , u2 ). This is absolutely reasonable when considering batteries because their charge is always between 0 and a predefined capacity C. We then have
∂F Y (t, y) ∂y 1 = lim Pr {y � Y (t) � y + h} . h↓0 h
f Y (t, y) =
f (Y1 ,Y2 ) (t, y1 , y2 ) = 0,
Inhomogeneous case. In the inhomogeneous case, the transition rate matrix Q and the reward vector r can depend on the time t (time-inhomogeneous) and the accumulated reward y (reward-inhomogeneous). We then have Q(t, y) and r(t, y), where y is the current level of accumulated reward. The reward accumulated between time t1 and t2 � t1 when residing completely in state i is described by the following differential equation with initial value yi (t1 , t1 ) = 0:
for y1 < l1 or y2 < l2 or y1 > u1 or y2 > u2 .
(3)
In the following we often consider the joint distribution of state and accumulated rewards, that is, Fi (t, y1 , y2 ) = Pr {X(t) = i, Y1 (t) � y1 , Y2 (t) � y2 } , with density fi (t, y1 , y2 ). The distribution of the accumulated rewards can then be calculated using � F (Y1 ,Y2 ) (t, y1 , y2 ) = Fi (t, y1 , y2 ).
dyi (t1 , t2 ) = ri (t2 , yi (t1 , t2 )). dt2
i∈S
4
4.2
The KiBaMRM
sending of data is complete in 10 minutes on average (resulting in a sending rate of µ = 6 per hour). From the idle state the device can also move into a power-saving sleep state, this is done – on average – once per hour (τ = 1). The power-consumption rate is low when idling (I0 = 8mA), it is high when sending data (I1 = 200mA) and negligible in the sleep state (I2 = 0mA). With a typical battery capacity C = 800mAh (check your cell phone!), this means that theoretically the device can be 4 hours in send mode or 100 hours in idle mode. To extend the overall battery lifetime it seems to be beneficial to have short periods of high sending activity (bursts) and long periods without sending activity. In the modelled wireless device this could be achieved by accumulating the data to be transmitted and then send all in a row instead of transmitting lower amounts of data more frequently. This can be modelled by buffering the flow of arriving data. When the flow is active, data arrives with a very high rate. If the flow is inactive, the device can safely go to sleep. Figure 5 shows a state-transition diagram for such a burst model. It has the same sending rate µ and timeout rate τ as the simple model. Bursts start with rate switch on=1 per hour and stop with rate switch off=6 per hour. To make any results of the latter two models comparable, we have chosen λburst = 182 per hour such that the steady-state probability to be in off − send or on − send in the burst model is the same as the probability to be in send in the simple model. As could be expected, the steady-state probability to be in sleep is higher in the burst model than in the simple model.
We state the KiBaMRM as an MRM with two reward types. The CTMC states {1, . . . , N } of the MRM reflect the different operating modes of the device. The first accumulated reward Y1 (t) represents the available-charge well, the second accumulated reward Y2 (t) represents the boundcharge well. The corresponding rates are derived from the KiBaM differential equations (1), using the constants k and c and the equations h1 = y1 /c and h2 = y2 /(1 − c). Let Ii be the energy consumption rate in a state i ∈ S. The first reward rate then is � −Ii + k · (h2 − h1 ), h2 > h1 > 0, ri,1 (y1 , y2 ) = 0, otherwise, and the second reward rate is � −k · (h2 − h1 ), h2 > h1 > 0, ri,2 (y1 , y2 ) = 0, otherwise. The interesting question for battery-powered devices is “When does the battery get empty?” For the KiBaMRM model, the battery is empty at time t if the available-charge well Y1 (t) is empty. Since the accumulated rewards Y1 (t) and Y2 (t) are random variables, we can only indicate the probability that the battery is empty at time t: Pr {battery empty at time t} = Pr {Y1 (t) = 0}
(4)
The lifetime L of a battery is the instant the battery gets empty for the first time,
on
off
L = min{t | Y1 (t) = 0}.
4.3
Stochastic Workload Models ... ...
In the following we consider three stochastic workload models. First we concentrate on simple on/off models like the ones used in [9] with the only difference that those were not stochastic. For a given frequency f , the workload toggles between the off-state (no energy consumed) and the on-state (energy consumed at a fixed rate I = 0.96A). We model the on/off times as Erlang-K distributions such that with increasing K they become close to deterministic. Figure 3 shows the state-transition diagram for this simple model. For frequency f , all transitions have rate
Figure 3. Simple on/off model
send 1
λ = 2 · f · K.
λ
sleep 2
The expected on and off times, respectively, are then K/(2f K) which leads exactly to a frequency f . We furthermore consider two workload models of a small battery-powered device. The first, simple one consists of three states as depicted in Figure 4. At the beginning the model is in idle state. With rate λ = 2 per hour there is the necessity to send data over the wireless interface. If such data is present, the model moves into the send state. The
λ
τ
µ
idle 0
Figure 4. State transition diagram for the simple model
5
λburst
on−idle switch_on
on−send µ
sleep switch_on
switch_off switch_on
switch_off
...
... ...
τ
off−idle
µ
off−send
Figure 5. State transition diagram for the burst model
...
... ...
5 Markovian Approximation ...
In this section we present a numerical algorithm for the computation of the distribution of the accumulated reward (performability) in an inhomogeneous Markov reward model. It uses a Markovian approximation, in which the computation is reduced to the transient solution of a pure CTMC via uniformisation. The underlying idea already appeared in [12] and is also used in [13] and [14] (steadystate solution). We described the algorithm for homogeneous MRMs with positive reward rates in the CSRL context [15, 16], then extended it to reward-inhomogeneous models with positive reward rates [17]. We also explored the applicability of a discretisation algorithm like the one presented in [18]. However, this algorithm requires integer reward rates to work efficiently. In the case of rational reward rates these have to be scaled which in turn substantially increases the number of required discretisation steps, thus making the algorithm unattractive and often even infeasible. Techniques for the reduction of the space complexity like the one presented in [19] have still to be explored. Nevertheless, a detailed description of the discretisation algorithm can be found in [20]. There is also other work that addresses performabilitylike measures in an inhomogeneous context. In the 1990’s some work has been published on the computation of transient state probabilities for inhomogeneous Markovian models without rewards were addressed there [21, 22, 23]. A more recent paper [24] characterises the performability distribution in inhomogeneous MRMs through a coupled system of partial differential equations that is solved through discretisation, and used to derive systems of ordinary differential equations to determine moments of accumulated reward. In what follows we approximate the joint distribution of state process and accumulated reward by the transient solution of a derived homogeneous CTMC, that is, by a PHdistribution. The approximation is applicable if the generator matrix and the reward rates depend on the current accumulated reward and not on the current time. This is exactly the case with our battery model and we therefore restrict the presentation to a two dimensional reward structure, even though the approach applies for three or more reward types equally well.
...
Figure 6. Structure of the new generator matrix Q∗ . The joint distribution of state and accumulated reward (2) can be rewritten by summing over evenly-sized subintervals of the reward intervals [l1 , y1 ] and [l2 , y2 ]: y1 y −1 ∆2 −1 ∆ Xt = i, � � Fi (t, y1 , y2 ) = Pr Y1 (t) ∈ (j1 ∆, (j1 + 1)∆], . Y (t) ∈ (j ∆, (j + 1)∆] l l 2 2 2 j1 = 1 j2 = 2 ∆
∆
Here, ∆ is the stepsize at which the state space is discretised.
5.1
Discretisation of the state space
We want to approximate the terms Pr{Xt = i, Y1 (t) ∈ [j1 ∆, (j1 +1)∆], Y2 (t) ∈ [j2 ∆, (j2 +1)∆]} in such a way that the computation is done for a pure CTMC (without rewards). This is accomplished as follows. An MRM modelling a battery can be seen as having an infinite and uncountable state space S × [l1 , u1 ] × [l2 , u2 ], where state (s, y1 , y2 ) indicates that the “CTMC part” of the MRM is in state s and the accumulated reward of the first type is y1 and of the second type is y2 . For our approximation we break down the uncountable state space to a finite one. Let � � � � l1 u1 l2 u2 ,..., ,..., S∗ = S × × ∆ ∆ ∆ ∆ be the state space of the new CTMC. A state (s, j1 , j2 ) then indicates that the MRM is in state s and has accumulated rewards in the intervals (j1 ∆, (j1 + 1)∆] and (j2 ∆, (j2 + 1)∆], respectively (for j1 = 0 or j2 = 0 these intervals are left-closed). In the special case where c = 1 (y2 = 0) only the first accumulated reward y1 has to be discretised. The initial distribution α∗ depends on the original initial distribution α and the initial values for the accumulated 6
rewards a1 and a2 : αi , a1 ∈ (j1 ∆, (j1 + 1)∆] and a2 ∈ (j2 ∆, (j2 + 1)∆], α∗(i,j1 ,j2 ) = 0, otherwise.
Transitions indicating the transfer from the boundcharge well to the available-charge well. When charge is transferred between the two wells the level of the first reward has to increase while simultaneously the level of the second reward decreases. This corresponds to a transition between state (i, j1 , j2 ) and (i, j1 + 1, j2 − 1) for j1 < u1 /∆, j2 > 0 and h2 � h1 :
The distribution of the accumulated rewards is then approximated as F (Y1 ,Y2 ) (t, y1 , y2 ) ≈
y1 ∆
−1
� �
y2 ∆
Q∗(i,j1 ,j2 ),(i,j1 +1,j2 −1) =
−1
�
π(i,j1 ,j2 ) (t),
i∈S j1 = l1 j2 = l2 ∆ ∆
u2
Pr {battery empty at time t} ≈
π(i,0,j2 ) (t).
i∈S j2 = l2 ∆
5.2
�
j2 j1 − 1−c c
� ,
where h1 = (j1 ∆)/c and h2 = (j2 ∆)/(1 − c). These entries can be found in the blocks . The entries in the first row of big blocks correspond to j1 = 0, which means that the battery is empty. These states are made absorbing, because the lifetime of a battery is defined to be the first time at which its get empty, so we do not allow recovery in this case. However, the recovery transitions could easily be included. All other off-diagonal entries of Q∗ are zero, the diagonal entries are defined as the negative row sums.
where π(i,j1 ,j2 ) (t) is the transient probability of residing in state (i, j1 , j2 ) at time t in the derived CTMC. For battery models, the probability that the battery is already empty at time t, cf. (4), is approximated as: ∆ � �
k(h2 − h1 ) =k ∆
Transitions in the new generator 5.3
In the following we restrict the presentation to the solution of KiBa models. However, the approach is easily applicable to general inhomogeneous MRMs with multiple rewards. Two types of transitions are possible in the new CTMC with generator Q∗ : transitions taken from the original CTMC and transitions between different reward levels (for each of the two reward types). An entry in the new generator matrix Q∗ is defined depending on the type of transition it represents. Figure 6 shows the structure of the generator matrix Q∗ . Each small block corresponds to a fixed j1 and j2 and has dimension N × N , each of the big block corresponds to one value of j1 . Transitions from the original generator. If the original CTMC part of two states (i, j1 , j2 ) and (i� , j1 , j2 ) are different (i �= i� ) but the reward levels are identical, the entry is taken from the original generator. Since it is a rewardinhomogeneous MRM, the current reward level (j1 ∆, j2 ∆) must be taken into account, that is,
� y1 y2 � · . The alThe time complexity is O N 2 · qt · ∆ ∆ gorithm is quadratic in the number of states and linear in time and in each of the reward bounds. The step size ∆ enters as ∆−2 . However, the step size is also coded into the generator matrix of the new CTMC by multiplying the 1 reward rates with ∆ (see the definition of Q∗ ). The transient solution of the CTMC has a time complexity linear in the uniformisation constant q. For small ∆, this uniformi1 and we thus obtain a time sation constant gets linear in ∆ −3 complexity in ∆ .
6 Results In this section we evaluate the battery lifetime distribution of the systems described in Section 4 using simulations of the stochastic workload on the analytical KiBaM and the Markovian approximation algorithm for the KiBaMRM.
Q∗(i,j1 ,j2 ),(i� ,j1 ,j2 ) = Qi,i� (j1 ∆, j2 ∆).
6.1
In Figure 6 these entries are found in the blocks . Transitions indicating the consumption of energy. If the CTMC states are identical, the levels of the first accumulated reward are different and the levels of the second accumulated reward are again identical, the entry indicates a change in the first accumulated reward, the available charge well. Such a change can only happen between neighbouring levels, hence, between j1 and j1 − 1 (entries in blocks ). Q∗(i,j1 ,j2 ),(i,j1 −1,j2 ) =
Complexity
On/Off Model
We start with a degenerate case of the KiBaM, where the bound-charge well is empty from the beginning and the complete charge is in the available-charge well. There is no transfer of charge between the two wells. We choose the simplest Erlang model (see Figure 3) for frequency f = 1Hz with K = 1, that is, on- and off-times follow a negative exponential distribution with rate λ = 2. The battery capacity is C = 2000mAh= 7200As; the KiBaM constants are c = 1 and k = 0/s.
Ii , j1 > 0 ∆ 7
flow between the two wells is k = 4.5 · 10−5 /s. The curves
0.8
1
0.6
0.8
Pr[battery empty at time t]
Pr[battery empty at time t]
1
0.4
0.2 Delta=100 Delta=50 Delta=25 Delta=5 Simulation 0
0.6
0.4
0.2 6000
8000
10000
12000
14000
16000
18000
Delta=100 Delta=50 Delta=25 Delta=10 Delta=5 simulation
20000
t (s)
0
Figure 7. Battery lifetime distribution for the on/off-model (f = 1Hz, K = 1, C = 7200As, c = 1, k = 0/s)
6000
8000
10000
12000
14000
16000
18000
20000
t (s)
Figure 8. Battery lifetime distribution for the on/off model (f = 1Hz, K = 1, C = 7200As, c = 0.625, k = 4.5 · 10−5 /s)
Figure 7 shows the resulting lifetime distribution calculated by simulation and using the approximation algorithm using different stepsizes ∆. The simulation results are obtained by 1000 independent runs. They suggest that the battery lifetime is close to deterministic with a mean of about 15000 seconds. This is reasonable since the overall time spent in the on-state in one of the runs has approximately an Erlang15000 (2 s) distribution, which is a good approximation to a deterministic distribution with mean 7500 seconds. In 7500 seconds the consumed energy is 7500s · 0.96A = 7200As = C. For pure deterministic on- and off-times, the analytical KiBaM also yields a lifetime of 15000 seconds. As an example of the computational complexity, the CTMC for ∆ = 5 has 2882 states and a generator with more than 3.2 · 106 nonzero transition rates. To compute the transient state probabilities for t = 17000 seconds more than 36000 iterations are needed. For decreasing stepsize ∆ the curves from the approximation algorithm approach the simulation curve. This an indication for the correct operation of the algorithm. However, even for ∆ = 5 the approximation is not really a good one, since it is in general difficult to closely approximate an almost deterministic value through a phase-type distribution. We also evaluated the battery lifetime of the on/offmodel for better approximations to the deterministic on- and off-times, that is, for K > 1 in the Erlang model (we do not show curves here). While the lifetime distribution obtained from simulation gets even closer to a deterministic one for increasing K, the values computed by the approximation algorithm do not change visibly. This is due to the fact that the approximation is not good enough to capture the relatively small differences. Figure 8 shows the lifetime distribution of the on/off model with K = 1 for c = 0.625, that is, at the beginning 62.5% of the charge are in the available-charge well and 37.5% are in the bound-charge well. The constant for the
for the approximation algorithm are quite far away from the one obtained by simulation. Unfortunately it is not feasible to consider a substantially smaller ∆ for this example. For ∆ = 5 we have about 3.2 · 106 non-zeroes in the generator matrix Q∗ . For t = 10000, uniformisation requires more than 2.3 · 104 iterations, each with 3.2 · 106 multiplications. For t = 20000, more than 4.6 · 104 iterations are needed. In Figure 9 we compare the lifetime distribution of the two cases already described with a third scenario, where the initial capacity of the battery is only 4500As= 0.625 · 7200As and completely in the available-charge well. In the first case (C = 7200As, c = 1) the battery lasts generally longer than in the second case (C = 7200As, c = 0.925), because all charge is available. In the third case (C = 4500As, c = 1), the battery lifetime is in general shorter, because there is no bound-charge to be transferred to the available-charge well. 1
Pr[battery empty at time t]
0.8
0.6
0.4
0.2 C=4500, c=1 C=7200, c=0.625 C=7200, c=1 0 6000
8000
10000
12000
14000
16000
18000
20000
t (s)
Figure 9. On/off model with different initial capacities (∆ = 5).
8
6.2
Simple & burst model
is, its lifetime distribution curve lies right from the one for the simple model. For example, after 20 hours the battery is empty with a probability of about 95% when using the simple model while it is empty with probability only about 89% in case of the burst model.
We now evaluate and compare the battery lifetime distributions for the simple and the burst model. Figure 10 shows the lifetime distribution for the simple model (see Figure 4) for three different battery settings. The left set of curves is calculated for a capacity C = 500mAh and c = 1, that is, all capacity sits in the available-charge well. The rightmost curve is for C = 800mAh and c = 1. It is computed by a uniformisation-based algorithm [25] which is applicable for this special case and the small number of states. The middle set of curves corresponds to the actual KiBaMRM with C = 800mAh, c = 1 and k = 4.5 · 10−5 /s= 1.96 · 10−2 /h.
1 0.9 0.8
Pr[battery empty at time t]
0.7 0.6 0.5 0.4 0.3
1 0.2 0.1 simple model burst model
0.8 0 Pr[battery empty at time t]
0
5
10
15 t (hours)
20
25
30
0.6
Figure 11. Battery lifetime distribution for the simple and the burst model (C = 800mAh, c = 0.625, ∆ = 5)
0.4
C=500, c=1, Delta=25 C=500, c=1, Delta=2 C=500, c=1, simulation C=800, c=0.625, Delta=25 C=800, c=0.625, Delta=2 C=800, c=0.625, simulation C=800, c=1, exact
0.2
7 Conclusion
0 0
5
10
15
20
25
The aim of this paper has been twofold. First of all we have discussed the increasing importance of the incorporation of battery aspects into system models. In particular, we stressed the need for considering the nonlinear aspects of the battery models. Using the analytical KiBaM as a starting point, we developed the KiBaMRM, a rewardinhomogeneous Markov reward model for batteries. With this model we can assess the battery lifetime distribution for a stochastic workload model. We would like to mention that the KiBaM does not cover all aspects of battery behaviour (see Section 2). However, the class of time- and rewardinhomogeneous MRMs is flexible enough to describe more realistic battery models. For the actual computation of the battery lifetime distribution we provided an efficient approximation algorithm where the accumulated rewards are discretised. The computation then boils down to the transient solution of a CTMC. With an implementation of this algorithm we evaluated the lifetime of some small workload models, thereby also comparing to simulation results. Trying to approximate the almost deterministic lifetime for the on/off model resulted in a poor accuracy. In contrast, for the simple and burst mode of a wireless device, the algorithm gave good results. Using the computed lifetime distributions we could show that in general the battery lasts longer for the burst model than for the simple model. Future work will include the exploration of more realistic MRMs for batteries and the evaluation of real world poweraware devices.
30
t (hours)
Figure 10. Battery lifetime distribution for the simple model For the simple model, it is possible to compute good approximations using the Markovian approximation algorithm. For the leftmost set of curves, only the availablecharge well is discretised while for the middle set of curves both wells have to be discretised. This results in a better approximation for the left curves in comparison to the middle curves. From Figure 10 one can see that if only 62.5% of the capacity becomes available at all (leftmost curves) the battery is most certainly empty (with probability > 99%) after about 17 hours. If the rest of the charge is initially in the bound charge well, the battery gets surely empty after about 23 hours, if all capcity is readily available (rightmost curve), after about 25 hours. Hence, for this workload model it is in general not possible to make use of the total capacity of 800mAh, if it is distributed between the bound-charge well and the available-charge well. However, a large fraction of the total capacity becomes available, which is shown by the fact that the middle curves are closer to the right curve than to the left set of curves. In Figure 11 we finally compare the battery lifetime distribution of the simple and the burst model. The burst model condenses the send activity and consequently spends more time in sleep mode. This lets the battery last longer, that 9
References
[14] A. Horvath and M. Gribaudo, “Matrix geometric solution of fluid stochastic Petri nets,” in Proceedings of the 4th International Conference on Matrix Analytic Methods in Stochastic Models. World Scientific, 2002.
[1] IEEE Computer, vol. 38, no. 11. IEEE Press, 2005. [2] D. Rakhmatov and S. Vrudhula, “An analytical highlevel battery model for use in energy management of portable electronic systems,” in Proceedings of the International Conference on Computer Aided Design (ICCAD’01), 2001, pp. 488–493.
[15] B. R. Haverkort, H. Hermanns, J.-P. Katoen, and C. Baier, “Model checking CSRL-specified performability properties,” in Proceedings of the 5th International Workshop on Performability Modeling of Computer and Communications Systems (PMCCS’01), 2001, pp. 105–109.
[3] Overview of lithium ion batteries. [Online]. Available: http://www.panasonic.com/ industrial/battery/oem/images/ pdf/Panasonic LiIon Overview.pdf
[16] B. R. Haverkort, L. Cloth, H. Hermanns, J.-P. Katoen, and C. Baier, “Model checking performability properties,” in Proceedings of the International Conference on Dependable Systems and Networks (DSN’02). IEEE Press, 2002, pp. 102–112.
[4] The spice page. [Online]. Available: http://bwrc.eecs.berkeley.edu/ Classes/IcBook/SPICE/ [5] K. Lahiri, A. Raghunathan, S. Dey, and D. Panigrahi, “Battery-driven system design: a new frontier in low power design,” in 7th Asia and South Pacific Design Automation Conference (ASP-DA’02), 2002, pp. 261– 267.
[17] L. Cloth, “Model Checking Algorithms for Markov Reward Models,” Ph.D. dissertation, University of Twente, 2006. [18] B. Haverkort and J. Katoen, “The performability distribution for nonhomogeneous Markov-reward models,” in Proceedings 7th Performability Workshop (PMCCS’05), 2005, pp. 38–42.
[6] C. Chiasserini and R. Rao, “Pulsed battery discharge in communication devices,” in Proceedings of the 5th International Conference on Mobile Computing and Networking, 1999, pp. 88 – 95.
[19] M. Gribaudo and A. Horvath, “Fluid stochastic Petri nets augmented with flush-out arcs: A transient analysis technique,” IEEE Transactions on Software Engineering, vol. 28, no. 10, pp. 944–955, 2002.
[7] D. Panigrahi, C. Chiasserini, S. Dey, R. Rao, A. Raghunathan, and K. Lahiri, “Battery life estimation of mobile embedded systems,” in Proceedings of the 14th International Conference on VLSI Design, 2001, pp. 57 – 63.
[20] L. Cloth, B. Haverkort, and M. Jongerden, “Evaluation of battery lifetimes using inhomogeneous Markov reward models,” CTIT, University of Twente, Tech. Rep. 06-58, 2006.
[8] J. Manwell and J. McGowan, “Lead acid battery storage model for hybrid energy systems,” Solar Energy, vol. 50, pp. 399–405, 1993.
[21] N. van Dijk, “Uniformisation for nonhomogeneous Markov chains,” Operations Research Letters, vol. 12, 1992.
[9] V. Rao, G. Singhal, A. Kumar, and N. Navet, “Battery model for embedded systems,” in VLSID ’05. Washington, DC, USA: IEEE Computer Society, 2005, pp. 105–110.
[22] A. Rindos, S. Woolet, I. Viniotis, and K. Trivedi, “Exact methods for the transient analysis of nonhomogeneous continuous time Markov chains,” in 2nd International Workshop on the Numerical Solution of Markov Chains, 1995, pp. 121–133.
[10] J. F. Meyer, “On evaluating the performability of degradable computing systems,” IEEE Transactions on Computers, vol. 29, no. 8, pp. 720–731, 1980. [11] ——, “Performability: a retrospective and some pointers to the future,” Performance Evaluation, vol. 14, no. 3, pp. 139–156, 1992.
[23] A. van Moorsel and K. Wolter, “Numerical solution of non-homogeneous Markov processes through uniformisation,” in Proceedings of the 12th European Simulation Multiconference, 1998, pp. 710–717.
[12] A. Bobbio and L. Roberti, “Distribution of the minimal completion time of parallel tasks in multireward semi-Markov models,” Performance Evaluation, vol. 14, pp. 239–256, 1992.
[24] M. Telek, A. Horv´ath, and G. Horv´ath, “Analysis of inhomogeneous Markov reward models,” Linear Algebra and its Applications, vol. 386, pp. 383–405, 2004.
[13] G. Horton, V. G. Kulkarni, D. M. Nicol, and K. S. Trivedi, “Fluid stochastic Petri nets: Theory, applications, and solution techniques,” European Journal of Operational Research, vol. 105, pp. 184–201, 1998.
[25] B. Sericola, “Occupation times in Markov processes,” Communications in Statistics — Stochastic Models, vol. 16, no. 5, pp. 479–510, 2000. 10