Computing Indicators of Creativity Kyu Han Koh Dept of Computer Science University of Colorado Boulder, CO. 80303
[email protected]
Vicki Bennett Dept of Communication University of Colorado Boulder, CO. 80303
[email protected]
ABSTRACT
Divergent thinking has been linked to creative processes leading to innovative artifacts. Measuring creative divergence can be difficult. Across the USA, the Scalable Game Design (SGD) Project includes thousands of student participants building their own games through learning computational thinking (CT). To evaluate these games, a technique, the Computational Thinking Pattern Analysis (CTPA) [1], was developed, refined and used successfully. Under three different learning conditions, divergence was computed through CTPA, and then analyzed and explored as an indication of creativity. Author Keywords
Alexander Repenning Dept of Computer Science University of Colorado Boulder, CO. 80303
[email protected]
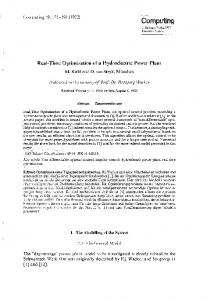
method to depict the semantic meaning, Computational Thinking Pattern [1] that is represented as an abstracted programming pattern of the submitted games/simulations to the Scalable Game Design Arcade, a cyberlearning infrastructure [3]. CTPA analyzes the implemented semantic meaning (CT patterns) of a submitted game/simulation with a similar technique as the Latent Semantic Analysis [6]. CTPA calculates high dimensional cosine similarity between a given game/simulation and nine canonical pre-defined computational thinking patterns. The value from this high dimensional cosine similarity calculation for each computational thinking pattern is displayed as a graphical representation (Figure 1).
Creativity Measurement, Game Design, Computational Thinking, Computational Thinking Pattern Analysis.
Below equation represents a high dimensional cosine calculation for CTPA.
ACM Classification Keywords
CTPA (u,v) (high dimensional cosine value between vectors)
K.3.m. Computers and education: Miscellaneous. General Terms
Design, Measurement, Performance. INTRODUCTION
Creativity and divergent thinking have been linked to ways of problem solving that increase the quality and quantity of viable solutions [2]. Programming, however, presents unique obstacles for creativity measurement. Analyzing programming manually can be time-consuming, and laborintensive. The first obstacle to address is defining creativity. The creative process described in research investigations, includes the identifying or discovery of a problem and the selection of a solution with an identifiable outcome. However this outcome must be unique or divergent from most or all other possible solutions [3]. Divergent thinking tasks are currently the most recognized creative assessments [4,5]. Since computer programming lends itself to computational solutions, assessing a creative or divergent element in programming should be possible. During the 2010/2011 school-year, we explored some early stages of mathematical measurement to calculate divergence in game programming with a sixth grade teacher participating in the Scalable Game Design Project. Among three of her classes, a highly divergent cluster pattern for the game programming element was shown. METHODS Computational Thinking Pattern Analysis
Computational Thinking Pattern Analysis (CTPA) [1] is a Copyright is held by the author/owner(s). C&C’11, November 3–6, 2011, Atlanta, Georgia, USA. ACM 978-1-4503-0820-5/11/11.
=
!!! !!! !!∙ !! ! !! !!! !
! !! !!! !
Equation 1 CTPA calculates the value of cosine 𝜙 between two n-dimensional vectors, u and v Divergence Calculation
A divergence in programming among the student games would tend to show that each student approached the game programming from a unique perspective. Consequently, we surmised that creativity in programming could be shown as the divergence of a particular programming solution employed by one student, as opposed to another. Thus, we devised the divergence calculation to demonstrate studentprogramming creativity as a divergence calculation from the “norm” or SGD tutorial. Figure 1 depicts a studentsubmitted game in comparison to the official SGD tutorial game on a Computational Thinking Pattern Analysis graph [1]. The gap between the tutorial (brown) and the submitted artifact (green) illustrates the difference of that student’s game from the “norm.” The Divergence Score is calculated from the length (norm) of vector difference of the nineelement vector (nine computational thinking patterns). Divergence Score (u, v) =
! (! !! )! ! !!! !
!
Equation 2 Divergence Score (u, v) where u and v represent nine-element vectors from a tutorial and a submitted game, and n stands the number of computational thinking patterns.
graph depiction, we speculate that there could be a significant difference between the in-class learning condition and the online one. Viewing all three learning conditions through the graph’s perspective presents a new picture that highlights the revised tutorial and the “in-class” condition as significant factors among the three class conditions. DISCUSSION AND CONCLUSION
Currently, the most common measurement of creativity is based on tests of divergence [4,5]. The larger the divergence from the standard, the more creative the solution is. Although the quality and quantity of the solutions to the task must be considered, divergence from the accepted “norm” is a significant indicator of creativity. Figure 1 Computational Thinking Pattern Analysis Graph from a Tutorial and a Submitted Game FINDINGS
Sheryle (pseudonym) was chosen for this analysis because she taught classes in three distinct conditions. Using the same teacher for all three conditions eliminates her as a variable in the calculations. The three class/learning conditions are as follows. The first learning condition is described as a standard type of technology/computer science class, taking place in a physical classroom. A standardized online tutorial provided by the SGD project is the basis for the class. The second class learning condition is similar to the first, except that the students are exposed to the teacher’s own tutorial instead of the standardized version. In the third and last class/learning condition, the students are exposed to the teacher’s own tutorial in an online environment, without her physical presence. The distribution graph for Sheryl’s three different class conditions was drawn with the divergence scores from each class (Fig 2).
Looking at the Divergence Calculation graph (Fig. 2) there are three separate clusters. Even without the designating colors, the three class conditions stand apart. Although the implications and meanings of the different cluster spreads is a subject for future papers, the most significant feature of the Divergence Calculation graph is that each of the three separate class-learning conditions generated unique divergence patterns on the graph. The amount of creativity that each cluster pattern represents is not as important as the fact that it appears to demonstrate programming creativity, in general. So based on the idea that creativity can be shown through divergence in thinking and feeling [4,5], it stands to reason that creativity in programming can be shown through a similar divergence to a standard norm through calculating the divergence to that norm. REFERENCES
1. Koh, K. H., Basawapatna, A., Bennett, V., Repenning, A. Towards the Automatic Recognition of Computational Thinking for Adaptive Visual Language Learning, IEEE International Symposium on Visual Languages and Human-Centric Computing 2010, Leganés-Madrid, Spain, September 21-25, 2010 2. Torrance, E.P. “Creative teaching makes a difference.” In J.C. Gowan, J. Khatena, & E.P. Torrance (Eds.), Creativity: Its Educational Implications (2nd ed., pp. 99108). Dubuque, IA: Kendall-Hunt, 1981. 3. Bennett, V., Koh, K. H., Repenning, A. CS Education Re-Kindles Creativity in Public Schools, ITiCSE '11: Annual Conference on Innovation and Technology in Computer Science Education, Darmstadt, Germany, June 27-29, 2011. 4. Runco, M.A. & Okuda, S.M. “Problem discovery, divergent thinking, and the creative process.” Journal of Youth and Adolescence, 17:3, 211-220, 1988. 5. Williams, F.E. “Creativity assessment packet examiner’s manual.” Austin TX: PRO-ED, 1993.
Figure 2 The Divergence Score Distribution Graph in Three Different Class Conditions
In this graph, x-axis means the divergence score, and y-axis means the number of students within set ranges. From this
6. Landauer, T. K., Foltz, P. W., Laham, D. Introduction to Latent Semantic Analysis. Discourse Processes, 25, 1998, 259-284