showing the traffic scene from a 3D viewpoint that is slightly raised above the driver .... Speed signs in front of the driver's car belong to the ..... Toronto, Canada.
Concept for visualizing concealed objects to improve the driver’s anticipation Simon Nestler
Markus Duschl
Fachgebiet Augmented Reality Technische Universit¨at M¨unchen Fakult¨at f¨ur Informatik Boltzmannstraße 3, 85748 Garching bei M¨unchen Germany
Fachgebiet Augmented Reality Technische Universit¨at M¨unchen Fakult¨at f¨ur Informatik Boltzmannstraße 3, 85748 Garching bei M¨unchen Germany
Darya Popiv
Mariana Rakic
Lehrstuhl f¨ur Ergonomie Technische Universit¨at M¨unchen Fakult¨at f¨ur Maschinenwesen Boltzmannstraße 15, 85748 Garching bei M¨unchen Germany
BMW Group Forschung und Technik GmbH Hanauerstraße 46 80992 M¨unchen Germany
Gudrun Klinker Fachgebiet Augmented Reality Technische Universit¨at M¨unchen Fakult¨at f¨ur Informatik Boltzmannstraße 3, 85748 Garching bei M¨unchen Germany Current advanced driver assistance systems (e.g. Emergency Brake Assistance, Lane Departure Warning, Lane Keeping Assistance and Blind Spot Detection) assist the driver in reacting to time-critical and unstable situations in a proper way. However, the anticipation of situations which are lying in the farer future is currently left primarily to the driver. In this paper, we present visualization concepts for concealed objects in order to support smart deceleration. Smart deceleration requires the anticipation of future traffic condition and the assistance of the driver in performing deceleration phases efficiently. In addition, safety is increased by reduction of potential criticality through the early deceleration phase. We have identified and categorized situations in which a broader anticipation is possible: situations with permanent obstacles, situations with temporarily stopped vehicles and situations with slower driving vehicles. An important issue when presenting information to the driver is the identification of the most suitable perspective. For visualizing the traffic situation in the surroundings of the driver’s car we established a virtual bird-eye perspective (VBEP), showing the traffic scene from a 3D viewpoint that is slightly raised above the driver and rigidly tethered to the car. This VBEP is a powerful concept to draw the driver’s attention to situations in the further future. On the basis of this concept we developed different visualizations and integrated them in the digital instrument cluster between the speedometer and the revolution counter.
MOTIVATION The goal of this paper is to visualize concealed objects in order to support anticipative driving behavior. All different reasons for the concealing of objects lead to the same problem: The driver’s perception is incomplete. Aside from experience, knowledge and attention, drivers’ anticipation bases also on their perception. An incomplete perception leads to wrong anticipation – which might result in critical situations. Some of such critical situations could be avoided by an improvement of driver perception.
INTRODUCTION Current advanced driver assistance systems (ADAS), such as Emergency Brake Assistance (Tamura, Inoue, Watanabe, & Maruko, 2001), Lane Departure Warning (Labayrade, Douret, & Aubert, 2006), Lane Keeping Assistance (Ishida & Gayko, 2004), Blind Spot Detection (Matuszyk, Zelinsky, Nilsson, & Rilbe, 2004), Night Vision (Bellotti, Bellotti, Gloria, Andreone, & Mariani, 2004), and Overtaking Assistance (Batavia, Pomerleau, & Thorpe, 1997) support the driver in reacting to these time-critical and unstable situations in a proper way. These current ADAS do not, however, focus on assisting the driver in the very early identification of critical situations. The anticipation of situations in the farer future is
left primarily to the driver. Especially in situations in which the driver’s field of vision is limited, e.g. because of fog, vertical curves or turns proper anticipation is impossible due to limited cognition. In order to anticipate properly, the driver requires information on the upcoming traffic situation. When the driver is distracted, proper anticipation is hindered due to the incomplete situation assessment. We designed a visualization concept which overcomes the cognition limitations by visualizing the upcoming traffic situation from a bird-eye perspective. Additionally our visualization concept provides a situation assessment which leads the driver to correct anticipation even if he is partially distracted. We mainly focus on traffic situations in which the visualization of anticipatory information leads to a smart deceleration process. The proposed visualization concept assists the driver in performing deceleration phases efficiently. In addition, safety is increased by reduction of potential criticality due to early deceleration. Section 3 gives a short overview of related work in the field of integrating different ADAS functionalities in a consistent HCI concept. In Section 4, different traffic situations in which we want to improve the drivers’ perception are presented. Our virtual bird-eye perspective is presented and dis-
cussed in Section 5. The visualization concept for the situations of Section 4 is described in Section 6. Options for haptic assistance are presented in Section 7. Section 8 gives a short outlook on our future work.
RELATED WORK According to (Gruyer, Rakotonirainy, & Vrignon, 2005) the integration of a wide range of functionalities can improve the reliability of ADAS. Moreover, systems which monitor car dynamics and environment perception should be combined with systems which assess the driver’s state. They presented an integrated ADAS which merges these different existing functionalities. The challenge is to avoid the isolation of human computer interactions from the rest of activities in which the driver is involved within HCI research approaches (Rakotonirainy, 2003). The increasing information access (e.g. phone calls, traffic information, speed limits) leads to new challenges in driver distraction considerations. The combined impact of multiple in-vehicle devices on the driver’s distraction has been analyzed by (Brooks & Rakotonirainy, 2005). Among others, (Dugarry, 2004) faced the problem of information overload caused by ADAS, in-vehicle communication systems (IVCS) and in-vehicle information systems (IVIS), creating potentially dangerous conditions. Dugarry focused on the prioritization and presentation of currently relevant information in order to prevent overload in most conditions.
TRAFFIC SITUATIONS We categorized situations in which smart deceleration can be useful into three classes: 1) situations with permanently stationary obstacles, 2) situations with temporarily stopped vehicles and 3) situations with slower driving vehicles. In situations with permanent obstacles, the driver is approaching an obstacle that does not move, e.g., a construction site. In situations with temporarily stopped vehicles, an driving vehicle ahead stops and becomes a temporary obstacle, e.g., a car in the process of parking or letting passengers get out. In the situations with slower driving vehicles, the vehicle ahead is moving, but its speed is considerably lower than the speed of the own car, e.g., trucks or tractors. Using these three classes, we developed a visualization concept that can be adapted to a large range of traffic situations, as described below.
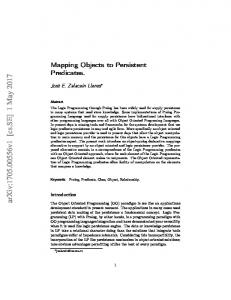
Speed limitation ahead Speed signs in front of the driver’s car belong to the group of situations with permanent obstacles. We have considered two cases. In the first case (see Fig. 1), the driver’s car is on a rural road which changes into an urban road. In the second case (see Fig. 2), the driver is on a (German) highway without speed limitation, followed by a section with a speed limitation to 100 km/h. In the first case, the deceleration phase starts at 100 km/h and ends at 50 km/h whereas in the second case, the deceleration phase starts somewhere between 130 km/h and 200 km/h and ends at 100 km/h. From the technical point of view, different options for recognizing these speed signs are feasible: camera based recognition, maps with additional information or speed signs with wireless communication capabilities.
Figure 1. Speed sign ahead on a rural road
Figure 2. Speed sign ahead on a highway
Construction site ahead Construction sites in front of the driver’s car also belong to the group of situations with permanent obstacles. In this case (see Fig. 3) the driver’s car is, for instance, on a rural road with a construction site on his side of the road. Because of the oncoming traffic he has to decelerate in front of the construction site. The smarter the driver decelerates, the more likely it is that he do not have to come to a complete stop; he can make use of one of the gaps in the oncoming traffic. This deceleration phase starts at 100 km/h and ends at 0 km/h (in the worst case when the driver performs a hard braking maneuver in close distance to the obstacle).
Parking vehicle ahead Parking vehicles in front of the driver’s car belong to the group of situations with temporarily stopped obstacles. As an example for this case (see Fig. 4), the driver’s car is on an urban road with a car parking in his own lane. Because of the oncoming traffic he has to decelerate in front of the parking vehicle. To some extent, this situation is similar to the situation with the construction site; however it differs in three aspects: Firstly, the early identification of a parking vehicle is more difficult than the identification of a construction site (especially realizing the fact that the car is standing still in the lane might be difficult for inexperienced drivers). Secondly, the obstacle is only temporary and might go away within the next seconds. Thirdly, the speed on urban roads is significantly lower than on rural roads. Here, the deceleration phase starts at 50 km/h and ends at 0 km/h (in the worst case).
Figure 3. Construction site ahead on a rural road, with traffic in the opposite lane
Figure 4. Parking vehicle ahead on an urban road, with the time until further movement of the obstacle unknown Figure 6. Traffic jam ahead on a highway
Figure 5. Red traffic light ahead on an urban road, with the time until change of the light unknown
Red traffic light ahead Red traffic lights with standing vehicles belong to the group of situations with temporarily stopped vehicles. In this case (see Fig. 5), the driver’s car might be on an urban road and approach a crossing with a traffic light. The light is currently red, and some stopped cars are standing in front of it. Such cars make this situation more complex than what has recently been covered in designs of traffic sign assistants (Moutarde, Bargeton, Herbin, & Chanussot, 2007) and (Thoma, Klinker, & Lindberg, 2007). The driver waits for the traffic light to switch to green during the deceleration phase. The smarter his deceleration is the more likely it is that he does not have to stop completely. This deceleration phase starts at 50 km/h and ends at 0 km/h (if the red phase of the traffic light is very long).
Jam ahead Depending on the driving speed of the cars in the jam, the situation either belongs to the group with temporarily stopped vehicles or to the group with slower driving vehicles. It even might be argued that a completely standing traffic jam could be considered a permanent obstacle due to the fact that its dissolution within the next seconds is practically impossible. As an example for the first situation (see Fig. 6), the driver’s car approaches a traffic jam on a highway in which the cars have come to a complete standstill. In the second situation (see Fig. 7), the traffic jam is still moving at about 60 km/h. In the first case, the deceleration phase starts between 130 km/h and 200 km/h and ends at 0 km/h whereas in the second case, the deceleration phase starts between 130 km/h and 200 km/h and ends at 60 km/h.
Figure 7. Slowly moving traffic jam ahead on a highway
km/h and end at 70 km/h, i.e., the speed of the slower driving vehicle.
VIRTUAL BIRD-EYE PERSPECTIVE An important issue when presenting information to the driver is the identification of the most suitable perspective. (Milgram & Colquhoun, 1999) and (Milgram & Kishino, 1994) distinguish between four cases: 1) information is presented in an egocentric view of the user (here: driver), 2) information is shown from a viewpoint that is raised above and behind the user, yet rigidly tethered to the user, 3) the viewpoint is world-referenced, i.e., independent of the user, yet at a low height, and 4) the view point is very high above the user, e.g. on a satellite. The first two cases are called egocentric, the latter two are called exocentric. All different perspectives are shown in Figure 10. The options for presenting traffic information to the driver depend on the camera position and orientation, relative to the egocentric reference frame of the driver. For visualizing the traffic situation in the surroundings of the driver’s car a rigidly tethered 3D perspective seems to be most suitable. This rigid tethering can be described by the following metaphor: A bird carrying a camera is flying behind the driver’s car; the traffic situation is shown from the bird’s perspective. Therefore we call this special egocentric perspective virtual bird-eye perspective (VBEP).
Slower driving vehicle ahead Slower driving vehicles in front of the driver’s car require the driver to decelerate. We consider two cases. In the first case (see Fig. 8), the driver’s car is on a rural road, with overtaking being prohibited. In the second case (see Fig. 9), the driver is on a rural road with significant oncoming traffic. The driver is unable to overtake the slower vehicle because of this oncoming traffic. Both deceleration phases start at 100
Figure 8. Slower driving vehicle ahead on a rural road, with overtaking being prohibited
Figure 9. Slower driving vehicle ahead on a rural road with traffic in the opposite lane
Figure 10. Different perspectives, from egocentric to exocentric (according to Milgram & Colquhoun, 1999 and Milgram & Kishino, 1994)
The complete semi sphere on which the camera can theoretically be placed for a VBEP is shown in Figure 11. The angle α describes the rotation around the x-axis, whereas the angle β describes the rotation around the y-axis.1 A rotation around the z-axis is not feasible. The distance d is the distance between camera and car; d is the length of the translation vector. To experiment with different perspectives, we built an Augmented Reality-based design tool, consisting of a webcam and an ARToolKit marker (Kato & Billinghurst, 1999). This Toolkit is able to determine the position and orientation of a camera relative to live video images of markers. It can then augment the images with virtual objects in real-time. For the VBEP design tool, we use a piece of paper showing a street and a marker at the position where the driver’s car is supposed to be. The car is shown as a virtual object that is overlaid on the image stream (see Fig. 12a). By moving the webcam, the designer can explore different viewing perspectives onto the car. Additionally we explore various traffic situations by plac-
Figure 11. Semi sphere on which the camera can be placed
(a) Augmented driver’s car (b) Augmented traffic jam Figure 12. VBEPs with webcam and ARToolKit marker
ing obstacles in relation to the driver’s vehicle (see Fig. 12b). The camera based tracking requires the designer to rotate the camera such that the camera sees the marker. Consequently the marker is visible in all perspectives which are selected by the engineer. Thus, our approach prohibits the designer from choosing perspectives in which the driver’s car is not visible and the driver might become disoriented, loosing the overview. The VBEP concept and the design tool enable the designer of a traffic visualization concepts to freely adapt the camera position as well as the region of interest to the current situation. The tool enables the designer to intentionally explore turning the driver’s spotlight to objects, which currently might not be visible in reality. The advantage of the VBEP design tool setup is that the designer can adapt all parameters (α, β, d) of the bird-eye perspective in real time while the car goes through one or more of the envisaged traffic situations. Setting the region of interest on objects in the farer future is done by decreasing distance d and decreasing angle α. Setting the region of interest on the direct surroundings of the driver’s car is done by increasing angle α and increasing distance d. When using this camera based VBEP design tool, the engineer does not have to think about angles and distances, but just translates and rotates the camera such that all important objects are visible in the VBEP. For visualizing the traffic situations of Section 4, we found that translating the camera position in the negative z direction as well as in the positive y direction leads to the best overview on the current traffic situation. Additionally the camera has to be rotated clockwise around the x-axis. These three modifications enable us to present information in the farer future best. Consequently in our presented visualization concept, all information which is required by the driver is visualized from this special virtual bird-eye perspective. Summarizing our line of thought thus far: It is currently much speculated that an egocentric presentation of information within a driver’s field of view (e.g. contact-analog presentations in a head-up display) may be of great benefit for ADAS. We here object that a purely egocentric presentation is not suitable for supporting driver anticipation of events in the further future since such presentation needs to show objects that cannot yet be seen. In our visualization concept for concealed objects, all information for driver anticipation of deceleration maneuvers is therefore visualized from a virtual bird-eye perspective (VBEP). It still adheres to an egocentric reference frame. Yet, it is capable of adding a well-dosed amount of overview support, thereby strengthening driver anticipation. 1 We use a right handed coordinate system, the y-axis is oriented upwards, the z-axis goes into the projection plane and the x-axis goes to the left.
VISUALIZATION CONCEPT The VBEP is a powerful concept to draw the driver’s attention to situations in the further future. On the basis of this concept we developed visualizations of traffic situations from Section 4, and integrated them in the digital instrument cluster between the speedometer and the revolution counter. We integrated an abstract version of the VBEP. The visualization differs from the one used for the VBEP design tool (Fig. 12). It is more schematic and less realistic to account for the fact that the visualizations will be presented to the driver during car motion. In the visualization concepts we tried to focus on the essential; nevertheless we tried to visualize all information which is necessary for the driver’s correct anticipation. We use only a very schematic representation of the road. The update of the traffic situation can either be done continuously or in discrete steps (e.g. 1 second). Although the real road has some horizontal or vertical curves, the road in the visualization remains straight. Due to the fact that a more detailed course of the road would make the visualization more dynamic, we decided to exclude the course of the road in our first visualizations. Below the road the directions of both lanes are shown. Whereas on a highway the driver’s lane and the lane left of the driver’s lane are most important for a proper anticipation, on urban and rural roads the driver’s lane and the lane of the opposite direction are important for a proper anticipation. Consequently, on highways, the left lane is in the driver’s direction and on all other roads the left lane is in the opposite direction. The driver’s car is visualized in white and has a static position on the road; it is always at the lower end of the right lane. This effect is just a consequence of the VBEP approach - the scene is shown from a camera which is tethered rigidly to the driver’s car. Other cars are visualized in orange, with different symbols for oncoming and driving ahead cars. Additionally we included a symbol for smart deceleration in our VBEP which indicates the point in time when the smart deceleration has to be started. The deceleration phase itself is marked by the orange bar at the right side of the road. In most cases at end of the deceleration phase an orange situationspecific symbol is included in the visualization. The start and end of the deceleration phase is discretized in steps of 1 second. Consequently the visualization enables the driver to get information for the next n seconds, the distance which is shown in this visualization depends on the driver’s current speed. As a consequence of this visualization, symbols automatically become larger the more important (closer) they become for the driver. The fading out of the symbols can be delayed as long as the driver has not reacted on the symbol.
Figure 13. VBEP of speed sign ahead on a rural road
Figure 14. VBEP of speed sign ahead on a highway
Construction site ahead The construction site is indicated by three street posts. All other situations are described by the combination of other cars and traffic signs. For this situation we additionally need an abstract visualization for an obstacle on the road which is not a car. Therefore we decided to use these street posts as a metaphor for these kinds of obstacles. Moreover the complete oncoming traffic is shown in the visualization in Figure 15. The deceleration symbol indicates the best start of the deceleration phase according to the oncoming traffic and the construction site.
Parking vehicle ahead The parking vehicle as well as the oncoming traffic is visualized in orange, whereas the driver’s car is visualized in white. The speed of the parking car (which is zero of course) has not been included in the visualization, as shown in Figure 16. We decided to show the fact that the car is standing still by its orange warning lights instead. Again, this is just a metaphor and even if the parking car has not warning lights in reality they are included in our visualization. The length of the deceleration phase, however, indicates that the difference between the driver’s speed and the speed of the car ahead is rather large.
Speed limitation ahead The speed limitations to 50 km/h and 100 km/h are shown in the visualization by an additional speed sign. In addition to the monochrome speed signs we developed a similar visualization with the original colors as well. The two situations (rural, see Fig. 13 and highway, see Fig. 14) differ in the start speed and the end speed. As a consequence the start point of the deceleration phase and the length of the deceleration phase are different. Furthermore the direction of the left lane is different because the first situation is on a rural road whereas the second situation is on a highway. In this situation, however, the direction of the left lane is not that important.
Figure 15. VBEP of construction site ahead on a rural road, with traffic in the opposite lane
Figure 16. VBEP of parking vehicle ahead on an urban road, with the time until further movement of the obstacle unknown
Figure 17. VBEP of red traffic light ahead on an urban road, with the time until change of the light unknown
Red traffic light ahead The major information which has to be communicated to the driver is the fact that a car is standing at the traffic light, as shown in Figure 17. The information that the car is rather slow or is even standing can be deduced from the length of the deceleration phase. Additionally it is important for the driver to know that overtaking does not make any sense in this situation because the reason for the stand still of the car ahead is the red traffic light. Therefore we just included a simple monochrome symbol for the red traffic light. Again, we do not show the crossway itself to the driver. As an alternative we developed a visualization with the original colors of a traffic sign.
Jam ahead The jam ahead of the driver’s car is indicated by the visualization of all cars in this jam. There are two ways to distinguish traffic which has come to a complete halt (see Fig. 18) from slow-moving traffic (see Fig. 19): Again, the length of the deceleration phase is larger if the cars are standing than if the cars are still moving. Additionally the two situations can be distinguished by the signs: When the cars are standing the traffic jam sign is shown whereas when the cars are moving their speed is shown. In both traffic jams the low speed of the cars ahead is indicated by the warning lights.
Figure 18. VBEP of traffic jam ahead on a highway
Figure 19. VBEP of slowly moving traffic jam ahead on a highway
We want to mention that this visualization does not give any overtaking suggestions even if overtaking is not prohibited and no oncoming cars were detected.
HAPTIC ASSISTANCE The proposed concept of visual assistance can be combined with a haptic assistance, i.e. active accelerator pedal (AAP) as proposed by (Reichart et al., 1998). In combination with haptic assistance, the visualization explains the reason for the proposed deceleration phase, whereas the AAP lets the driver feel how deceleration process can be performed in an efficient way. Without the visualization the driver is not able to identify the reason for the deceleration recommendation given by the AAP, due to the fact that the reasons for the smart deceleration are in the further future and might be not visible from the driver’s egocentric perspective. This active accelerator pedal applies resistance against the driver’s foot, indicating that the driver should decelerate in order to reach the upcoming lower speed which is being anticipated by the system as an appropriate for considered driving situations. If the driver decides to obey the haptic suggestion, he will feel the resistance on the accelerator pedal until he positions his foot such that exactly needed amount of acceleration is produced for reaching and keeping the target speed. It should be mentioned that if the driver decides
Slower driving vehicle ahead There are two situations which lead to problems when a slower driving vehicle is in front of the driver’s car: A slower driving vehicle in a zone where overtaking is prohibited, and a slower driving vehicle while encountering oncoming traffic. When overtaking is prohibited this information is presented to the driver by a monochrome symbol (see Fig. 20). Again, another alternative with the original colored symbol has been developed as well. When the oncoming traffic makes the overtaking impossible, this oncoming traffic is shown in the visualization (see Fig. 21). The speed of the slower driving vehicle can be estimated by the length of the deceleration phase.
Figure 20. VBEP oflower driving vehicle ahead on a rural road, with overtaking being prohibited
clarification of design, arrangement and structuring the evaluation will focus on the effect of anticipation support. We expect that our visualization concept helps the driver to drive more anticipatory than without any information on the further future. Therefore within this evaluation the concept for visualizing concealed objects to improve the driver’s anticipation will be compared with driving without assistance. Additionally the visual assistance will be compared to the combination of visual and haptic assistance. Figure 21. VBEP of slower driving vehicle ahead on a rural road with traffic on the opposite lane
Figure 22. Force-path diagram for the active accelerator pedal (according to Reichart et al., 1998)
to decelerate more strongly, i.e. gives less gas as the system suggests, he also does not experience the resistance (see Fig. 22). The driver is able in any case to press over the resistance on the gas pedal, with that dismissing the advice of the system. Activation of the haptic feedback suggesting to the driver taking his foot off the accelerator pedal is done for all described situations. Apart from these situations, the accelerator pedal acts in the convenient manner.
CONCLUSIONS AND FUTURE WORK This paper presented investigations which perspective is suitable for visualizing anticipatory driving information in the farer future. Our current concept considers future to be a matter of time rather than a matter of space: The visualization shows the part of the road that the car will drive across in the next n seconds, depending on the current speed. Thus, the road in our visualization concept is rather a time line than a spatial map of the further course of the road. Of course there is a close connection between what will happen in the near future (matter of time) and what will happen in front of the driver’s car (matter of space). Nevertheless some situations are related to spatial aspects (e.g. a traffic jam), some situations are related to temporal aspects (e.g. oncoming traffic) and some situations are related to time and space aspects (e.g. overtaking a car with oncoming traffic). In our further work we want to take a closer look at the importance of space in the support of the driver’s anticipation. It might help the driver not just to know that a traffic jam is 10 seconds away but that it is behind the next curve in front of him. In order to keep the visualization simple in the first step we did not include the course of the road yet, as described in Chapter 6. We expect, however, that in some situations the course of the road might improve the driver’s cognition and anticipation. The next step will be to conduct an evaluation of the proposed visualization concepts. After a pre-evaluation for the
REFERENCES Batavia, P., Pomerleau, D., & Thorpe, C. (1997, November). Overtaking vehicle detection using implicit optical flow. In Intelligent transportation system, itsc ’97 (pp. 729–734). Bellotti, C., Bellotti, F., Gloria, A. D., Andreone, L., & Mariani, M. (2004, June). Developing a near infrared based night vision system. In Intelligent vehicles symposium (pp. 686–691). Brooks, C., & Rakotonirainy, A. (2005, June). In-vehicle technologies, advanced driver assistance systems and driver distraction: Research challenges. In International conference on driver distraction. Sydney, Australia. Dugarry, A. (2004). Advanced driver assistance systems information management and presentation. Unpublished doctoral dissertation, Cranfield University School of Engineering, Applied Mathematics and Computing Group. Gruyer, D., Rakotonirainy, A., & Vrignon, J. (2005, February). Advancement in advanced driving assistance systems tools: Integrating vehicle dynamics, environmental perception and drivers’ behaviours to assess vigilance. In Intelligent vehicles and road infrastructure conference. Melbourne, Victoria. Ishida, S., & Gayko, J. (2004, June). Development, evaluation and introduction of a lane keeping assistance system. In Intelligent vehicles symposium (pp. 943–944). Kato, H., & Billinghurst, M. (1999, October). Marker tracking and hmd calibration for a video-based augmented reality conferencing system. In Proceedings of the 2nd international workshop on augmented reality (iwar 99). San Francisco, USA. Labayrade, R., Douret, J., & Aubert, D. (2006, September). A multimodel lane detector that handles road singularities. In roceedings of the ieee itsc 2006, 2006 ieee intelligent transportation systems conference. Toronto, Canada. Matuszyk, L., Zelinsky, A., Nilsson, L., & Rilbe, M. (2004, June). Stereo panoramic vision for monitoring vehicle blind-spots. In Intelligent vehicles symposium (pp. 31–36). Milgram, P., & Colquhoun, H. (1999). A taxonomy of real and virtual worlds display integration. In Mixed reality-merging real and virtual worlds (pp. 1–16). Berlin. Milgram, P., & Kishino, F. (1994). A taxonomy of mixed reality visual display. In Ieice trans, on information and sstems (special issue on networked reality) (pp. 1321–1329). Moutarde, F., Bargeton, A., Herbin, A., & Chanussot, L. (2007, June). Robust on-vehicle real-time visual detection of american and european speed limit signs, with a modular traffic signs recognition system. In Intelligent vehicles symposium (pp. 1122– 1126). Rakotonirainy, A. (2003). Human-computer interactions: Research challenges for in-vehicle technology. In Proceedings 2003 road safety research, policing and education conference (pp. 214– 219). Sydney. Reichart, G., Friedmann, S., Dorrer, C., Rieker, H., Drechsel, E., & Wermuth, G. (1998). Potentials of bmw driver assistance to improve fuel economy. In 27th fisita congress. Paris. Tamura, M., Inoue, H., Watanabe, T., & Maruko, N. (2001). Research on a brake assist system with a preview function. In Sae 2001 world congress, session: Human factors in automotive telematics. Thoma, S., Klinker, G., & Lindberg, T. (2007, October). Speed Recommendations During Traffic Light Approach: A Comparison of Different Display Concepts. In Proceedings of the human factors and ergonomics society europe chapter annual meeting. Braunschweig, Germany.