June 2011 VOL. 92 • NO. 6 • JUNE 2011
CONTENTS
Reports 1193 Currents connecting communities: nearshore community similarity and ocean circulation • J. R. WATSON, C. G. HAYS, P. T. RAIMONDI, S. MITARAI, C. DONG, J. C. MCWILLIAMS, C. A. BLANCHETTE, J. E. CASELLE, AND D. A. SIEGEL
1201 Shifting phenology and abundance under experimental warming alters trophic relationships and plant reproductive capacity • YINZHAN LIU, PETER B. REICH, GUOYONG LI, AND SHUCUN SUN
1208 Soil biota drive expression of genetic variation and development of population-specific feedbacks in an invasive plant • EMMI FELKER-QUINN, JOSEPH K. BAILEY, AND JENNIFER A. SCHWEITZER
Concepts and Synthesis 1215 Quantity and quality: unifying food web and ecosystem perspectives on the role of resource subsidies in freshwaters • AMY M. MARCARELLI, COLDEN V. BAXTER, MADELEINE M. MINEAU, AND ROBERT O. HALL, JR.
Articles 1226 Variation in resource consumption across a gradient of increasing intra- and interspecific richness • CHAD W. HARGRAVE, K. DAVID HAMBRIGHT, AND LAWRENCE J. WEIDER
1236 Life history benefits of residency in a partially migrating pond-breeding amphibian • KRISTINE L.
1247 Overturning conclusions of Lévy flight movement patterns by fishing boats and foraging animals • ANDREW M. EDWARDS
AND MARK A. HINDELL
1271 Pre-reproductive survival in a tropical bird and its implications for avian life histories • COREY E. TARWATER, ROBERT E. RICKLEFS, J. DYLAN MADDOX, AND JEFFREY D. BRAWN
Volume 92 No. 6
ECOLOGY A P U B L I C AT I O N O F T H E E C O L O G I C A L S O C I E T Y O F A M E R I C A
1282 Spatial variance in abundance and occupancy of corals across broad geographic scales • RONALD H. KARLSON, SEAN R. CONNOLLY, AND TERENCE P. HUGHES
1292 Importance of dispersal and thermal environment for mycorrhizal communities: lessons from Yellowstone National Park • YLVA LEKBERG, JAMES MEADOW, JASON R. ROHR, DIRK REDECKER, AND CATHERINE A. ZABINSKI
1303 Mycorrhizal fungal identity and diversity relaxes plant–plant competition • CAMERON WAGG, JAN JANSA, MARINA STADLER, BERNHARD SCHMID, AND MARCEL G. A. VAN DER HEIJDEN
1314 The importance of quantifying propagule pressure to understand invasion: an examination of riparian forest invasibility • ANNE K. ESCHTRUTH AND JOHN J. BATTLES
1323 Climate determines upper, but not lower, altitudinal range limits of Pacific Northwest conifers • A. K. ETTINGER, K. R. FORD, AND J. HILLERISLAMBERS 1332 A novel statistical method for classifying habitat generalists and specialists • ROBIN L. CHAZDON, ANNE CHAO, ROBERT K. COLWELL, SHANG-YI LIN, NATALIA NORDEN, SUSAN G. LETCHER, DAVID B. CLARK, BRYAN FINEGAN, AND J. PABLO ARROYO
Contents continued on inside of back cover
Concepts & Synthesis
JUNE 2011
GRAYSON, LARISSA L. BAILEY, AND HENRY M. WILBUR
1258 In situ measures of foraging success and prey encounter reveal marine habitat-dependent search strategies • MICHELE THUMS, COREY J. A. BRADSHAW,
VOL. 92, NO. 6, 1193–1384
ISSN 0012-9658
Quantity and quality: unifying food web and ecosystem perspectives on the role of resource subsidies in freshwaters
Articles
Variation in resource consumption across a gradient of increasing intra- and interspecific richness Environmental change and declining resource availability for small-mammal communities in the Great Basin
Ecology, 92(6), 2011, pp. 1366–1375 ! 2011 by the Ecological Society of America
Environmental change and declining resource availability for small-mammal communities in the Great Basin REBECCA J. ROWE,1,3 REBECCA C. TERRY,2 1
AND
ERIC A. RICKART1
Utah Museum of Natural History, University of Utah, 1390 East Presidents Circle, Salt Lake City, Utah 84112 USA 2 Department of Biology, Stanford University, 371 Serra Mall, Stanford, California 94305 USA
Abstract. Changes in climate and land use can impact natural systems across all levels of ecological organization. Most documented and anticipated effects consider species’ properties, including phenologies, geographic distributions, and abundances. Responses of higher-level aggregate community or ecosystem properties have not been considered as they are assumed to be relatively stable due to compensatory dynamics and diversity–stability relationships. However, this assumption may not be as fundamental as previously thought. Here we assess stability in the aggregate properties of total abundance, biomass, and energy consumption for small-mammal communities in the Great Basin, using paired historical and modern survey data spanning nearly a century of environmental change. Results show marked declines in each aggregate property independent of spatial scale, elevation, or habitat type, and a reallocation of available biomass and energy favoring diet and habitat generalists. Because aggregate properties directly reflect resource availability, our findings indicate a regionwide decline in resources of ;50% over the past century, which may signal a resource crisis. This work illustrates the power of using aggregate properties as indicators of ecological conditions and environmental change at broad spatial and temporal scales. Key words: biodiversity; biomass; climate change; ecological indicators; ecosystem stability; energy use; generalist species; Great Basin, USA; historical resurveys; land use; resource limitation; small mammals.
INTRODUCTION Anthropogenic activities are causing rapid environmental changes from local to global scales. Efforts to understand how ecological processes have responded to anthropogenic pressures have focused primarily on species-level properties, including phenology, geographic distribution, and abundance (e.g., Hughes 2000, Walther et al. 2002, Parmesan 2006, Rosenzweig et al. 2007). The impacts of climate change and land use on higher-level aggregate properties of communities and ecosystems (e.g., biomass and energy use) are rarely considered, especially in terrestrial animal systems and over multidecadal to centennial time scales. Emphasis on species’ properties as reliable ecological indicators likely stems from the long-standing view in ecology that populations are highly dynamic over short temporal scales and that compensatory dynamics and species diversity yield more stable, higher-level aggregate properties (e.g., McNaughton 1977, Tilman and Downing 1994, Hughes and Roughgarden 1998, Ives et al. 1999, Cottingham et al. 2001, Ernest and Brown 2001). However, this assumption may not be tenable for natural systems under all types of disturbance. Manuscript received 18 August 2010; revised 12 January 2011; accepted 4 February 2011. Corresponding Editor: F. A. Smith. 3 E-mail:
[email protected]
The responses of aggregate properties to disturbance traditionally have been studied under pulse or point perturbations in resources over limited spatial and temporal scales. Anthropogenic environmental change over the past century, however, has been chronic and the effects cumulative. Thus outcomes from discrete disturbance scenarios may not be informative in forecasting expectations of faunal change under future environmental scenarios (Smith et al. 2009). In fact, recent models and experiments show much variability in the responses of aggregate properties depending on the type, frequency, and time scale of disturbance (Vasseur and Fox 2007, Downing et al. 2008, Keitt 2008). Furthermore, compensatory dynamics in natural communities may occur less frequently than previously thought (e.g., Houlahan et al. 2007, Mutshinda et al. 2009), and the diversity– stability relationship may be multifaceted and dependent on the context of the perturbation (Ives and Carpenter 2007). As such, the presumed relative stability of aggregate community properties over time is equivocal (Micheli et al. 1999). In addition, recent work has shown that aggregate properties can directly reflect resource availability in natural systems (Ernest and Brown 2001, Enquist et al. 2003, del Monte-Luna et al. 2004). We therefore argue that aggregate properties can reveal important signals of biotic response to environmental change over broad spatial and temporal scales. Furthermore, because these metrics are universal, they may
1366
June 2011
CLIMATE CHANGE AND RESOURCE DEPLETION
more readily enable direct comparisons between disparate systems and regions than do species-level responses. Here we use paired historical (1927–1929) and modern (2006–2008) survey data on small-mammal communities from the Ruby Mountains of the Great Basin (USA) (Borell and Ellis 1934, Rowe et al. 2010), to assess stability in three aggregate community properties (total abundance, biomass, and energy use) over an 80-year interval. During this period, climate change, land use, and invasive species have dramatically transformed the native plant communities of the Great Basin (Miller and Wigand 1994, Knapp 1996), designating it as one of the most threatened ecosystems in North America (Noss et al. 1995). Specifically, we examined the direction and magnitude of changes in total abundance, biomass, and energy use between the two survey periods and whether these changes are: (1) scale dependent or vary with elevation; (2) concordant within and among groups of species with similar ecologies; and (3) correlated with site-specific changes in climate, community composition, and structure. METHODS Study system and field surveys.—The Ruby Mountains are located in northeastern Nevada and constitute one of the largest mountain systems (1821 km2) within the Great Basin. The regional ecosystem is cold temperate semidesert, with local habitats along the elevational gradient ranging from desert shrublands to alpine tundra. Conditions here have, on average, become warmer (summer maximum temperature þ0.948 6 0.098C, mean 6 SE) and wetter (winter precipitation þ17.68 6 0.87 mm) over the past 80 years (Rowe et al. 2010). Habitat alteration has been most profound at low elevations, where changes in climate and land use (e.g., fire suppression and grazing by domestic livestock) have facilitated the expansion of pi˜non–juniper woodland into sagebrush steppe and the encroachment of shrubland into areas previously dominated by grasses and open habitat (Miller and Rose 1999, Weisberg et al. 2007, Bradley and Fleishman 2008, Rowe et al. 2010). Historical (1927–1929) and modern (2006–2008) data on the occurrence and abundance of small-mammal species in the Ruby Mountains were generated from comprehensive field surveys conducted at identical or nearby locations (Borell and Ellis 1934, Rowe et al. 2010). Modern sampling protocols directly followed historical precedence, and both surveys spanned the latitudinal and elevational extent of the mountain range (Rowe et al. 2010). For the analysis of aggregate community properties we limited our data to sites surveyed over multiple consecutive nights during the summer months (May–August), for a total of 12 historical and 21 modern sites, nine of which represent paired resurveys at precise locations. Analyses included only small (,500 g) nonvolant mammals (shrews and rodents) documented with comparable methods of removal trapping. We excluded all effort and capture
1367
data associated with mesocarnivores, as well as data from methods that either targeted specific species or were used inconsistently over time (i.e., pitfall traps, gopher traps, steel leg-hold traps, and firearms). Voucher specimens from modern surveys were deposited at the Utah Museum of Natural History, Salt Lake City, Utah, USA; the Field Museum of Natural History, Chicago, Illinois, USA; and the Monte L. Bean Museum, Brigham Young University, Provo, Utah, USA. Each modern site was surveyed for a minimum of 500 trap-nights (one trap, set one night) over at least four consecutive nights. On average, resurveys occurred within two weeks of the calendar date of the historical survey (mean ¼ 14.67 days, median 13 days). Collector field notes from the historical surveys provided detailed trapping records, including complete or near-complete information on effort (i.e., the number of trap-nights at each locality) and abundance (i.e., the numbers and identity of all captures), and museum specimens enabled confirmation of species’ identifications (Rowe et al. 2010). The 8519 historic trap-nights resulted in the capture of 1672 individuals representing 19 species (Appendix A). In comparison, a total of 15 632 modern trap-nights resulted in the capture of 1485 individuals, representing 18 species. Consideration of only the nine paired-resurvey sites yielded similar trapping summaries (historic: 7103 trap-nights, 1408 individuals, 19 species; modern: 6539 trap-nights, 592 individuals, 17 species). Between the historical and recent surveys, a total of 22 species was documented, 15 of which occurred during both survey periods (Appendix A). Estimating aggregate properties.—Standard field measurements of individuals processed as museum specimens were used to generate an average body mass per species for each time period. Data on body length and mass for each specimen from the modern surveys were obtained from collector field catalogs. Pregnant individuals were excluded. Data from both sexes were combined, as patterns of sexual size dimorphism, when present, are subtle and may be either male or female biased. All species-specific body length and mass relationships obtained from the modern data were of a power law form (P , 0.05 for all species; R 2 ranged from 0.25 to 0.94; median R 2 ¼ 0.71), which we used to estimate the historical mass of individuals using available historical body length measurements. By doing so, we accounted for potential shifts in body size between the two sampling periods. For species documented only during the historical period, we used data on mass from secondary sources (i.e., published species accounts, museum specimens, and field catalogs) from other localities in the Great Basin (Appendix A). Because temporal changes in age structure could bias trends in biomass or energy use, we calculated the average mass and number of captures of each species per time period for both adult (ad) and immature (im) age categories separately. Field notes from both historical
1368
REBECCA J. ROWE ET AL.
and recent surveys recorded the age for each specimen and, in most instances, for captures that were not vouchered. When age was not designated (9% of total captures), we assigned captures (per species per site) to each age category based on the proportions observed among age-assigned individuals. We standardized capture data by determining the abundance of each ith species (Ni ) using catch totals rarefied by sampling effort. Each species’ biomass (Bi ) was calculated using its age-specific average body mass (Mi ) and abundance (Ni ): Bi ¼ Niad Miad þ Niim Miim : Similarly, we calculated the energy use (Ei ) of each species as Ei ¼ aNiad Mibad þ aNiim Mibim where a and b are allometric parameters. We assumed the theoretically predicted scaling exponent of b ¼ ł (Peters 1983, Savage et al. 2004). We followed White et al. (2004) in estimating a ¼ 5.69 for rodents based on the field metabolic rates from Nagy et al. (1999) refit with a slope of ł. Field metabolic rates represent the average rate of energy expenditure of free-living animals under natural conditions. The Nagy et al. (1999) sample included a diverse set of rodent taxa (xeric and mesic, herbivore and granivore), one-third of which are represented in our data set either directly or through ecological equivalents. Similarly, we used a ¼ 5.89 for shrews based on field metabolic rates from Fournier et al. (1999), refit with a slope of ł. Totals for abundance, biomass, and energy use were obtained by summing across the value for each species at each site. Species-specific summaries of mass, body length, and both raw and standardized capture data are provided in Appendix A. Data analysis.—We assessed changes in total abundance, biomass, and energy use over the 80-year interval at three spatial scales: (1) local sites, (2) binning sites within three zones of equal elevational extent (474 m), and (3) the entire Ruby Mountains system. The three elevational zones approximate major transitions in habitat from desert shrub and pi˜non–juniper woodland at low elevation to aspen and mountain mahogany woodland at mid elevation, and limber pine and subalpine meadow at high elevation. At the larger spatial scales, mean values of each aggregate metric over time were compared using Student’s t test. Systemwide we used Kolmogorov-Smirnov tests to compare historical and modern frequency distributions on the number of species in each value class of total abundance, biomass, and energy use. We also considered patterns of change among functional groups (Appendix A) defined by habitat preference along the moisture gradient (mesic, xeric, generalist) and diet (omnivore, insectivore, herbivore, granivore) (Reed et al. 2006, Rowe et al. 2010). Due to small sample sizes (four to
Ecology, Vol. 92, No. 6
eight species), our assessment of consistency in the direction of change among species within functional groups is qualitative. Arcsine-transformed estimates of proportional measures of abundance, biomass, and energy use among functional groups were compared between time periods using Student’s t test. For the nine paired-resurvey sites, we used regression analyses and Akaike’s Information Criterion corrected for small sample sizes (AICc) for model selection (Burnham and Anderson 2002) to assess the relationships between the magnitude of change in each metric and the following abiotic and biotic factors: site elevation, change in mean summer maximum temperature, change in winter/spring precipitation, richness during the historical period, and similarity of the community over time. Two similarity indices were tested, one qualitative (Jaccard) and one quantitative (Morisita-Horn). However, both were not considered in the same model set, resulting in two model sets for each aggregate property. Each predictor variable was considered individually and in combination, for a total of 31 models per model set (Appendix B). Climate data (at ;4 km resolution) were obtained from the PRISM Climate Group (Daly et al. 1994) and averaged across the three survey years and three preceding years for both historic and modern periods (Rowe et al. 2010). Similarity indices were computed using EstimateS version 7.5 (Colwell 2005). All analyses were based on the effort-standardized abundance data and were conducted in the R statistical framework version 2.9.2 (R Core Development Team 2009) and SPSS (SPSS 2008). RESULTS Over the 80-year interval, pooled data from all of the survey sites revealed significant declines in total abundance, biomass, and energy use, with modern values representing approximately half of those seen in the historical period (Fig. 1). Declines of comparable magnitudes also were evident when the comparisons were limited to the nine paired-resurvey sites. Assessment of frequency distributions over time revealed no significant differences (Kolmogorov-Smirnov test, abundance P ¼ 1.0; biomass, P ¼ 0.97; energy use, P ¼ 0.97), indicating that declines were distributed across all classes (i.e., range of values) for each attribute. As expected, considering the stability in frequency distributions, the observed changes in abundance, biomass, and energy use at resurvey sites were highly correlated (r ¼ 0.776–0.956, P , 0.05 for all comparisons). Unless noted otherwise, we report analyses using data from all survey sites in both sampling periods and focus on energy use, the most comprehensive of the aggregate properties. Along the elevational gradient (1425 m), there was no significant linear (historic P ¼ 0.981, R 2 , 0.01; modern P ¼ 0.273, R 2 ¼ 0.06) or quadratic (historic P ¼ 0.694, R 2 ¼ 0.08; modern P ¼ 0.109, R 2 ¼ 0.22) relationship between energy use and elevation for either time period
June 2011
CLIMATE CHANGE AND RESOURCE DEPLETION
(Fig. 2A). Among the modern data, a single outlier (2306 m) was for a site located at a heavily used campground and may reflect an influx of anthropogenic food resources; removing this site did not alter these findings (linear P ¼ 0.090, R 2 ¼ 0.15; quadratic P ¼ 0.108, R 2 ¼ 0.23). Elevational patterns of total abundance and biomass were also nonsignificant and qualitatively similar to those for energy use (not shown). Change in energy use along the gradient was evaluated at both the landscape scale by binning sites within three equal-extent (475 m) elevation zones that approximated major transitions in habitat type (Fig. 2B), and at the site level for the nine paired resurveys (Fig. 2C). For the binned sites, a significant decrease in mean energy use was apparent at low elevation (Fig. 2B), the only zone for which we had dense sampling in both time periods. Among the nine paired-resurvey sites, the magnitude of change in energy use was not correlated with elevation (Fig. 2C). For the nine resurvey sites, potential drivers of change in aggregate properties were further evaluated using an information-theoretic approach. No models were identified as having strong explanatory power (AICc weight . 0.60) for the variation in the magnitudes of shifts among the resurveyed sites (Appendix B: Table B1). Similarly, the relative support for individual predictor variables was low (summed AICc weights , 0.50; Appendix B: Table B2). Although not strongly supported, the best-fitting model (DAICc ¼ 0) for each data set included only one predictor variable, which was change in precipitation for both energy use and biomass, and change in temperature for abundance (Appendix B: Table B1). The overall decline in energy use across the 80-year interval (Fig. 1) masked important differences in the direction and magnitude of change among functional groups (Fig. 3). Habitat generalists showed increased energy consumption, but this was overwhelmed by concurrent decreases for both mesic and xeric specialists (Fig. 3A). Similarly, the increase in energy use among omnivores was offset by decreases among both granivores and herbivores (Fig. 3B). Insectivores showed negligible change in energy use over time. Trends for biomass mirrored those presented here for energy use (Appendix C: Fig C1). In contrast, results for abundance differed slightly, with relatively weak increases over time among mesic species and insectivores (Appendix C: Fig C2). Within three of the seven functional groups (xeric habitat specialists, granivores, and herbivores) there were consistent directional responses (Appendices D, E). In each instance, all species documented historically exhibited decreases in energy use over time. The only increases in energy use were seen for Peromyscus truei and Reithrodontomys megalotis (from among the xeric and granivore groups, respectively), but both of these species were documented during the modern period only (Appendices D, E). Species showing the greatest decreases in energy use included both habitat specialists
1369
FIG. 1. Values (means and 95% CI) for total abundance, biomass, and energy use of small mammals found in the Ruby Mountains of northeastern Nevada, USA, during the historical and modern survey periods. Results are provided for all sites (black) and the nine paired-resurvey sites (gray). All analyses are based on effort-standardized abundance data. P values represent t test results. Sample sizes precluded testing whether interannual variability within survey periods impacted these findings.
(mesic and xeric) and diet specialists (herbivores and granivores). In contrast, species that showed the greatest increases in energy use were dietary generalists (omnivores), including both habitat specialists and generalists (Appendix E).
1370
REBECCA J. ROWE ET AL.
Ecology, Vol. 92, No. 6
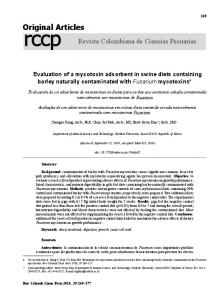
Across elevation, changes in proportional energy use were not uniform among habitat groups or diet groups (Fig. 4). For habitat groups, the greatest changes were evident at low elevation where energy use decreased significantly for both mesic and xeric specialists while increasing significantly for habitat generalists (Fig. 4A). At mid and higher elevations, only xeric specialists show declines in energy use. However, we noted that at high elevation only one xeric species (Lemmiscus curtatus) was documented historically and was not detected in the modern survey (Appendix A). For diet groups, energy use among omnivores significantly increased in each elevational zone, while herbivores and granivores showed consistent decreases. No significant changes were noted for insectivores (Fig. 4B). While the magnitude of change for omnivores was independent of elevation, for both herbivores and granivores greater decreases in proportional energy use were evident with increasing elevation (Fig. 4B). DISCUSSION
FIG. 2. Energy use of small mammals along the elevation gradient. The elevation associated with each site represents the average across all traplines at that site. (A) Total energy use for each site surveyed during the historical (black circles; n ¼ 12) and modern (open circles; n ¼ 21) periods. The outlier in the modern data set (2306 m) is a USDA Forest Service campground (see Results for further discussion). (B) Energy use (means and 95% CI) among sites within the historical (black) and modern (gray) periods, for each of three broad, equalextent elevation zones (low, 1590–2064 m; mid, 2065–2539 m; high, 2540–3014 m). For each elevation zone, significance was determined using a t test comparing historical to modern values. Small sample sizes (from low to high elevation sites, n ¼ 6, 4, 2 for historical periods; n ¼ 9, 4, 8 for modern periods), especially at higher elevations, render statistical power low. (C) Change in energy use at each of the nine paired-resurvey sites. Regression analysis indicated no significant relationship between the magnitude of change in energy use and elevation.
Using data from comprehensive historical and modern surveys conducted 80 years apart, we documented substantial declines in the total abundance, biomass, and energy use for the small-mammal fauna of the Ruby Mountains, Nevada. These declines were evident across spatial scales, and their magnitudes were independent of elevation, extent of changes in climate, community similarity over time, and community diversity during the historical period (Figs. 1, 2; Appendix B). Different responses of functional groups indicated faunal restructuring that involved increases in generalist species and disproportionate declines in ecological specialists (Fig. 3; Appendix C: Fig. C1). Changes were most extreme at low elevations, which have been subject to both warming and major transitions in land cover, but were also apparent at higher elevations where land cover has been most stable over time (Fig. 4). The structure and dynamics of ecological communities are generally considered to be resource limited (e.g., MacArthur 1972, Tilman 1982). Assuming species differ in their resource needs and maximize their consumption of resources, a steady state will exist between resource supply and use. Under this framework, the aggregate community properties of biomass and energy use are measures of community consumption and can be interpreted as direct reflections of resource availability (Ernest and Brown 2001, Enquist et al. 2003, del MonteLuna et al. 2004, White et al. 2004). The consistent response of the small-mammal fauna across spatial scales and at multiple sites with different habitats and disturbance regimes suggests a large-scale, profound restructuring of the resource base. Overall, our findings thus indicate depletion in available resources over the past century of ;50%, and a reallocation of resources in favor of generalist species at the expense of ecological specialists.
June 2011
CLIMATE CHANGE AND RESOURCE DEPLETION
1371
FIG. 3. Change in energy use of functional small-mammal groups over time. Two functional group categories are considered: (A) habitat preference along the moisture gradient (generalist, mesic, xeric) and (B) diet (omnivore, insectivore, granivore, herbivore). Functional group assignments for each species are provided in Appendix A.
Ecological networks are complex, and variability in resources can directly or indirectly influence the dynamics of populations and communities through bottom-up or top-down effects (e.g., Yang et al. 2008, Smith et al. 2009). The scale independence of our results suggests the primary driver of resource loss to be universal rather than the collective effects of differential drivers at various local sites along the elevational gradient. At all spatial scales, land use and climate can disrupt ecosystem functioning and impact the type, quantity, and quality of resources. During the 80-year resurvey interval of our study, there were many ecological changes in the Great Basin that were direct or indirect results of human land-use practices. Native plant communities were altered as a result of livestock grazing, which in turn altered the distribution and abundance of large native herbivores and predators (Grayson 1993). When the historical surveys were conducted in the late 1920s there was clear evidence of overgrazing by cattle, sheep, and horses (Borell and Ellis 1934). Deer were present but apparently uncommon, and both bighorn sheep and pronghorn had been extirpated. Mountain lions were not detected but had been reported in the region a few years previously, while coyotes, bobcats, and smaller predators were apparently common (Borell and Ellis 1934). By the time of our resurveys, decades of regulation had greatly reduced overgrazing in the Great Basin (Young and Clements 2006). The direct impacts from domestic grazing that we observed were limited to a few lowelevation sites, whereas we saw widespread signs of habitat recovery from historical overgrazing, particularly in riparian areas. Since the 1920s, mule deer have increased substantially in Nevada (Wasley 2004), and were regularly seen during our surveys. Mountain lions are now common in the Great Basin (Berger and Wehausen 1991) and, along with coyotes and bobcats, are subjects of predator control programs (Nevada Department of Wildlife 2009).
If ungulates significantly reduce resources available to small mammals, this should be reflected in reduced abundance, biomass, and energy use of the latter. Available evidence indicates that overall ungulate densities (i.e., both domestic and native) are currently much lower than they were during the period leading up to the historical surveys. The observed decreases in small-mammal community attributes are therefore the opposite of the predicted influence of lower ungulate density. Likewise, top carnivores may influence densities of mesocarnivore predators of small mammals through intraguild predation (Roemer et al. 2009). Because mountain lions are currently much more abundant than they were in the past, densities of mesocarnivores may be lower now than in the past and would therefore have less impact on small mammals. Again, the observed decreases in small-mammal community attributes are the opposite of what would be expected under this scenario. Furthermore, any impact of large grazers and browsers or predators would be heterogeneous across the landscape with respect to habitat type and elevation. Overall, the documented decreases in small-mammal abundance, biomass, and energy use do not appear to have been biotically mediated through concurrent changes in the densities of large herbivores and carnivores. Changes in climate can alter primary productivity, which can have pervasive impacts on the structure and function of communities and ecosystems through bottom-up effects (Scheffer et al. 2001, Yang et al. 2008, Smith et al. 2009, Warne et al. 2010). Today conditions in the Ruby Mountains are warmer and wetter than they were 80 years ago during the historical surveys (see Methods). Although there is variation in the net direction and magnitude of these changes among sites and elevational zones, increases in both temperature and precipitation are systemwide (Rowe et al. 2010). While warmer and wetter conditions often imply an increase in primary productivity (Melillo et al. 1993), the net increase in precipitation has occurred over a
1372
REBECCA J. ROWE ET AL.
Ecology, Vol. 92, No. 6
FIG. 4. Proportional energy use over time of functional groups for both (A) habitat preference and (B) diet within each elevation zone (low, 1590–2064 m; mid, 2065–2539 m; high, 2540–3014 m). Original measurements were in kJ/d, but they are reported as proportion of total energy use. Comparisons of historical (black) and modern (white) proportions were based on arcsinetransformed values. Asterisks indicate a significant increase or decrease in proportional representation over time. Change in energy use among herbivores at low elevation was marginally significant (P ¼ 0.06). Functional group assignments for species are provided in Appendix A. * P , 0.05; ** P , 0.01.
period marked by increased frequency and severity of drought, decreased snowpack, and extreme seasonal precipitation (Mote et al. 2005, Weiss et al. 2009). Such increases in extreme climate events may alter the general trend of increased productivity in response to warming (Pe˜nuelas et al. 2007) and can have important and prolonged impacts on natural systems (Easterling et al. 2000). Furthermore, expectations under the chronic and cumulative changes in climate over the past may not mirror those documented under relatively discrete pulses in resources (Smith et al. 2009). We therefore believe the
cumulative effects of gradual warming and increased variability in precipitation provide the most parsimonious explanation for the systemwide decline in basal resources and subsequent decline in small-mammal biomass and energy use. Additionally, the cumulative impact of multiple, idiosyncratic fluctuations in resources would likely favor persistence of ecological generalists rather than specialists (Warren et al. 2001, Blois et al. 2010). Although the pervasiveness of our findings across space and spatial scale suggests a primary driver of
June 2011
CLIMATE CHANGE AND RESOURCE DEPLETION
climate change, the interaction of changes in climate and land use and the invasion of nonnative plant species at local sites are likely to have secondary impacts on the type, quantity, and quality of resources as well as patterns of resource reallocation among particular species. Previous work on this system has documented species-specific changes in species distributions attributable to either direct changes in temperature or the interactive secondary effects of climate and land use (Rowe et al. 2010). This study suggests that the cumulative effect of unprecedented climate change over the past century has been a decrease in available resources and a reallocation of resources in favor of generalist species at the expense of ecological specialists. Because data are available for only the endpoints of this 80-year interval, we do not know if our findings signal an unprecedented resource crisis or whether the carrying capacity of the landscape naturally varies at or beyond this magnitude over long time intervals. Understanding the apparent decline in resource availability in the Ruby Mountains requires a yardstick against which one can measure the magnitude and duration of change, especially relative to known changes in climate and/or land use. The current literature provides few comparative standards. The most relevant is the Portal project in Arizona, where continuous timeseries data (;25 years) on a desert rodent community shows great fluctuation in energy use over time but no net long-term change (Ernest and Brown 2001, White et al. 2004). This stability in energy use over two decades may result from compensatory dynamics, and it occurs despite substantial directional change in climate and land cover at the site (Brown et al. 1997), which mirror changes observed at some of the low-elevation sites in the Ruby Mountains (Rowe et al. 2010). While this may suggest that our observed decline in resource availability after 80 years is simply a downturn in a fluctuating system, the consistency in the regionwide signal we detect argues against local short-term dynamics as the root cause of the decline. Furthermore, it is unclear to what extent the annual dynamics at Portal (among granivores at one precipitation-limited desert site) can be translated to our entire Ruby Mountain data set. Given the greater temporal and spatial scale of our study, our inclusion of all functional groups within the smallmammal community, and the cumulative impact of multiple climate and land-use drivers, the Portal project may not provide an appropriate framework against which to interpret our results. Lastly, the absence of a relationship between either community stability (i.e., species composition) or historical diversity and the magnitude of change observed at the nine paired-resurvey sites suggests that lower-level traits and aggregate properties of communities may be decoupled, at least over longer time scales or under chronic perturbation scenarios. While we recognize that our data set is not suitable for directly testing time-scale-sensitive patterns of synchrony or compensa-
1373
tion (Keitt and Fischer 2006, Downing et al. 2008, Keitt 2008), we suggest that that the pattern we documented in the Ruby Mountains is likely to be representative of long-term dynamics under conditions of chronic resource alteration (Smith et al. 2009). Our work suggests that a broader range of studies across a spectrum of disturbance types and spatiotemporal scales is needed to better understand and forecast the impacts of environmental change. To be most informative, this integration requires a paleobiological perspective from the Quaternary fossil record to provide a baseline for understanding the consistency, magnitude, and duration of fluctuations in aggregate community properties with reference to preimpact changes in climate and land cover (Terry 2010). Integrating ecological studies across broad spatiotemporal scales will provide the necessary framework to: (1) discern resource crisis from natural variability, (2) develop and test hypotheses about the impact of chronic directional changes in climate, (3) infer whether human land-use practices are modifying climate-driven expectations, and (4) inform whether the coupling of lower-level responses and aggregate properties are dependent upon disturbance type or temporal scale. In conclusion, aggregate community properties are typically considered relatively stable over time. This perspective comes from empirical and theoretical work conducted at relatively short (intra-annual to decadal) time scales, with the objective of developing a mechanistic understanding of community variability and stability (Hughes and Roughgarden 1998, Cottingham et al. 2001, Ernest and Brown 2001, Keitt and Fischer 2006, Ives and Carpenter 2007). Here we evaluated aggregate community properties over nearly a century of environmental change and revealed a marked decline in available resources. This decline is independent of spatial scale or habitat type, and includes reallocation of remaining resources favoring diet and habitat generalists. Counter to previous assumptions, our work suggests that aggregate properties are important ecological indicators over large spatial and multidecadal to centennial time scales. Furthermore, because these metrics are universal, they may be more easily compared between studies and systems than species-level responses. As such, they can be used to integrate across ecological disciplines (Ernest and Brown 2001, Loreau 2010) spanning a range of spatial and temporal scales, ultimately providing a more comprehensive picture of the effects of environmental change on ecosystem stability. ACKNOWLEDGMENTS This work was supported by National Science Foundation Grant DEB 0919409, the National Geographic Society, the American Philosophical Society, and the University of Utah Research Foundation. Fieldwork was conducted under permits from the Nevada Division of Wildlife and the U.S. Fish and Wildlife Service. Field procedures followed guidelines of the American Society of Mammalogists and were certified by the University of Utah IACUC, protocol #06-02001. For assistance
1374
REBECCA J. ROWE ET AL.
in conducting fieldwork we thank L. F. Alexander, D. Amundsen, N. Anderson, D. S. Balete, A. Briles, C. Firestone, M. Hall, L. R. Heaney, T. H. Horton, P. Jibson, L. Millward, A. T. O’Connor, H. Paulsen, M. Small, M. C. Small, P. A. Ramirez, E. E. Remington, S. L. Robson, and D. S. Rogers. For insightful discussion and comments we thank E. A. Hadly, P. G. Harnik, and M. Novak. We also thank two anonymous reviewers for comments that improved the clarity and presentation of this work. For access to materials we thank R. M. Timm and N. A. Slade at the Natural History Museum, University of Kansas; and C. J. Conroy, K. Klitz, and J. L. Patton at the Museum of Vertebrate Zoology, University of California–Berkeley. We also thank T. Schute and D. Ashby of the Ruby Mountains Ranger District, U.S. Forest Service. LITERATURE CITED Berger, J., and J. D. Wehausen. 1991. Consequences of a mammalian predator–prey disequilibrium in the Great Basin desert. Conservation Biology 5:244–248. Blois, J. L., J. L. McGuire, and E. A. Hadly. 2010. Small mammal diversity loss in response to late-Pleistocene climatic change. Nature 465:771–774. Borell, A. E., and R. Ellis. 1934. Mammals of the Ruby Mountains region of north-eastern Nevada. Journal of Mammalogy 15:12–44. Bradley, B. A., and E. Fleishman. 2008. Relationships between expanding pinyon–juniper cover and topography in the central Great Basin, Nevada. Journal of Biogeography 35:951–964. Brown, J. H., T. J. Valone, and C. G. Curtin. 1997. Reorganization of an arid ecosystem in response to recent climate change. Proceedings of the National Academy of Sciences USA 94:9729–9733. Burnham, K. P., and D. R. Anderson. 2002. Model selection and multimodel inference: a practical information-theoretic approach. Second edition. Springer, New York, New York, USA. Colwell, R. K. 2005. EstimateS: statistical estimations of species richness and shared species from samples. Version 7.5. hhttp://purl.oclc.org/estimatesi Cottingham, K. L., B. L. Brown, and J. T. Lennon. 2001. Biodiversity may regulate the temporal variability of ecological systems. Ecology Letters 4:72–85. Daly, C., R. P. Neilson, and D. L. Phillips. 1994. A statistical topographic model for mapping climatological precipitation over mountainous terrain. Journal of Applied Meteorology 33:140–158. del Monte-Luna, P., B. W. Brook, M. J. Zetina-Rejon, and V. H. Cruz-Escalona. 2004. The carrying capacity of ecosystems. Global Ecology and Biogeography 13:485–495. Downing, A. L., B. L. Brown, E. M. Perrin, T. H. Keitt, and M. A. Leibold. 2008. Environmental fluctuations induce scale-dependent compensation and increase stability in plankton ecosystems. Ecology 89:3204–3214. Easterling, D. R., G. A. Meehl, C. Parmesan, S. A. Changnon, T. R. Karl, and L. O. Mearns. 2000. Climate extremes: observations, modeling, and impacts. Science 289:2068–2074. Enquist, B. J., E. P. Economo, T. E. Huxman, A. P. Allen, D. D. Ignace, and J. F. Gillooly. 2003. Scaling metabolism from organisms to ecosystems. Nature 423:639–642. Ernest, S. K. M., and J. H. Brown. 2001. Homeostasis and compensation: the role of species and resources in ecosystem stability. Ecology 82:2118–2132. Fournier, F., D. W. Thomas, and T. Garland, Jr., 1999. A test of two hypotheses explaining seasonality of reproduction in temperate mammals. Functional Ecology 13:523–529. Grayson, D. K. 1993. The desert’s past: a natural prehistory of the Great Basin. Smithsonian Institution Press, Washington, D.C., USA.
Ecology, Vol. 92, No. 6
Houlahan, J. E., et al. 2007. Compensatory dynamics are rare in natural ecological communities. Proceedings of the National Academy of Sciences USA 104:3273–3277. Hughes, J. B., and J. Roughgarden. 1998. Aggregate community properties and the strength of species’ interactions. Proceedings of the National Academy of Sciences USA 95:6837–6842. Hughes, L. 2000. Biological consequences of global warming: is the signal already apparent? Trends in Ecology and Evolution 15:56–61. Ives, A. R., and S. R. Carpenter. 2007. Stability and diversity of ecosystems. Science 317:58–62. Ives, A. R., K. Gross, and J. L. Klug. 1999. Stability and variability in competitive communities. Science 268:542–544. Keitt, T. H. 2008. Coherent ecological dynamics induced by large-scale disturbance. Nature 454:331–335. Keitt, T. H., and J. Fischer. 2006. Detection of scale-specific community dynamics using wavelets. Ecology 87:2895–2904. Knapp, P. A. 1996. Cheatgrass (Bromus tectorum L) dominance in the Great Basin Desert–history, persistence, and influences to human activities. Global Environmental Change–Human and Policy Dimensions 6:37–52. Loreau, M. 2010. Linking biodiversity and ecosystems: towards a unifying ecological theory. Philosophical Transactions of the Royal Society B 365:49–60. MacArthur, R. H. 1972. Geographical ecology: patterns in the distribution of species. Harper and Row, New York, New York, USA. McNaughton, S. J. 1977. Diversity and stability of ecological communities: a comment on the role of empiricism in ecology. American Naturalist 111:515–525. Melillo, J. M., A. D. McGuire, D. W. Kicklighter, B. Moore III, C. J. Vorosmarty, and A. L. Schloss. 1993. Global climate change and terrestrial net primary production. Nature 363:234–240. Micheli, F., K. L. Cottingham, J. Bascompte, O. N. Bjornstad, G. L. Eckert, J. M. Fischer, T. H. Keitt, B. E. Kendall, J. L. Klug, and J. A. Rusak. 1999. The dual nature of community variability. Oikos 85:161–169. Miller, R. F., and J. A. Rose. 1999. Fire history and western juniper encroachment in sagebrush steppe. Journal of Range Management 52:550–559. Miller, R. F., and P. E. Wigand. 1994. Holocene changes in semi arid pinyon–juniper woodlands: responses to climate, fire, and human activities in the US Great Basin. BioScience 44:465–474. Mote, P. W., A. F. Hamlet, M. P. Clark, and D. P. Lettenmaier. 2005. Declining mountain snowpack in western North America. American Meteorological Society 86:39–49. Mutshinda, C. M., R. B. O’Hara, and I. P. Woiwood. 2009. What drives community dynamics? Proceedings of the Royal Society B 276:2923–2929. Nagy, K. A., I. A. Girard, and T. K. Brown. 1999. Energetics of free-ranging mammals, reptiles, and birds. Annual Review of Nutrition 19:247–277. Nevada Department of Wildlife. 2009. Nevada Department of Wildlife predation management plan: fiscal year 2010. Nevada Department of Wildlife, Reno, Nevada, USA. Noss, R. E., E. T. LaRoe III, and J. M. Scott. 1995. Endangered ecosystems of the United States: a preliminary assessment of loss and degradation. Biological Report 28. National Biological Service, Washington, D.C., USA. Parmesan, C. 2006. Ecological and evolutionary responses to recent climate change. Annual Review of Ecology, Evolution, and Systematics 37:637–669. Pe˜nuelas, J., et al. 2007. Response of plant species richness and primary productivity in shrublands along a north-south gradient in Europe to seven years of experimental warming and drought: reductions in primary productivity in the heat
June 2011
CLIMATE CHANGE AND RESOURCE DEPLETION
and drought year of 2003. Global Change Biology 13:2563– 2581. Peters, R. H. 1983. The ecological implications of body size. Cambridge University Press, Cambridge, UK. R Core Development Team. 2009. Version 2.9.2. hwww. R-project.orgi Reed, A. W., G. A. Kaufman, and D. W. Kaufman. 2006. Species richness–productivity relationships for small mammals along a desert–grassland continuum: differential responses of functional groups. Journal of Mammalogy 87:777–783. Roemer, G. W., M. E. Gompper, and B. Van Valkenburgh. 2009. The ecological role of the mammalian mesocarnivore. BioScience 59:165–173. Rosenzweig, C., G. Casassa, D. J. Karoly, A. Imeson, C. Liu, A. Menzel, S. Rawlins, T. L. Root, B. Seguin, and P. Tryjanowski. 2007. Assessment of observed changes and responses in natural and managed systems. Pages 79–131 in M. L. Parry, O. F. Canzani, J. P. Palutikof, P. J. van der Linden, and C. E. Hanson, editors. Climate change 2007: impacts, adaptation and vulnerability. Contribution of Working Group II to the Fourth Assessment Report of the Intergovernmental Panel on Climate Change. Cambridge University Press, Cambridge, UK. Rowe, R. J., J. A. Finarelli, and E. A. Rickart. 2010. Range dynamics of small mammals along an elevational gradient over an 80-year interval. Global Change Biology 16:2930– 2943. Savage, V. M., J. F. Gillooly, W. H. Woodruff, G. B. West, A. P. Allen, B. J. Enquist, and J. H. Brown. 2004. The predominance of quarter-power scaling in biology. Functional Ecology 18:257–282. Scheffer, M., S. Carpenter, J. A. Foley, C. Folke, and B. Walker. 2001. Catastrophic shifts in ecosystems. Nature 413:591–596. Smith, M. D., A. K. Knapp, and S. L. Collins. 2009. A framework for assessing ecosystem dynamics in response to chronic resource alterations induced by global change. Ecology 90:3279–3289. SPSS. 2008. Version 17. SPSS, Chicago, Illinois, USA.
1375
Terry, R. C. 2010. The dead do not lie: using skeletal remains for rapid assessment of historical small-mammal community baselines. Proceedings of the Royal Society B 277:1193–1201. Tilman, D. 1982. Resource competition and community structure. Princeton University Press, Princeton, New Jersey, USA. Tilman, D., and J. A. Downing. 1994. Biodiversity and stability in grasslands. Nature 367:363–365. Vasseur, D. A., and J. W. Fox. 2007. Environmental fluctuations can stabilize food web dynamics by increasing synchrony. Ecology Letters 10:1066–1074. Walther, G. R., E. Post, P. Convey, A. Menzel, C. Parmesan, T. J. C. Beebee, J. M. Fromentin, O. Hoegh-Guldberg, and F. Bairlein. 2002. Ecological responses to recent climate change. Nature 416:389–395. Warne, R. W., A. D. Pershall, and B. O. Wolf. 2010. Linking precipitation and C3–C4 plant production to resource dynamics in higher-trophic-level consumers. Ecology 91:1628–1638. Warren, M. S., et al. 2001. Rapid responses of British butterflies to opposing forces of climate and habitat change. Nature 414:65–69. Wasley, T. 2004. Nevada’s mule deer population dynamics: issues and influences. Nevada Department of Wildlife Biological Bulletin. Number 14. Nevada Department of Wildlife, Reno, Nevada, USA. Weisberg, P. J., E. Lingua, and R. B. Pillai. 2007. Spatial patterns of pinyon–juniper woodland expansion in central Nevada. Rangeland Ecology and Management 60:115–124. Weiss, J. L., C. L. Castro, and J. T. Overpeck. 2009. Distinguishing pronounced droughts in the southwestern United States: seasonality and effects of warmer temperatures. Journal of Climate 22:5918–5932. White, E. P., S. K. M. Ernest, and K. M. Thibault. 2004. Tradeoffs in community properties through time in a desert rodent community. American Naturalist 164:670–676. Yang, L. H., J. L. Bastow, K. O. Spence, and A. N. Wright. 2008. What can we learn from resource pulses? Ecology 89:621–634. Young, J. A., and C. D. Clements. 2006. Nevada rangelands. Rangelands 28:10–15.
APPENDIX A Summaries of mass, body length, abundance, and functional group classifications (Ecological Archives E092-114-A1).
APPENDIX B Summary statistics for regression analyses and model selection (Ecological Archives E092-114-A2).
APPENDIX C Graphs of functional group changes over time in biomass and abundance (Ecological Archives E092-114-A3).
APPENDIX D Graphs showing temporal comparison of energy use for functional group members (Ecological Archives E092-114-A4).
APPENDIX E Graphs of species-specific changes over time in energy use (Ecological Archives E092-114-A5).