Conceptual guidelines for the implementation of the ecosystem approach in biodiversity monitoring Melanie Mueller and Juergen Geist† Aquatic Systems Biology Unit, Department of Ecology and Ecosystem Management, Technische Universität München, Mühlenweg 22, D-85350, Freising, Germany Citation: Mueller, M., and J. Geist. 2016. Conceptual guidelines for the implementation of the ecosystem approach in biodiversity monitoring. Ecosphere 7(5):e01305. 10.1002/ecs2.1305
Abstract. The theoretical concept of the ecosystem approach (EA) aims at assessing ecosystem function
based on integrative assessments of multiple levels of biological organization. Since the United Nations Convention on Biological Diversity in 1992, the EA has been increasingly integrated into environmental policy and legislation, but to date, its practical implementation remains vague with a lack of universal guidelines and concrete recommendations for its use across ecosystem boundaries. On the basis of a review of scientific literature, worldwide environmental legislation and existing monitoring approaches, we identified the most important factors which hamper the feasibility of the EA. We propose a generally applicable methodology for implementing the EA in ecological and environmental monitoring across different ecosystems and habitat types. Successful application of the EA largely depends on adequately standardized and synchronized sampling designs for all abiotic and biotic components, appropriate depth of taxonomic identification, and sufficient spatial and temporal replication. The proposed step-by-step guidelines for using the EA are valid across ecosystem types, geographic regions, and for a variety of data types, making them promising tools for ecological monitoring.
Key words: biodiversity; ecosystem change; environment; impact assessment; multiple taxonomic groups; multivariate data integration; restoration. Received 19 October 2015; accepted 12 November 2015. Corresponding Editor: S. L. Collins. Copyright: © 2016 Mueller and Geist. This is an open access article under the terms of the Creative Commons Attribution License, which permits use, distribution and reproduction in any medium, provided the original work is properly cited. † E-mail:
[email protected]
Introduction
Monitoring activities are gaining increasing support and enforcement from politicians and society. Ecological monitoring was originally mainly focused on single taxonomic groups (Cairns and Pratt 1993), but there is growing evidence from different aquatic and terrestrial habitats of low congruency between different indicator groups in their response to environmental change (e.g., European and North American streams and lakes: Allen et al. 1999, Declerck et al. 2005, Heino 2010, Mueller et al. 2011, tropical rain forests in the Amazon basin: Landeiro et al. 2012). Consequently, there is an increasing need for more holistic and integrative concepts of ecological monitoring
Ecosystems can be highly dynamic in space and time, caused by changes in natural factors and human activities. Today, natural ecosystem changes are mostly overlaid by anthropogenic impacts such as transformation of land and sea through the alteration of major biogeochemical cycles and the introduction or removal of species (Lubchenco 1998). An understanding of ecosystem change and its consequences is central for the success of conservation and restoration of ecosystems, especially of the services they provide (Millennium Ecosystem Assessment 2005). v www.esajournals.org
1
May 2016 v Volume 7(5) v Article e01305
MUELLER AND GEIST
(Geist 2011, 2015), including the simultaneous consideration of several indicator groups from different trophic levels (ecosystem approach, EA). However, current monitoring is often limited in terms of sampling designs considering multiple taxonomic groups as well as in the use of integrative methods for data analysis. Consequently, it is difficult to obtain a comprehensive and representative picture of the ecosystem as a whole which is crucial in terms of monitoring environmental change, including the effects of habitat destruction, pollution, or restoration and the associated ecosystem functions and services. Meta-analyses provide a promising tool to circumvent these problems, relying on the deduction of ecosystem level effects from multiple studies, each of which considered single taxonomic groups. However, they are often limited due to unknown data quality and methodological inconsistency as well as publication bias toward studies showing pronounced effects (Stewart 2010, Geist 2015). This study reviews scientific literature, environmental legislation and practical monitoring approaches in the context of the ecosystem approach. While existing literature on this topic is either limited to one specific type of ecosystem (e.g., terrestrial ecosystems in Schmeller et al. 2015) or specific aspects of the EA (e.g., spatial standardization to reduce uncertainty in Magnusson 2014), the objective of this paper is to promote the applicability of the EA by a holistic view on the topic. This spans from the detection of current deficits—by providing a detailed and worldwide review of related legislation, monitoring protocols, and scientific literature—to practical recommendations that may increase the relevance and applicability of the EA. The main objectives were to identify existing deficits in the practical implementation of the ecosystem approach, and to deduce concrete and universally applicable conceptual guidelines considering (1) sampling design and methodology, (2) depth of taxonomic identification, (3) multivariate data integration, and (4) the transferability to different ecosystem types, investigation scales, and data types.
monitoring, impact assessment, and management under the convention on biological diversity (United Nations 1992). In contrast to species-focused conservation strategies, the complex and dynamic nature of ecosystems, including all trophic levels and their interactions among each other, with the nonliving environment and humans is recognized within the framework of the EA (United Nations Environment Programme 1998). Since biological diversity is inextricably linked to ecosystem processes, function, and resilience (United Nations Environment Programme 1998), the EA requires a holistic view of biodiversity that extends from classical species diversity to functional diversity, diversity of ecosystem processes, and habitat diversity. The term EA had been referred to in scientific literature long before its first application in a policy context in 1992. It dates back to an article published in Ecology by Odum (1957), who suggested the study of ecosystems in university ecological field courses. He proposed that students should sample and analyze as many ecosystem components (which can be taxonomic or trophic units) and physicochemical variables as possible. Odum (1957) named this concept “ecosystem approach in teaching ecology”. In the following decades, the EA appeared in publications on environmental toxicology (e.g., Metcalf 1977, Lakshman 1979), before the term was extended to socioeconomic and political dimensions in the 1990s (e.g., Rowe 1992, Spence and Hughes 1996, Sherman and Duda 1999). There are numerous definitions of what EA means (Laffoley et al. 2004). Rowe (1992) considers the idea of EA to “shift the focus from parts to wholes, from the interest to the capital, from trees and other plants, animals, stream flow, esthetics and whatever else the earth’s surface yields to the three dimensional landscape ecosystems and waterscape ecosystems that produce these valuable things”, and establishes an understanding with a strong focus on ecosystem services. Cury et al. (2005) consider the EA in fisheries in a very general way, being an approach that “deals with ecosystems instead of individual stocks”, while De Jonge et al. (2012) specifically include community structure and function as well as environmental variables into their definition of
Definition and History of the Ecosystem Approach The “ecosystem approach” (EA) is the primary framework for all actions in environmental v www.esajournals.org
2
May 2016 v Volume 7(5) v Article e01305
MUELLER AND GEIST
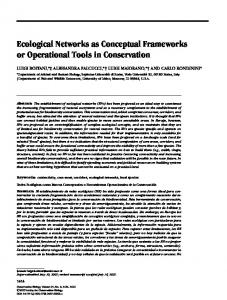
Fig. 1. Multiple dimensions of the ecosystem approach. Nested circles symbolize different ecosystems that interact with each other (figure part modified from United Nations Environment Programme 1998). ES 1 = ecosystem 1, e.g., freshwater ecosystem; ES 2 = ecosystem 2, e.g., alluvial forest; ES 3 = ecosystem 3, e.g., meadow; ES 4 = ecosystem 4, e.g., urban area. All these different ecosystems are situated within a landscape. PP = primary producers; PC = primary consumers; SC = secondary consumers; D = destruents. Arrows symbolize different factors that affect or emerge from ecosystems: Human activities = all human induced alterations of ecosystems which change their structure, function, and composition, e.g., hydropower plants or agricultural land use; Natural factors = physicochemical characteristics resulting from climate (e.g., solar radiation, temperature, rainfall) and geology (e.g., topography, lithology); Ecosystem services = provisioning, regulating, cultural, and supporting services provided by ecosystems. The scale bars on the left, right, and bottom indicate the different biological, geographical, and temporal scales at which the setup in the middle of the figure can be investigated.
EA: “environmental conditions should be assessed on the basis of the structure and functioning of the biological part of the ecosystem in response to the sum of natural variation and human induced stresses”. Beaumont et al. (2007) provide a more management- and conservation-oriented definition of the EA, being a “strategy for the integrated management of land, water and living resources that promotes conservation and sustainable use in an equitable way”. However, all present definitions of the EA are based on a universal understanding of an ecosystem. An ecosystem v www.esajournals.org
comprises different components, representing different trophic levels (Fig. 1), including primary production (e.g., algae, plants), primary consumption (e.g., invertebrates), secondary and higher levels of consumption (e.g., insectivore or carnivore mammals and fishes), as well as destruents (e.g., bacteria) (Campbell et al. 2009). The interaction of different ecosystem components with each other and with natural environmental factors as well as human activities, determines the resulting ecosystem services (Fig. 1). Ecosystems can be analyzed at many different geographical, biological, and 3
May 2016 v Volume 7(5) v Article e01305
MUELLER AND GEIST
temporal scales which are hierarchically structured and can be nested into each other (Fig. 1). For instance, the investigation of ecosystem components can be conducted for a single ecosystem, from a wide range of ecosystem types (e.g., terrestrial, marine, and freshwater biomes), as well as at different geographical scales (e.g., local, regional, national, continental, and global), biological complexity (e.g., genes, individuals, populations, species, and communities of each trophic level) and temporal scales (e.g., months, years, and decades), and also for multiple ecosystems situated in an entire landscape (Fig. 1). Consequently, monitoring based on the principle of the EA also should be conducted on multiple scales. The minimum requirement to meet the EA in monitoring is to cover components from all trophic levels of a single ecosystem at the local scale. Several decades after defining the EA and integrating it into the Convention on Biological Diversity (CBD) objectives, the question is no more whether the EA is required (Cury et al. 2005), but how to implement this complex concept. This still constitutes a key challenge in ecological research and management, even at the minimum level of single ecosystems (De Bello et al. 2010). Research into more integrative solutions to ecology and biodiversity conservation is now frequently postulated by scientists, and biodiversity conservation managers, and is increasingly enforced through legislation (Leslie and McLeod 2007, Levin et al. 2009, Geist 2011, Irschick et al. 2013, Pander and Geist 2013).
for peer-reviewed literature were performed in “ISI Web of Knowledge” and “Google Scholar” in January 2015. The first 200 results for each search term per search engine were analyzed, excluding review papers that only analyzed already published studies on multiple taxonomic groups to avoid duplication. If several publications from the same authors on the same data sets were found, only the chronologically first publication was considered. The search resulted in a total number of 173 studies that were considered for the analyses presented in Fig. 2. A complete list of these studies is supplied in supplemental material (Appendix S1). In addition to the search for scientific studies, worldwide environmental legislation and monitoring protocols available in English (including all European, Asian, North American, Australian, and African protocols) or Spanish (including South American protocols) were also screened for EA, performing searches in “Google” as well as the websites of environmental authorities in January 2015. The search resulted in a total of 25 environmental policies from seven continents (Table 1), as well as in 13 monitoring protocols from five continents (Table 2). Scientific studies were analyzed concerning the year of publication, the ecosystem type (marine, freshwater, or terrestrial), continent, purpose of study, and method of data integration. Environmental policies were analyzed according to the ecosystem type as well as the type of monitoring or impact assessment. Monitoring protocols were analyzed concerning the related environmental policy, ecosystem type, considered ecosystem components and number of taxonomic groups, sampling design (before-after-control-impact, reference condition approach) and analyses methods (multivariate or univariate statistics, multimetric single score indices, data integration methods).
Methods In a first step, we screened existing information in the context of the EA with the objective of identifying current limitations in its applicability, which is essential in deducing recommendations. Different sources of information were considered in assessing the application of the ecosystem approach in science, environmental legislation, and monitoring. We undertook web searches using the terms “ecosystem approach”, “monitoring different taxonomic groups”, “monitoring multiple taxonomic groups”, “monitoring several taxonomic groups”, “effects different taxonomic groups”, “effects multiple taxonomic groups”, and “effects several taxonomic groups”. Searches v www.esajournals.org
International Environmental Legislation and the Ecosystem Approach Legal implementation of the objectives of the CBD has been achieved on various international levels. The main focus of legislative action consists of environmental protection in general as well as laws protecting aquatic resources (Table 1). However, only few of these legal regulations (water laws in Europe, Argentina, 4
May 2016 v Volume 7(5) v Article e01305
MUELLER AND GEIST
2014 2013 2012 Ecosystem type
2011
10%
10%
2010 2009
43% 37%
2008 2007
Continent
2006
Year of publication
Terrestrial Freshwater Marine Multiple
4% 3% 7% 7%
2005 2004
30%
2003
49%
2002 2001
Africa Asia Australia Europe North America South America
Purpose of study
2000
2%
1999
15%
1998
Basic ecology 31%
46%
1997
6%
Ecotoxicology Impact assessment/monitoring Development of indicators / Monitoring approaches Ecological modelling
1996 1995
Data integration 8% 2%
1994 1993 Convention on Biological Diversity
17% 2%
71%
None Multimetric Univariate Multivariate Modelling
1949 0
2
4
6
8
10
20
40
60
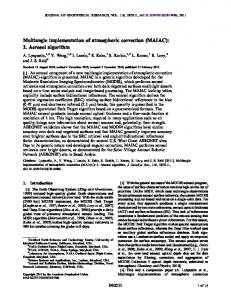
Number of scientific studies Fig. 2. Literature review of ecological studies including multiple taxonomic groups. Left part: Barplot indicating the number of scientific studies considering more than one taxonomic group per year. Right part: pie charts indicating the percentage of all reviewed studies (total: 82 studies) from different ecosystem types and continents, as well as with different overall study purpose and data integration methods.
and Namibia) directly refer to the EA in terms of declaring the integration of several biological, physical, and chemical ecosystem components into environmental monitoring mandatory (Table 1). The European Water Framework Directive (WFD, European Parliament 2000) v www.esajournals.org
most specifically regulates the monitoring of aquatic ecosystems by clearly defining the chemical, physical, and biological quality elements, the way of presenting the results and a time frame for surveillance monitoring in Annex V (European Parliament 2000), though 5
May 2016 v Volume 7(5) v Article e01305
MUELLER AND GEIST Table 1. Examples of worldwide environmental legislation considering ecological monitoring and impact assessment. PU = political unit; Environ. Law = environmental law; ES Type = ecosystem type. EA indicates reference to the ecosystem approach: + = explicit reference to defined ecosystem components; ± = mentioning of ecosystem components in general; − = no reference to the EA. EIA = environmental impact assessment. EU = European Union; USA = United States of America; CDN = Canada; AUS = Australia; ZA = South Africa; NAM = Namibia; KEN = Kenya; KOR = Korea; IND = India; CHN = China; RU = Russia; AR = Argentina; CHI = Chile; PAN = Panama. Note that only those environmental policies were considered that are available in English or Spanish language on the web. Continent
PU
Environ. Law
ES Type
EA
Monitoring
Europe
EU
Habitats Directive (HD, European Parliament 1992)
Multiple
±
Surveillance monitoring
Europe
EU
Water Framework Directive (WFD, European Parliament 2000)
Aquatic
+
Physical, chemical, and biological components
North America
USA
±
North America
USA
North America
CDN
Environmental Policy Act (EA, 91st Multiple United States Congress 1970) Clean Water Act (CWA, 92nd United Aquatic States Congress 1972) Environmental Protection Act (EPA, Multiple Government of Canada 2000)
Surveillance monitoring Surveillance monitoring Environmental quality monitoring
Australia
AUS
Australia
AUS
Africa
ZA
Africa
ZA
Africa
ZA
Africa
NAM
Africa
NAM
Africa
KEN
Asia
KOR
Asia
KOR
Asia
IND
Asia
CHN
Asia
CHN
− ±
Regulated in European Parliament (2011) Adapted monitoring in case of bad condition Expert estimation Not specified Expert estimation, monitoring Expert estimation
Multiple
+
Aquatic
±
Multiple
−
Aquatic
±
Terrestrial
±
Environmental Management Act (EMA, Republic of Namibia 2007)
Multiple
+
Water Resources Management Act (WRMA, Republic of Namibia 2004) Environmental Management Act (EMCA, Parliament of Kenya 1999) Natural Environmental Conservation Act (NECA, Republic of Korea 1997b) Water Quality and Ecosystem Conservation Act (WQECA, Republic of Korea 1997c)
Aquatic
+
Multiple
−
Multiple
±
Not specified
Aquatic
−
Multiple
+
Multiple
−
Aquatic
−
Water pollution, water quality, aquatic ecosystems quality Areas rich in Expert biological resources estimation Establishment of Expert monitoring system estimation Dynamic monitoring Comprehensive of water resources scientific survey
Environmental Protection and Biodiversity Conservation Act (EPBCA, Australian Government 1999) Water Act (WA, Australian Government 2007) Environmental Conservation Act (ECA, Republic of South Africa 1989) Water Act (WA, Republic of South Africa 1998b) Forest Act (FA, Republic of South Africa 1998a)
Biological Diversity Act (BDA, Parliament of India 2003) Environmental Protection Law (EPL, Republic of China 1989) Water Law (WL, Republic of China 1988)
v www.esajournals.org
6
Voluntary and scientific monitoring, financial support Quality and quantity of water resources Not specified
EIA
Quality and quantity of water resources Multiple components, including biodiversity Functional integrity and biodiversity Physical, chemical, and biological components Environmental changes
Expert estimation Expert estimation Expert estimation Expert estimation Literature research, field work, monitoring Expert estimation Environmental audit Regulated in Republic of Korea (1997a) Regulated in Republic of Korea (1997a)
May 2016 v Volume 7(5) v Article e01305
MUELLER AND GEIST Table 1. Continued. ES Type
EA
Eurasia
Continent
RU
PU
Law on Environmental Protection (LEP, Russian Federation 2002)
Environ. Law
Multiple
+
Eurasia
RU
Forest Code (FC, Russian Federation 1997)
Terrestrial
±
Eurasia
RU
Water Code (WC, Russian Federation 2006)
Aquatic
−
South America
AR
Law on National Environmental Policy (LGA, Republica de Argentina 2002a)
Multiple
±
South America
AR
+
South America
CHI
Aquatic Law on the Use of Public Waters (RGA, Republica de Argentina 2002b) Environmental Law (LMBA, Multiple Congreso Nacional de Chile 2010)
South America
PAN
General Environmental Law (LGA, Republica de Panama 1998)
+
Multiple
Qualitative and quantitative indicators of waterbody state Scientific investigations in the field of biodiversity conservation Physical, chemical, and biological components Not specified Environmental quality, support of scientific studies
EIA Not specified
Conservation measures as compensation Efficiency control for implemented measures Expert estimation Expert estimation Expert estimation, monitoring Regulated in Republica de Panama (2009)
concepts that are adaptable to these regions is essential.
not directly referring to the EA (Vlachopoulou et al. 2014). In contrast, details on data collection and analysis methods remain unclear. The development and the implementation of a monitoring strategy are left to the member states (Scheuer 2006), with no centralized system of data storage and accessibility (Geist 2014). In general, reference to EA within the framework of most national and international environmental legislation is limited to indirect regulations, for example, legal achievements such as the protection of the ecosystem with all its components without further specification of implementation, monitoring or enforcement regulations. This lack of precise implementation strategies in environmental legislation leads, especially in countries where access to scientific knowledge and technology is limited, to weak enforcement and implementation of the EA on the federal level (Alshuwaikhat 2005, Sands and Peel 2012). However, the increasing number of international legal regulations creates an urgent need for ecosystem-based environmental monitoring throughout the world. To improve precision and enforcement of environmental legislation particularly in developing countries, research in the field of standardized monitoring v www.esajournals.org
±
Monitoring Environmental condition in areas with man made effects Observations, assessments and forecasts
Current Implementation of the Ecosystem Approach in Science and Monitoring Practice The review revealed a strong increase in the number of studies considering multiple ecosystem components over time, especially during the last few years (Fig. 2). The majority of the studies reviewed (88%) clearly support a “shopping basket approach” to ecosystem monitoring, that is, the use of a suite of taxa instead of single indicators (Pullin 2002). According to a review by Siqueira et al. (2015), the main research focus in ecological studies is on terrestrial ecosystems. Specifically looking at scientific studies and monitoring protocols that include multiple taxonomic groups, we found ecological research and applied monitoring to be equally distributed in aquatic and terrestrial ecosystems, with most of the aquatic studies addressing freshwater habitats (Fig. 2). Considering continents, multigroup research and monitoring is mostly carried out in Europe and North America, whereas implementations in other parts of the 7
May 2016 v Volume 7(5) v Article e01305
MUELLER AND GEIST Table 2. Examples of environmental monitoring systems. REL = respective environmental law (abbreviations from Table 1). ES Type = Ecosystem type: T = terrestrial; FW = freshwater; M = marine. Monitoring comp. = Monitoring components: SE = socioeconomic factors; PP = primary producers; PC = primary consumers; SC = secondary consumers and higher trophic levels; D = destruents; EV = environmental variables. TG = Number of taxonomic groups. AT = Analysis Type: UV = univariate statistics; MV = multivariate statistics; SA = statistics in general; MM = multimetric; d = descriptive. DI = method of data integration: SSI = single score index; SRP = sunray plots. RF = type of reference: RC = reference condition; BACI = before after control impact design; nsp. = not specified. Continent
PU
Europe
GER
Europe
GER
North USA America North CAN America
North CAN America North CAN America
Australia
AUS
Australia
AUS
Africa
ZA
ES Type
Monitoring Protocol Natura 2000 Monitoring (Sachtleben 2010) PHYLIB (Schaumburg et al. 2007), PERLODES (Meier et al. 2006), FiBS (Diekmann et al. 2005) Rapid Bioassessment Protocols (Barbour et al. 1999) Marine and Estuarine Biodiversity Monitoring Protocols (Environment Canada 1997) Field Manual Wadable Streams (Environment Canada 2012) Framework for Monitoring Biodiversity Change (Roberts- Pichette 1995) Methods for Ecological Monitoring of Coral Reefs (Hills and Wilkinson 2004) AUSRIVAS (Nichols et al. 2000)
River Health Programme (Dallas et al. 2008) Africa NAM, BIOTA Africa ZA (Jürgens et al. 2012) Asia KOR Aquatic Ecological Monitoring Program (Lee et al. 2011) Asia IND CLEAN India (http:// www.cleanindia. org) South AR Monitoreo Ambiental America Rural (Zaccagnini et al. 2007)
REL HD
T x
Monitoring comp.
FW M x
SE
x
PP
PC SC
D
EV TG
AT
DI
RF
x
x
x
x
6 d
-
nsp. RC
WFD
x
x
x
x
x
4 MM
SSI
CWA
x
x
x
x
x
4 MM
SRP RC
x
x
x
x
x
x
x
x
EPA
x
EPA
EPA
BACI
x
1 nsp.
RC
x
x
7 MM, - MV
nsp.
x
x
x
3 SA
-
BACI
x
x
x
1 MV
-
RC
x
x
x
x
4 MM, SSI MV
RC
x
x
x
x
7 SA
-
nsp.
x
x
x
x
3 MM
-
RC
x
2 d
-
nsp.
x
10 nsp.
nsp. nsp.
x
x
x
AUS- EPBCA, AUS- WA x
AUS- EPBCA, AUS- WA ZA-WA ECA, EMA
5 UV, - MV
x x
WQECA
x x
BDA
x
x
x
x
x
x
LGA, RGA
x
x
x
x
x
x
v www.esajournals.org
8
x
-
May 2016 v Volume 7(5) v Article e01305
MUELLER AND GEIST
world are scarce (Fig. 2 and Table 2). A large percentage of the scientific literature on ecosystem-scale assessments addresses basic ecological questions (Fig. 2), such as community congruency (e.g., Allen et al. 1999, Ficetola et al. 2007, Mykrä et al. 2008, Larsen et al. 2012, Padial et al. 2012) and biodiversity research (e.g., Niemelä and Baur 1998, Fabricius et al. 2003, Bailey et al. 2007). However, since 2013, there is also a stronger focus on environmental monitoring considering biological responses to ocean acidification (Harvey et al. 2013, Kroeker et al. 2013), change in land use (Birkhofer et al. 2014, Johnson and Angeler 2014, Luescher et al. 2014), and the introduction of neobiota (Jackson and Grey 2013, Kumschick and Richardson 2013, Galiana et al. 2014). Although primary producers, primary consumers, and higher trophic levels are well represented, micro- and meiobiota (e.g., bacteria, archaea, fungi, protozoa) are largely excluded from ecosystem-based studies and monitoring protocols (Thompson et al. 2012, see also Fig. 2 and Table 2). However, they play a key role in decomposition and thus link trophic levels (Townsend et al. 2009). While standardized data collection methods are available and used for most disciplines (e.g., electrofishing or net fishing: freshwater fish [EN 14962], Braun- Blanquet (1932); plant coverage estimation method: terrestrial vegetation, pitfall traps: terrestrial vertebrates), there are typically no standards used for the study design (i.e., selection of included ecosystem components, spatial and temporal replication) and the integration of data from different ecosystem components (Dabrowski et al. 2011). Consequently, data are typically analyzed and presented separately for each taxonomic group both in science as well as in applied monitoring, using a range of different methods, including descriptive methods, univariate statistics, modeling approaches, and multivariate statistics (Fig. 2, Table 2). Even in cases such as the European Water Framework Directive, which requires an integration of different biological and physicochemical quality elements (e.g., Geist 2014), samples for different taxonomic groups are not taken at the same sites at the same time, questioning the validity of data integration. General assessment results are mostly realized by the calculation of single score indices (e.g., Crosswhite et al. 1999, Maes v www.esajournals.org
and Dyck 2005, Lougheed et al. 2007, Schouten et al. 2009), bearing the risk of losing information content inherent in the multiple dimensions (i.e., large number of response variables) of ecosystem level data (Caroni et al. 2013, Dahm et al. 2013). To date, only few authors apply multivariate ordination methods (Canonical Correspondence Analysis, CCA; NMDS) integrating data from different taxonomic groups (Thompson and Townsend 2000, Guerra-García et al. 2006, Martínez-Crego et al. 2010, Mueller et al. 2011, 2014a). Meta-analyses are a recently emerging method of data integration in which the results of single studies on different ecosystem components can be combined (e.g., Kroeker et al. 2013, Slatyer et al. 2013, Deikumah et al. 2014, Stevens et al. 2014, Tuck et al. 2014), potentially ignoring differences in temporal and spatial resolution, sampling techniques as well as data processing. To the best of our knowledge, the only common data integration method practiced in applied monitoring is the simplification of the complex data to a single score multimetric index (e.g., European WFD Monitoring, South African River Health Programme, Table 2). Most monitoring protocols leave data analysis up to the user, resulting in scarce statistical validation of the results (less than half of the monitoring protocols reviewed, Table 2) and low comparability between studies. Monitoring approaches in general are highly specific to certain geographic regions, since they strongly rely on reference conditions and the occurrence of certain indicator taxa for index calculation. This also limits the transferability of monitoring approaches between ecosystem types and geographic regions, and the comparability of their results. However, an examination across ecosystems and geographic regions would be essential for the sustainable management of biodiversity at the global level.
Conceptual Monitoring Strategies Based on the Theoretical Principle of the EA Comprehensive ecosystem studies that consider multiple dimensions of variation (multiple taxonomic groups, temporal, and spatial resolution) are very time and cost intensive. The importance of including adequate numbers of spatial and temporal replicates in environmental monitoring is often underestimated (Pander and Geist 2013), 9
May 2016 v Volume 7(5) v Article e01305
MUELLER AND GEIST
often hampering statistical validation of the results. As a consequence, ecosystem-based management decisions are currently often hampered by oversimplification (Caroni et al. 2013, Geist 2015) and a lack of estimation of uncertainty. To improve ecosystem management and conservation, a conceptual standard for the selection of ecosystem components and the analysis of the resulting data that is applicable across ecosystems is needed. In this context, the establishment of a methodological framework for coupling and integratively analyzing abiotic data and biological community data eliminating the shortcomings of the recent index-based approaches is crucial (Lindenmayer and Likens 2010, De Jonge et al. 2012). This methodological framework for ecosystem monitoring should ideally consider ecological relevance, statistical credibility, cost- effectiveness, and transferability to other systems, which are considered as the most important criteria for successful ecological monitoring programs (Caughlan and Oakley 2001).
Selection of ecosystem components
Over the past decades, monitoring of biodiversity has mainly focused on species richness of certain, intensively studied biotic groups (e.g., birds, butterflies, stream macroinvertebrates) and systematically neglected and oversimplified the complexity of ecosystems as well as functional interactions between different components (De Leo and Levin 1997, Fischer et al. 2004). A global harmonized biodiversity observation system with common “Essential Biodiversity Variables” (EBVs) has not yet been established (Pereira et al. 2013). Some authors see this as the main reason for the failure of appropriate monitoring in the context of biodiversity conservation targets (Sachs et al. 2009, Rands et al. 2010, Pereira et al. 2013). A monitoring program following the theoretical principle of the EA should address the variety of possible reactions of different taxonomic groups found by other authors (e.g., Niemelä and Baur 1998, Maes and Dyck 2005, Larsen et al. 2012) and the strong interactions among trophic levels (Campbell et al. 2009). To achieve this, the selected set of ecosystem components should include at least one representative community per trophic level and habitat type. In aquatic and terrestrial habitats these could be algae or v www.esajournals.org
10
vascular plants for primary producers, invertebrates for primary consumers, vertebrates for secondary consumers, and bacteria for destruents. At a level of finer resolution, integration of different life stages can also become important, particularly if the case of presence–absence data or abundance data is not representative of the status of community components.
Sampling design and methodology
A standardized spatial and temporal sampling design is crucial to align data from different taxonomic groups of a common spatial area and time frame (Magnusson 2013, 2014, Pereira et al. 2013, Schmeller et al. 2015). The problem is that field sampling methods for different taxonomic groups and physicochemical characteristics typically differ in terms of the spatial scale of the sampling area. Secondary consumers, which include large and mobile species, are mostly assessed based on an area covering several m2 due to their larger home ranges. In contrast, primary consumers, primary producers, or destruents (e.g., soil bacteria) occur at scales from one m2, down to mm2. A possible solution for this problem is to apply a nested stratified-randomized sampling design. The sampling area of larger taxa is covered by a collective sample of smaller taxa (Fig. 3), which can ideally be integrated into a “before after control impact” (BACI) design (Underwood 1992). In this context, the most crucial step is to determine the spatial and temporal replicates necessary to representatively cover all habitat types and seasonal conditions of the investigated ecosystem, and take into account autocorrelation (e.g., using geostatistical methods, Braun et al. 2012). The spatial extent of the lowest common sampling unit should ideally be based on the scales at which management decisions will be made (Fig. 3). To maintain statistical power, large numbers of replicates, allowing for spatial allocation to specific habitat structures, are needed. Thus, covering the area of interest with a larger number of spatial and temporal replicates in a stratified-randomized way is advantageous compared to relying on one large sample for each discipline (Schmeller et al. 2015). In the context of ecosystem services, ecosystem productivity is a very important aspect in the evaluation of ecosystem changes May 2016 v Volume 7(5) v Article e01305
MUELLER AND GEIST
Fig. 3. Schematic of a nested stratified-randomized sampling design considering multiple ecosystem components.
(Bevilacqua et al. 2012, Mueller et al. 2013) as well as the R-based tool “BestAgg” (Bevilacqua et al. 2013), allow for an easy determination of the most appropriate aggregation level based on the average taxonomic breadth of a species list in previously untested habitats or taxonomic groups. Nevertheless, scientists should still pay attention to species-level identification when it comes to studies into the effects of subtle environmental gradients. Furthermore, functional characteristics can often only be assigned at fine taxonomic resolution, and the consideration of specific target species also makes species identification essential.
(Thorp and Delong 1994). Therefore, defined sampling units should be assigned for each taxonomic group, for example, standardized sampling time, area, transect length, volume, or mass that allow the calculation of catch per unit effort (CPUE, Gulland 1964). Furthermore, it is necessary that the sampling of different ecosystem components at a site is conducted simultaneously.
Depth of taxonomic identification
The inclusion of multiple taxonomic groups in ecosystem assessments generally involves a considerable amount of laboratory work for taxonomic identification. Especially for difficult taxonomical groups, such as algae and some invertebrate groups (e.g., chironomids, terrestrial beetles). This can strongly increase monitoring cost and error rates (Haase et al. 2010). Testing the applicability of coarser taxonomic levels as surrogates for species-level data is highly effective in reducing effort and monitoring costs in terrestrial, freshwater, and marine ecosystems (Pik et al. 1999, Bevilacqua et al. 2012, Mueller et al. 2013, Timms et al. 2013). Moreover, consideration of several taxonomic groups at coarse taxonomic resolution tends to be more effective for the analysis of ecological change than analyses of single groups at a fine level of taxonomic resolution (Mueller et al. 2013). Statistical threshold levels for the applicability of coarse taxonomic resolution seem to be dependent on the taxonomic group rather than on the type of ecosystem (Bevilacqua et al. 2012, 2013, Mueller et al. 2013). Calibration lines v www.esajournals.org
Data integration and analysis
The integration of data gained by different methods and techniques is subject to several constraints. First, the sampling of multiple taxonomic groups produces large, multidimensional data sets with each species constituting one dimension. The reduction in multiple data dimensions to one single dimension, for example, through the calculation of single score indices, can severely reduce precision and sensitivity (Norris 1995, Caroni et al. 2013, Dahm et al. 2013, Mueller et al. 2014a). Data integration methods should therefore allow multivariate analyses of the overall data set to conserve the multiple dimensions of ecosystem components and avoid the leveling out of opposite responses of different taxonomic groups (Reynoldson et al. 1997, Mueller et al. 2014a,b). Discipline-specific differences in quantity (e.g., full quantitative data, relative abundance or presence–absence 11
May 2016 v Volume 7(5) v Article e01305
MUELLER AND GEIST
Fig. 4. Guideline for the multivariate integration of data from different taxonomic groups and ecosystems. ES1-3 = different ecosystems, compare Fig. 1. Ecosystem components: PP = primary producers, PC=primary consumers, SC = secondary consumers, D = destruents. Samples = single replicates for different treatments at highest common spatial and temporal sampling resolution for all taxonomic groups and ecosystems. Abundance data = individual counts for each taxonomic group. Similarity values=any measure of similarity that is appropriate for the used data type. Covariables = parameters that are associated with changes in community composition (normalized values; e.g., HI: physicochemical habitat characteristics, FI: functional traits, TSP: target species and life stage-specific variables or SEI: socioeconomic values). (a), (b), and (c) show different possibilities of data presentation, adaptable to the purpose of the study and the end user: (a) comprehensive scientific presentation of overall community composition as ordination plot (e.g., NMDS). Covariables are correlated onto the ordination plot and displayed as vectors of different size and direction, indicating the strength of the correlation and the direction of gradient, (b) sunray plots including selected criteria of special management interest, (c) barplots including selected criteria of special management interest. Different shades of gray indicate different sampling periods or treatments.
data) and numerical magnitude (i.e., natural differences in numbers of individuals of different groups) should be accounted for prior to data integration, without losing important information on differences in productivity between habitats as caused by the calculation of relative abundance. Mueller et al. (2014b) proposed a multivariate data integration method, which is based on the normalization of the entire abundance data matrix of each studied group. This procedure can be universally applied to different taxonomic v www.esajournals.org
groups from various ecosystem types. It ensures an equal contribution of each taxonomic group to the overall results, but at the same time conserves information on productivity. In Fig. 4, we propose a step-by-step guideline for data integration. Essential prerequisites for following this guideline include the identification of a common spatial sampling unit for all components to be included beforehand. This common spatial unit can be applied to different treatments, such as impacted and unimpacted parts of the studied system, and constitutes the “samples” in Fig. 4. The basis for data 12
May 2016 v Volume 7(5) v Article e01305
MUELLER AND GEIST
integration and subsequent multivariate analyses are separate matrices containing abundance data for each investigated abiotic and biotic ecosystem component which can be extracted from different, discipline-specific data bases. In this context, the taxa can either be species or any other level of taxonomic resolution which applies to the group- specific statistical reliability and the purpose of the study. After a normalization step (Mueller et al. 2014b), individual abundance data matrices can be combined to one overall matrix in a spreadsheet such as Microsoft Excel. This matrix can be further used in common multivariate community analyses (e.g., nonmetric multidimensional scaling, analysis of similarities, permutational multivariate analysis of variance, biota-environmental matching). This provides a statistically verifiable, diagnostic assessment of the quantity and gradient directions of effects independent of conjectural expert judgment and coarse categories of impact (Baird and Hajibabaei 2012). Despite the high complexity inherent to comprehensive ecosystem investigations and multivariate ordination plots, the most management relevant variables can be selected according to the case-specific conservation targets, and presented in a way that is easily accessible for conservation practitioners (e.g., barplots, sunray plots accompanied by the results of statistical analyses, Fig. 4). In addition to the integrative plots indicating overall ecosystem change, equivalent plots can be produced for single taxonomic groups to provide information on complementarity which is often required in systematic conservation biology (Magnusson 2014).
Transferability to different data types
In general, multivariate community analysis methods depend on some kind of nomenclature for the single elements of the community under study. However, it is not essential for the names to follow Linnean taxonomy. The names of the taxa in the abundance data matrices can be substituted by operational taxonomic units or numbers that individually mark and distinguish each taxon. Accordingly, also measures of functional processes, gene activity, or metabolites can be considered. The covariables included can be extended from traditional measurements of physicochemical habitat characteristics to target species and life stage-specific factors, v www.esajournals.org
functional traits, ecosystem processes, or socioeconomic measures of ecosystem services. Furthermore, the number of variables and covariables included is not restricted as long as the available statistical software can handle the size of the data set. This is of particular relevance for the future integration of data gained from modern approaches in the field of molecular biology, such as the currently arising environmental DNA (eDNA) metabarcoding (Ficetola et al. 2008) or nontargeted metabolomics (Suhre and Schmitt-Kopplin 2008). Often, scientists in these fields use similar data analysis methods as those applied in taxonomy-based community ecology (e.g., Nylund et al. 2011, Gonzalez and Knight 2012, Lefévre et al. 2013, Rocha et al. 2013), but currently information from traditional and molecular approaches are hardly combined in ecosystem studies. Applying the universally applicable “normalizing” procedure for multivariate data integration provided in Mueller et al. (2014b), classical community data and information gained from molecular approaches can be normalized independently of data structure and analyzed integratively in future ecosystem assessments. In any case, access to original data (e.g., NCEAS, DATA ONE) has become a key requirement for publication of results to ensure the possibility of quality control. In general, the publication of monitoring results and data is considered to be essential for the success of conservation and restoration (Geist 2015), as well as for the applicability of the EA on a meta-level. However, for practical reasons giant data bases including data from all disciplines are not desirable. Scientists should rather consider the opportunity to extract abundance matrices suitable for data integration at the stage of data base design and upload their data bases in public data repositories. Given the high number of international standardization efforts, it would also be desirable to consider minimum standards for data integration from multiple taxonomic groups and sampling, for example, based on a similar number of replicates and the choice of the same sampling sites.
Transferability across ecosystems and geographic regions
Since ecological community data are usually structured similarly throughout ecosystem types
13
May 2016 v Volume 7(5) v Article e01305
MUELLER AND GEIST
(taxa × sites matrices), the presented methods for data combination can be universally applied to integratively assess community change in multiple taxonomic groups from all types of habitats. The matrix normalization allows the integration of an unlimited and flexible number of taxonomic groups (as long as there is a minimum common sampling resolution) that can simultaneously comprise different ecosystems or habitats, such as a stream system and the surrounding alluvial forests and wetlands, or the entire catchment landscape (Fig. 1). The multivariate consideration of taxa abundance data based on the similarity measure for all ecosystem types allows the comparative quantification of effect size across ecosystems (e.g., comparison of the effect size of floodplain restoration measures on the alluvial forest and aquatic habitats) and geographic regions. Furthermore, this approach is independent of minimum abundances of certain indicator taxa and can also include neobiota, which can both be critical constraints that limit the applicability of traditional monitoring approaches in heavily altered ecosystems (e.g., weir-influenced river sections, Mueller et al. 2011, Arndt et al. 2009, Mueller et al. 2014a) and their transferability to other geographic regions. Unfortunately, systematic scientific evidence supporting taxonomic sufficiency methods in other ecosystems is still restricted to single taxonomic groups (marine macroinverteberates, terrestrial invertebrates), making the application of the ecosystem approach very costly in terms of labor (Bevilacqua et al. 2009). The applicability to a broad range of data types, together with the high transferability between ecosystem types and geographic regions makes the new data integration and analysis approach presented herein a highly flexible and promising tool for the future development of ecological monitoring.
databases. Implementation of the ecosystem approach in biodiversity monitoring ultimately depends on the representative integration of all trophic levels and taxonomic groups. In particular, data on micro- and meiobiota should be better considered. As a general rule for data acquisition, greater emphasis should be placed on trophic and taxonomic representation than on resolution of taxonomic detail within specific functional groups and species. Moreover, placing stronger emphasis on a larger number of spatial and temporal replicates that remain the same for different ecosystem components is essential, yet often not considered in classical monitoring programs. A greater degree of standardization of sampling designs, data analyses and data storage, for example, through international standardization bodies and committees, is a prerequisite for improving the usefulness of this approach in meta-analyses.
Acknowledgments We acknowledge support to M.M. by the TUM Graduate School and a doctoral scholarship of UniBayern e.V.
Literature Cited Allen, A. P., et al. 1999. Concordance of taxonomic richness patterns across multiple assemblages in lakes of the northeastern United States. Canadian Journal of Fisheries and Aquatic Sciences 56:739–747. Alshuwaikhat, H. M. 2005. Strategic environmental assessment can help solve environmental impact assessment failures in developing countries. Environmental Impact Assessment Review 25:307–317. Arndt, E., S. Fiedler, and D. Böhme. 2009. Effects of invasive benthic macroinvertebrates on assessment methods of the EU Water Frame Work Directive. Hydrobiologia 635:309–320. Australian Government. 1999. Environment Protection and Biodiversity Conservation Act 1999. http:// www.comlaw.gov.au/Details/C2013C00539 Australian Government. 2007. Water Act 2007. http:// www.comlaw.gov.au/Details/C2013C00163 Bailey, D., R. Billeter, S. Aviron, O. Schweiger, and F. Herzog. 2007. The influence of thematic resolution on metric selection for biodiversity monitoring in agricultural landscapes. Landscape Ecology 22:461–473. Baird, D. J., and M. Hajibabaei. 2012. Biomonitoring 2.0: a new paradigm in ecosystem assessment
Conclusions In conclusion, there is no doubt about the usefulness of the EA in ecological monitoring that aims at holistic assessments of ecosystem changes. Currently, applicability of the EA is mostly hampered by deficits in standardized sampling designs, and a lack of transdisciplinary collaboration that could result in common v www.esajournals.org
14
May 2016 v Volume 7(5) v Article e01305
MUELLER AND GEIST Amphibians in Upland Forests of the Ouachita Mountains. Proceedings of the Oklahoma Academy of Sciences 79:45–50. Cury, P. M., C. Mullon, S. M. Garcia, and L. J. Shannon. 2005. Viability theory for an ecosystem approach to fisheries. ICES Journal of Marine Science: Journal du Conseil 62:577–584. Dabrowski, T., J. Mc Govern, and M. Hartnett. 2011. Modelling and monitoring towards ecologically good status. Proceedings of the ICE - Water Management 164:421–431. Dahm, V., D. Hering, D. Nemitz, W. Graf, A. Schmidt-Kloiber, P. Leitner, A. Melcher, and C. K. Feld. 2013. Effects of physico-chemistry, land use and hydromorphology on three riverine organism groups: a comparative analysis with monitoring data from Germany and Austria. Hydrobiologia 704:389–415. Dallas, H., C. Dickens, L. Hill, N. Kleynhans, D. Louw, J. Taylor, and C. Thirion. 2008. National Aquatic Ecosystem Health Monitoring Programme (NAEHMP): River Health Programme (RHP) Implementation Manual. Department of Water Affairs and Forestry, Pretoria, South Africa. De Bello, F., et al. 2010. Towards an assessment of multiple ecosystem processes and services via functional traits. Biodiversity and Conservation 19:2873–2893. De Jonge, V. N., R. Pinto, and R. K. Turner. 2012. Integrating ecological, economic and social aspects to generate useful management information under the EU Directives ecosystem approach. Ocean and Coastal Management 68:169–188. De Leo, G. A., and S. Levin. 1997. The multifaceted aspects of ecosystem integrity. Conservation Ecology 1:3. Declerck, S., et al. 2005. Multi-group biodiversity in shallow lakes along gradients of phosphorus and water plant cover. Ecology 86:1905–1915. Deikumah, J. P., C. A. Mcalpine, and M. Maron. 2014. Biogeographical and Taxonomic Biases in Tropical Forest Fragmentation Research. Conservation Biology 28:1522–1531. Diekmann, M., U. Dußling, and R. Berg. 2005. Handbuch Zum Fischbasierten Bewertungssystem Für Fließgewässer (FiBS). Fischereiforschungsstelle Baden-Württemberg, Langenargen, Germany. Environment Canada. 1997. Marine and Estuarine Biodiversity Monitoring Protocols. http://www. ec.gc.ca/faunescience-wildlifescience/default.asp?lang=En&n=B0D89DF1-1 Environment Canada. 2012. Field Manual Wadeable Streams. http://www.ec.gc.ca/Publications/ C183563B-CF3E-42E3-9A9E-F7CC856219E1%5CCABINFieldManual EN 2012.pdf
made possible by next-generation DNA sequencing. Molecular Ecology 21:2039–2044. Barbour, M. T., J. Gerritsen, B. D. Synder, and J. B. Stribling. 1999. Rapid Bioassessment Protocols for Use in Streams and Wadeable Rivers: Periphyton. Benthic Macroinvertebrates and Fish. Environmental Protection Agency, Washington D. C., USA. Beaumont, N. J., et al. 2007. Identification, definition and quantification of goods and services provided by marine biodiversity: Implications for the ecosystem approach. Marine Pollution Bulletin 54:253–265. Bevilacqua, S., S. Fraschetti, L. Musco and A. Terlizzi. 2009. Taxonomic sufficiency in the detection of natural and human-induced changes in marine assemblages: A comparison of habitats and taxonomic groups. Marine Pollution Bulletin 58:1850–1859. Bevilacqua, S., A. Terlizzi, J. Claudet, S. Fraschetti, and F. Boero. 2012. Taxonomic relatedness does not matter for species surrogacy in the assessment of community responses to environmental drivers. Journal of Applied Ecology 49:357–366. Bevilacqua, S., J. Claudet, and A. Terlizzi. 2013. Best Practicable Aggregation of Species: a step forward for species surrogacy in environmental assessment and monitoring. Ecology and Evolution 3:3780–3793. Birkhofer, K., J. Ekroos, E. B. Corlett, and H. G. Smith. 2014. Winners and losers of organic cereal farming in animal communities across Central and Northern Europe. Biological Conservation 175:25–33. Braun, A., K. Auerswald, and J. Geist. 2012. Drivers and spatio-temporal extent of hyporheic patch variation: implications for sampling. PLoS ONE 7:e42046. Braun-Blanquet, J. 1932. Plant Sociology. McGraw-Hill, New York, USA. Cairns, J., and J. R. Pratt. 1993. A history of biological monitoring using benthic macroinvertebrates. Freshwater Biomonitoring and Benthic Macroinvertebrates 10:27. Campbell, N. A., A. Kratochwil, T. Lazar, and J. B. Reece. 2009. Biologie. Pearson Studium, München, Germany. Caroni, R., W. van de Bund, R. T. Clarke, and R. K. Johnson. 2013. Combination of multiple biological quality elements into waterbody assessment of surface waters. Hydrobiologia 704:437–451. Caughlan, L., and K. L. Oakley. 2001. Cost considerations for long-term ecological monitoring. Ecological Indicators 1:123–134. Congreso Nacional de Chile. 2010. Ley Sobre Bases Generales Del Medio Ambiente. http://www.leychile.cl/Navegar?idNorma=30667f Crosswhite, D. L., S. F. Fox, and R. E. Thill. 1999. Comparison of Methods for Monitoring Reptiles and
v www.esajournals.org
15
May 2016 v Volume 7(5) v Article e01305
MUELLER AND GEIST Réunions Conseil International pour l’Exploitation de la Mer 155:8–14. Haase, P., S. U. Pauls, K. Schindehütte, and A. Sundermann. 2010. First audit of macroinvertebrate samples from an EU Water Framework Directive monitoring program: human error greatly lowers precision of assessment results. Journal of the North American Benthological Society 29:1279– 1291. Harvey, B. P., D. Gwynn-Jones, and P. J. Moore. 2013. Meta-analysis reveals complex marine biological responses to the interactive effects of ocean acidification and warming. Ecology and evolution 3:1016–1030. Heino, J. 2010. Are indicator groups and cross-taxon congruence useful for predicting biodiversity in aquatic ecosystems? Ecological Indicators 10:112– 117. Hills, J., and C. Wilkinson. 2004. Methods for Ecological Monitoring of Coral Reefs. Australian Institute of Marine Science, Townsville, Australia. Irschick, D. J., C. Fox, K. Thompson, A. Knapp, L. Baker, and J. Meyer. 2013. Functional ecology: integrative research in the modern age of ecology. Functional Ecology 27:1–4. Jackson, M. C., and J. Grey. 2013. Accelerating rates of freshwater invasions in the catchment of the River Thames. Biological Invasions 15:945–951. Johnson, R. K., and D. G. Angeler. 2014. Effects of agricultural land use on stream assemblages: Taxon-specific responses of alpha and beta diversity. Ecological Indicators 45:386–393. Jürgens, N., et al. 2012. The BIOTA Biodiversity Observatories in Africa: standardized framework for large-scale environmental monitoring. Environmental Monitoring and Assessment 184:655–678. Kroeker, K. J., R. L. Kordas, R. Crim, I. E. Hendriks, L. Ramajo, G. S. Singh, G. C. Duarte, and J. P. Gattuso. 2013. Impacts of ocean acidification on marine organisms: quantifying sensitivities and interaction with warming. Global Change Biology 19:1884– 1896. Kumschick, S., and D. M. Richardson. 2013. Species- based risk assessments for biological invasions: advances and challenges. Diversity and Distributions 19:1095–1105. Laffoley, D., E. Maltby, M. Vincent, L. Mee, E. Dunn, P. Gilliland, J. Hamer, D. Mortimer, and D. Pound. 2004. The Ecosystem Approach: Coherent Actions for Marine and Coastal Environments. A report to the UK Government. English Nature, Peterborough. Lakshman, G. 1979. An ecosystem approach to the treatment of waste waters. Journal of Environmental Quality 8:353–361.
European Parliament. 2000. Directive 2000/60/EC of the European Parliament and of the Council establishing a framework for the Community action in the field of water policy. Official Journal of the European Union 327:1–73. European Parliament. 2011. Directive 2011/92/EU of the European Parliament and of the Council of 13 December 2011 on the assessment of the effects of certain public and private projects on the environment. Official Journal of the European Union L26:1–21. Fabricius, C., M. Burger, and P. A. R. Hockey. 2003. Comparing Biodiversity between Protected Areas and Adjacent Rangeland in Xeric Succulent Thicket, South Africa: Arthropods and Reptiles. Journal of Applied Ecology 40:392–403. Ficetola, G. F., R. Sacchi, S. Scali, A. Gentilli, F. De Bernardi, and P. Galeotti. 2007. Vertebrates respond differently to human disturbance: implications for the use of a focal species approach. Acta Oecologica 31:109–118. Ficetola, G. F., C. Miaud, F. Pompanon, and P. Taberlet. 2008. Species detection using environmental DNA from water samples. Biology Letters 4:423–425. Fischer, J., D. B. Lindenmayer, and I. Fazey. 2004. Appreciating ecological complexity: habitat contours as a conceptual landscape model. Conservation Biology 18:1245–1253. Galiana, N., M. Lurgi, J. M. Montoya, and B. C. López. 2014. Invasions cause biodiversity loss and community simplification in vertebrate food webs. Oikos 123:721–728. Geist, J. 2011. Integrative freshwater ecology and conservation. Ecological Indicators 11:1507–1516. Geist, J. 2014. Trends and directions in water quality and habitat management in the context of the European water framework directive. Fisheries 39:219–220. Geist, J. 2015. Seven steps towards improving freshwater conservation. Aquatic Conservation: Marine and Freshwater Ecosystems 25:447–453. Gonzalez, A., and R. Knight. 2012. Advancing analytical algorithms and pipelines for billions of microbial sequences. Current Opinion in Biotechnology 23:64–71. Government of Canada. 2000. Canadian Environmental Protection Act, 1999. http://canlii.ca/t/5220v Guerra-García, J. M., M. J. Maestre, A. R. González, and J. C. García-Gómez. 2006. Assessing a quick monitoring method using rocky intertidal communities as a bioindicator: a multivariate approach in Algeciras Bay. Environmental Monitoring and Assessment 116:345–361. Gulland, J. A. 1964. Catch per unit effort as a measure of abundance. Rapports et Procèsverbaux des
v www.esajournals.org
16
May 2016 v Volume 7(5) v Article e01305
MUELLER AND GEIST Landeiro, V. L., L. M. Bini, F. R. Costa, E. Franklin, A. Nogueira, J. L. de Souza, J. Moraes, and W. E. Magnusson. 2012. How far can we go in simplifying biomonitoring assessments? An integrated analysis of taxonomic surrogacy, taxonomic sufficiency and numerical resolution in a megadiverse region. Ecological Indicators 23:366–373. Larsen, S., L. Mancini, G. Pace, M. Scalici, and L. Tancioni. 2012. Weak concordance between fish and macroinvertebrates in Mediterranean streams. PLoS ONE 7:e51115. Lee, S. W., S. J. Hwang, J. K. Lee, D. I. Jung, Y. J. Park and J. T. Kim 2011. Overview and application of the National Aquatic Ecological Monitoring Program (NAEMP) in Korea. International Journal of Limnology 47:S3–S14. Lefévre, E., L. P. Pereyra, S. R. Hiibel, E. M. Perrault, S. K. De Long, K. F. Reardon, and A. Pruden. 2013. Molecular assessment of the sensitivity of sulfate- reducing microbial communities remediating mine drainage to aerobic stress. Water Research 47:5316– 5325. Leslie, H. M., and K. L. McLeod. 2007. Confronting the challenges of implementing marine ecosystem- based management. Frontiers in Ecology and the Environment 5:540–548. Levin, P. S., M. J. Fogarty, S. A. Murawski, and D. Fluharty. 2009. Integrated ecosystem assessments: developing the scientific basis for ecosystem- based management of the ocean. PLOS Biology 7:e1000014. Lindenmayer, D. B., and G. E. Likens. 2010. The science and application of ecological monitoring. Biological Conservation 143:1317–1328. Lougheed, V. L., C. A. Parker and R. J. Stevenson. 2007. Using non-linear responses of multiple taxonomic groups to establish criteria indicative of wetland biological condition. Wetlands 27:96– 109. Lubchenco, J. 1998. Entering the century of the environment: a new social contract for science. Science 279:491–497. Luescher, G., et al. 2014. Responses of plants, earthworms, spiders and bees to geographic location, agricultural management and surrounding landscape in European arable fields. Agriculture, Ecosystems and Environment 186:124–134. Maes, D., and H. V. Dyck. 2005. Habitat quality and biodiversity indicator performances of a threatened butterfly versus a multispecies group for wet heathlands in Belgium. Biological Conservation 123:177–187. Magnusson, W. E.. 2013. Biodiversidade e Monitoramento Ambiental Integrado. PPBio INPA, Manaus, Brazil.
v www.esajournals.org
17
Magnusson, W. E. 2014. Uncertainty and the design of in-situ biodiversity-monitoring programs. Nature Conservation 8:77. Martínez-Crego, B., P. Prado, T. Alcoverro, and J. Romero. 2010. Composition of epiphytic leaf community of Posidonia oceanica as a tool for environmental biomonitoring. Estuarine, Coastal and Shelf Science 88:199–208. Meier, C., P. Haase, P. Rolauffs, K. Schindehütte, F. Scholl, A. Sundermann and D. Hering. 2006. Methodisches Handbuch Fließgewässerbewertung. http://www.fliessgewaesserbewertung.de Metcalf, R. L. 1977. Model ecosystem approach to insecticide degradation: a critique. Annual Review of Entomology 22:241–261. Millennium Ecosystem Assessment. 2005. Ecosystems and Human Well-Being: A Manual for Assessment Practitioners. Island Press, Washington, D.C., USA. Mueller, M., J. Pander, and J. Geist. 2011. The effects of weirs on structural stream habitat and biological communities. Journal of Applied Ecology 48:1450– 1461. Mueller, M., J. Pander, and J. Geist. 2013. Taxonomic sufficiency in freshwater ecosystems: effects of taxonomic resolution, functional traits, and data transformation. Freshwater Science 32:762–778. Mueller, M., J. Pander, and J. Geist. 2014a. The ecological value of stream restoration measures: an evaluation on ecosystem and target species scales. Ecological Engineering 62:129–139. Mueller, M., J. Pander, and J. Geist. 2014b. A new tool for assessment and monitoring of community and ecosystem change based on multivariate abundance data integration from different taxonomic groups. Environmental Systems Research 3:1–9. Mykrä, H., J. Aroviita, H. Hämäläinen, J. Kotanen, K. M. Vuori, and T. Muotka. 2008. Assessing stream condition using macroinvertebrates and macrophytes: concordance of community responses to human impact. Archiv für Hydrobiologie 172:191– 203. Nichols, S., P. Solane, J. Coysh, C. Williams, and R. Norris. 2000. Australian River Assessment System (AUSRIVAS). Sampling and Processing Manual. Cooperative Research Centre for Freshwater Ecology, University of Canberra, Canberra, Australia. Niemelä, J., and B. Baur. 1998. Threatened species in a vanishing habitat: plants and invertebrates in calcareous grasslands in the Swiss Jura mountains. Biodiversity and Conservation 7:1407–1416. Norris, R. H. 1995. Biological Monitoring: The Dilemma of Data Analysis. Journal of the North American Benthological Society 14:440–450. Nylund, G. M., F. Weinberger, M. Rempt, and G. Pohnert. 2011. Metabolomic assessment of induced
May 2016 v Volume 7(5) v Article e01305
MUELLER AND GEIST Republic of South Africa. 1998a. National Forests Act, 1998. Government Gazette 400:1–82. Republic of South Africa. 1998b. National Water Act, 1998. Government Gazette 398:1–101. Republica de Argentina. 2002a. Ley General Del Ambiente, Ley Nacional 25.675. http://www2.medioambiente.gov.ar/mlegal/marco/ley25675.htm Republica de Argentina. 2002b. Regimen de Gestion Ambiental de Aguas, Ley Nacional 25.688. http:// www.ambiente.gov.ar/archivos/web/DNorAmb/ File/25688.pdf Republica de Panama. 1998. Ley No. 41 General de Ambiente de La República de Panamá. http://www.wipo.int/wipolex/es/text.jsp?file xml:id=268422 Republica de Panama. 2009. Decreto Ejecutivo Numero 123http://www.cnpml.org.pa/images/mesa-dedialogo/marco-legal/marco-legal-6.pdf Reynoldson, T. B., R. H. Norris, V. H. Resh, K. E. Day, and D. M. Rosenberg. 1997. The reference condition: a comparison of multimetric and multivariate approaches to assess water-quality impairment using benthic macroinvertebrates. Journal of the North American Benthological Society 164:833– 852. Roberts-Pichette, P. 1995. Framework for Monitoring Biodiversity Change (Species and Species Groups) within the Ecological Monitoring and Assessment Network in Canada. http://www. ec.gc.ca/faunescience-wildlifescience/default.asp?lang=En&n=B0D89DF1-1 Rocha, S. M., R. Freitas, P. Cardoso, M. Santos, R. Martins, and E. Figueira. 2013. Exploring the potentialities of comprehensive two-dimensional gas chromatography coupled to time of flight mass spectrometry to distinguish bivalve species: Comparison of two clam species (Venerupis decussata and Venerupis philippinarum). Journal of Chromatography A 1315:152–161. Rowe, J. S. 1992. The ecosystem approach to forestland management. Forestry Chronicle 68:222–224. Russian Federation. 1997. Russian Federation Forest Code No. 22-FZ. http://old.forest.ru/eng/legislation/forestcode.html Russian Federation. 2002. Federal Law on Environmental Protection No. 7-FZ. http://www.asser.nl/ upload/eel-webroot/www/documents/Federal%20 Law%20on%20Environmental%20Protection%20 Russia ENG.pdf Russian Federation. 2006. Water Code of the Russian Federation. http://dinrac.nowpap.org/documents/ law/Russia/Water Code Russia.pdf Sachs, J. D., et al. 2009. Biodiversity conservation and the millennium development goals. Science 325:1502–1503.
and activated chemical defence in the invasive red alga Gracilaria vermiculophylla. PlosONE 6:e29359. Odum, E. P. 1957. The ecosystem approach in the teaching of ecology illustrated with sample class data. Ecology 38:531–535. Padial, A., et al. 2012. Relationships between multiple biological groups and classification schemes in a Neotropical floodplain. Ecological Indicators 13:55–65. Pander, J., and J. Geist. 2013. Ecological indicators for stream restoration success. Ecological Indicators 30:106–118. Parliament, E.. 1992. Directive 92/43/EEC of 21 May 1992 on the conservation of natural habitats and of wild fauna and flora. Official Journal of the European Union 206:7–50. Parliament of India. 2003. Biological Diversity Act, 2002. http://www.moef.nic.in/divisions/csurv/nba act.htm Parliament of Kenya. 1999. Environment Management and Coordination Act, 1999. http://www.nema. go.ke/index.php?option=com content&view=article&id=132&Itemid=487 Pereira, H. M., et al. 2013. Essential biodiversity variables. Science 339:277–278. Pik, A. J., I. Oliver, and A. J. Beattie. 1999. Taxonomic sufficiency in ecological studies of terrestrial invertebrates. Australian Journal of Ecology 24:555–562. Pullin, A. S. 2002. Conservation Biology. Cambridge University Press, Cambridge, UK. Rands, M. R. W., et al. 2010. Biodiversity conservation: challenges beyond 2010. Science 329:1298–1303. Republic of China. 1988. Water Law of the People’s Republic of China. http://english.gov.cn/laws/200510/09/content 75313.htm Republic of China. 1989. Environmental Protection Law of the People’s Republic of China. http://www. china.org.cn/english/environment/34356.htm Republic of Korea. 1997a. Environmental Impact Assessment Act. http://www.moleg.go.kr/english/ korLawEng?pstSeq=52628 Republic of Korea. 1997b. Natural Environment Conservation Act. http://www.moleg.go.kr/english/ korLawEng?pstSeq=47537 Republic of Korea. 1997c. Water Quality and Ecosystem Conservation Act. http://www.moleg.go.kr/ english/korLawEng?pstSeq=47543 Republic of Namibia. 2004. Water Resources Management Act, 2004. Government Gazette of the Republic of Namibia 3357:1–57. Republic of Namibia. 2007. Environmental Management Act, 2007. Government Gazette of the Republic of Namibia 3966:1–30. Republic of South Africa. 1989. Environment Conservation Act (ECA), Act 73 of 1989. http://www.acts. co.za/environment-conservation-act-1989/
v www.esajournals.org
18
May 2016 v Volume 7(5) v Article e01305
MUELLER AND GEIST Sachtleben, J. 2010. Überarbeitete Bewertungsbögen Der Bund-Länder-Arbeitskreise Als Grundlage Für Ein Bundesweites FFH-Monitoring. Bundesamt für Naturschutz, Bonn, Germany. Sands, P., and J. Peel. 2012. Principles of International Environmental Law. Cambridge University Press, Cambridge, UK. Schaumburg, J., C. Schranz, D. Stelzer, and G. Hofmann. 2007. Handlungsanweisung Für Die Ökologische Bewertung von Seen Zur Umsetzung Der EU-Wasserrahmenrichtlinie: Makrophyten Und Phytobenthos. Bayerisches Landesamt für Umwelt, Augsburg, Germany. Scheuer, S. 2006. EU Environmental Policy Handbook: A Critical Analysis of EU Environmental Legislation. Intl Books, Utrecht, Netherlands. Schmeller, D. S., et al. 2015. Towards a global terrestrial species monitoring program. Journal for Nature Conservation 25:51–57. Schouten, M. A., P. A. Verweij, A. Barendregt, R. M. J. C. Kleukers, V. J. Kalkman, and P. C. de Ruiter. 2009. Determinants of species richness patterns in the Netherlands across multiple taxonomic groups. Biodiversity and Conservation 18:203–217. Sherman, K., and A. M. Duda. 1999. An ecosystem approach to global assessment and management of coastal waters. Marine Ecology Progress Series 190:271–287. Siqueira, T., L. M. Bini, S. M. Thomaz, and D. Fontaneto. 2015. Biodiversity analyses: Are aquatic ecologists doing any better and differently than terrestrial ecologists? Hydrobiologia 750:5–12. Slatyer, R. A., M. Hirst, and J. P. Sexton. 2013. Niche breadth predicts geographical range size: a general ecological pattern. Ecology Letters 16:1104–1114. Spence, B. C., and R. M. Hughes. 1996. An Ecosystem Approach to Salmonid Conservation. ManTech Environmental Research Services, Portland, Canada. Stevens, V. M., et al. 2014. A comparative analysis of dispersal syndromes in terrestrial and semi- terrestrial animals. Ecology Letters 17:1039–1052. Stewart, G. 2010. Meta-analysis in applied ecology. Biology Letters 6:78–81. Suhre, K., and P. Schmitt-Kopplin. 2008. MassTRIX: mass translator into pathways. Nucleic Acids Research 36:W481–W484. Thompson, R. M., and C. R. Townsend. 2000. Is resolution the solution? The effect of taxonomic
resolution on the calculated properties of three stream food webs. Freshwater Biology 44:413–422. Thompson, R. M., J. A. Dunne, and G. Woodward. 2012. Freshwater food webs: towards a more fundamental understanding of biodiversity and community dynamics. Freshwater Biology 57:1329–1341. Thorp, J. H. and M. D. Delong. 1994. The Riverine Productivity Model: An Heuristic View of Carbon Sources and Organic Processing in Large River Ecosystems. Oikos 70:305–308. Timms, L. L., J. J. Bowden, K. S. Summerville, and C. M. Buddle. 2013. Does species-level resolution matter? Taxonomic sufficiency in terrestrial arthropod biodiversity studies. Insect Conservation and Diversity 6:453–462. Townsend, C. R., M. Begon, and J. L. Harper. 2009. Ökologie: Übersetzung Der 3, Englischen edition. Springer, Berlin, Germany. Tuck, S. L., C. Winqvist, F. Mota, J. Ahnström, L. A. Turnbull, and J. Bengtsson. 2014. Land-use intensity and the effects of organic farming on biodiversity: a hierarchical meta-analysis. Journal of Applied Ecology 51:746–755. Underwood, A. J. 1992. Beyond BACI: the detection of environmental impacts on populations in the real, but variable, world. Journal of Experimental Marine Biology and Ecology 161:145–178. United Nations. 1992. Convention on Biological Diversity (text with Annexes). United Nations, Montreal, Canada. United Nations Environment Programme. 1998. Convention on Biological Diversity: Report on the Workshop on the Ecosystem Approach. United Nations Environment Programme, Bratislava, Slovakia. 91st United States Congress. 1970. National Environmental Policy Act of 1969 (NEPA). Public Law: 91–190. 92nd United States Congress. 1972. Federal Water Pollution Control Amendments of 1972 (CWA/Clean Water Act). Public Law: 92–500. Vlachopoulou, M., D. Coughlin, D. Forrow, S. Kirk, P. Logan, and N. Voulvoulis. 2014. The potential of using the Ecosystem Approach in the implementation of the EU Water Framework Directive. Science of the Total Environment 470:684–694. Zaccagnini, M. E., et al. 2007. Monitoreo Ambiental Rural. http://inta.gob.ar/documentos/monitoreo-ambientalrural
Supporting Information Additional Supporting Information may be found online at: http://onlinelibrary.wiley.com/doi/10.1002/ ecs2.1305/supinfo
v www.esajournals.org
19
May 2016 v Volume 7(5) v Article e01305