Leisure Studies, Vol. 23, No. 3, 267–281, July 2004
Conceptualization and alternate operationalizations of the measurement of sponsorship effectiveness in sport JOHN L. CROMPTON Department of Recreation, Park and Tourism Sciences, Texas A & M University, TX, USA
[email protected] Dept of& RecreationPark Leisure 10.1080/0261436042000183695 RLST100153.sgm 0261-4367 Review Taylor 102004 24 JohnL.Crompton 000002004 and Studies Article Francis (print)/1466-4496 FrancisLtd Ltd and Tourism (online)SciencesTexas A & M UniversityTX 77843-2261USA
ABSTRACT A model that integrates the communication and product adoption processes is developed and is used to evaluate the effectiveness of alternate measures of sponsorship. The further through the communication process an evaluation takes place, the stronger is the evidence of a sponsorship’s contribution to increasing sales. The most frequently used sponsorship measure is media equivalency values. These frequently inflate the real value of media coverage. Further, this approach is fundamentally conceptually flawed because it measures only the extent of media output and offers no insight as to whether people absorbed the message. Studies measuring changes in consumers’ awareness usually rely on people’s recall of a sponsor’s name being associated with an event, but recall is notoriously faulty. Image enhancement is a state closer to assessing impact on sales and is best measured by ‘strength of link’, reflecting the extent to which a brand has borrowed an event’s image. Intent-to-purchase studies are the stage immediately preceding sales and can be done by surveying audiences and identifying their brand and product desires and their purchase habits. The most desirable measure from a sponsor’s perspective is impact on sales, which may be expressed as: (i) increases in traffic at retail points of sale; (ii) number of new sales leads created; or (iii) actual increase in sales associated with a sponsorship.
Introduction In the past decade, the rate of growth in sponsorship has outpaced that of investment in any other form of marketing communication or promotion vehicle. In 1987, sponsorship spending in the US amounted to $1.35 billion, but by 2003 it was projected to escalate to over $10.5 billion. Worldwide sponsorship investment now exceeds $26 billion (IEG, 2002). Over two-thirds of this sponsorship is invested in sports. The extraordinary growth of sponsorship in sport is exemplified by the increases in sponsorship income to the Olympic Games between Montreal in 1976 and Sydney in 2000. The 1976 Olympics in Montreal had 628 sponsors who contributed a total of $4.16 million (Rozin, 1995). In 1984, the Los Angeles Olympic Committee persuaded 32 companies to each invest between $4 million Correspondence Address: John L. Crompton, Department of Recreation, Park and Tourism Sciences, Texas A & M University, College Station, TX 77843-2261, USA. Email:
[email protected] ISSN 0261–4367 (print)/ISSN 1466–4496 (online)/04/030267–15 © 2004 Taylor & Francis Ltd DOI: 10.1080/0261436042000183695
268
J. L. Crompton
and $13 million. This demonstration of the potential revenue stream that could accrue from sponsorships caused the International Olympic Committee (IOC) to establish The Olympic Program (TOP) which was run by the IOC, not the host Olympic organizing committee. Subsequently TOP sponsorship revenues were: Seoul 1988, $95 million (from nine companies); Barcelona 1992, $175 million (12 companies); Atlanta 1996, $350 million (10 companies); and Sydney 2000, $550 million (11 companies). In addition to TOP sponsorship, the host organizing committee offers sponsorship opportunities for corporations to associate themselves domestically with the Games. The Sydney Organizing Committee generated $492 million from these sponsorships. Thus, in aggregate the Sydney Games received over $1 billion from sponsorship, compared to the $4.18 million generated at Montreal (Howard and Crompton, 2004). A decade ago, in the early days of modern sponsorship, it was often not differentiated from philanthropy. Decisions to support a particular sport or sporting event frequently reflected the personal interests of senior management, rather than a careful assessment of the benefits that were likely to accrue to a company from its investment. The conventional wisdom appears to be that there is now more pressure on senior managers to demonstrate accountability for sponsorship investments by showing their potential for increasing a company’s profitability. The corporate scandals that have emerged in the past 3 years in the US focused attention on corporate governance and presumably reinforced the pressure for the accountability of senior executives on sport sponsorship decisions. These pressures have resulted in enhanced interest in measuring and evaluating the impact of sponsorship decisions. The central concept underlying sponsorship is exchange theory, which is one of the most prominent theoretical perspectives in the social sciences. It has two main precepts: (i) two or more parties exchange resources, and (ii) the resources offered by each party must be equally valued by the reciprocating parties. In response to the first precept of exchange theory, sport organizations and businesses have multiple resources that they may use as ‘currency’ to facilitate an exchange. The sport facility or event may offer businesses increased awareness, image enhancement, product trial or sales opportunities. Companies in return may offer support through investments of money, media exposure, or in-kind services. The second precept of exchange theory suggests that a corporate partner will ask two questions, ‘What’s in it for me?’ and ‘How much will it cost me?’ The trade-off is weighed between what will be gained and what will have to be given up. A key feature of this second precept is that the exchange is perceived to be fair by both sides. The fairness issue is resolved through the use of evaluation studies that measure the benefits that a company receives from its sponsorship investment. The literature relating to sponsorship evaluation is underdeveloped. For the most part, it consists of anecdotal information and case studies from which it is difficult to make useful generalizations. This paper offers a conceptual framework within which these studies can be placed, thus facilitating generalizations about the utility of each of the genre constituting the framework’s categories. The framework relates the communication opportunities offered by a sport organization to a sponsor to the benefits sought by a business, and thus facilitates evaluation of the second precept of exchange theory.
Measurement of sponsorship effectiveness in sport
269
Despite both its obvious role in the context of validating the legitimacy of the exchange and all the lip-service given to the importance of evaluation, 40% of 200 sponsoring companies with major sponsorship investments reported spending nothing on research to measure the impact of their investments, while an additional 35% reported spending 1% or less of their sponsorship budget on impact evaluation. However, many of these companies expressed the belief that evaluation should be a responsibility of the sport organization, and 68% of respondents reported that such organizations did not match their expectation in this area (IEG, 2002a). In contrast to the widespread lack of investment in evaluation, CocaCola, one of the largest and most experienced sponsors of sport, allocates between 3 and 10% of its rights fees for evaluation (IEG, 1999a). To remove the evaluation void, it would appear imperative that sport organizations incorporate measurement audits in the proposal packages that they present to prospective sponsor companies. Evaluations are likely to be especially credible if they are done by an external consultant, rather than in-house. The demand for impartial, third party, analyses has created a niche for companies that specialize in doing these assessments. Sometimes it may be efficient for a sport organization to coordinate a single evaluation study that services all its sponsors: The Toronto Raptors offered all its sponsors the opportunity to share the cost of a $50 000 survey that annually tracked consumers’ recall and reaction to Raptors’ sponsors. With the shared cost, it became very affordable for each company. In addition to a set of general questions, each of the participating companies added a set of their own specific questions. Annual surveys such as this enable companies to longitudinally track some dimensions of their sponsorship’s impact. The survey results are reported directly to the sponsoring companies by the private company contracted to do the research. Whether the results are also shared with the team is left up to the sponsor. (Team Marketing Report, 1997)
The usefulness of an evaluation to a company will be strongly influenced by the original specification of its sponsorship objectives. If they were SMART (specific, measurable, achievable, results oriented, and time bounded) then they give explicit direction as to what the evaluation must be designed to measure. As companies seek different objectives from their sponsorships — awareness, image, demonstration platform, employee morale, product trial, product sales, etc. — different types of measures and designs will be required for each objective. Linking sponsorship to the communications process Even with good a priori specification of objectives, there are two factors that make assessing the impact of sponsorship investments challenging. First, sponsorship typically is used as a platform for focusing the message of multiple other promotional tools. This makes it difficult to isolate the specific impact of a sponsorship. Even if other promotional tools are not being used simultaneously, there is likely to be some carry-over effect from previous marketing communications efforts that make isolating the impact of a specific sponsorship difficult. These challenges can be addressed by the use of statistical models. A brand’s historical sales data are likely to be available, as well as information on its historical spending on advertising, sales promotion, price discounting and other factors. This enables statistical
270
J. L. Crompton
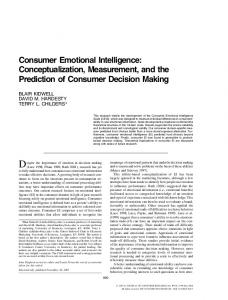
models to be constructed that isolate the effects of each element on sales (Horn and Buken, 1999). A second challenge in evaluation is to account for uncontrollable environmental factors. Changes in sales levels may be attributable to changes in the marketing environment (for example, an increase or reduction in the intensity of competitive effort, or varying levels of discretionary income as a result of changes in economic conditions) rather than the sponsorships (Meenaghan, 1991). The process through which companies seek to communicate a message to individuals in their target market through sponsorship is shown in Fig. 1. The sponsor codes messages into a transmittable form (or arranges and locates those messages so that the media will incidentally transmit them). The form may include written captions, company or brand name, logo or verbal (oral) material. The coded message is transmitted by print media, broadcast media or personal contact. For communication to occur, individuals in the target market must absorb, receive and interpret the message. The message may be designed to change or reinforce a brand’s position; to differentiate it from other brands; or to establish an intimate and emotionally involved relationship with a target audience. However, the ultimate goal of a total communications strategy is to enhance profitability by generating additional sales. A company’s expectation is that its sponsorship investment ultimately will contribute to that end. An intervening variable (shown as jagged lines in Fig. 1) is ‘noise’. ‘Noise’ consists of other stimuli or communications that compete for the intended receiver’s attention. A message from a sponsoring organization to its target market is subject to the influence of extraneous noise and distracting stimuli that interfere with communication of the message. This noise may distort or distract attention from the transmission or reception of the message at any stage in the process. It may prevent members of the target market from receiving the message, or it may lead to them interpreting it differently from the way in which the sponsor intended. In the context of sponsorship in which the message is incidental to the main event, there is likely to be substantial noise that may cause the message to appear inconsequential and to be ignored. Figure 1 shows the stages in the communication process at which the effectiveness of sponsorship can be measured. The further through the process that an evaluation takes place, the stronger is the evidence of a sponsorship’s contribution to increasing sales. However, emphasis on short-term sales is often not the primary goal. Rather, the general criterion may be: Does the sponsorship provide an environment in which more sales can be made and provide sales representatives for the brand with more tools in order to compete more effectively with competitor brands? (Kolah, 2001). Thus, sponsorship objectives most frequently relate to creating a climate conducive to the development of sales in the future rather than to stimulating immediate sales. For this reason, most evaluations are undertaken earlier in the communications process. If sales are not measured, then the next most convincing measures for demonstrating economic return for a sponsorship (i.e. the probability that a desired increase in level of sales will result) are those that are completed at the reception stage of the process, because this is only one-step removed from the sales purchase action. Stages in the communication process at which sponsorship is measured.
Measurement of sponsorship effectiveness in sport 271
Figure 1. Stages in the communication process at which sponsorship is measured.
272
J. L. Crompton
Individuals pass through a series of stages from first becoming aware of a product or company to finally making a purchase decision. These stages are generally known in the marketing field as the product adoption process. The three stages in this process that precede purchase action, and that are encapsulated in the reception stage of the communication process, are awareness, interest and intent-topurchase. These stages emphasize that a decision to participate is usually the culmination of a process that may have started long before an actual purchase takes place. Thus, sponsorship of a sport event ultimately is likely to impact sales if it succeeds in moving individuals from their present stage in the adoption process on to the next stage toward making a purchase decision. Measuring media equivalencies The most frequently used type of sponsorship effectiveness measure is taken at the message channel stage (Fig. 1). This approach uses media equivalency values to assess the value of media coverage a brand or company receives. It compares the value of sponsorship-generated media coverage to the cost of equivalent advertising space or time. It usually involves quantifying the following: ● ● ●
duration of television coverage, including both verbal and visual mentions duration of radio mentions extent of press coverage as measured in single column inches
Typically, these media mentions are tracked and each is assigned a dollar value based on the paid advertising rate. For example, in one year Volvo calculated that it received $7 in value for every $1 spent on its sponsorship of tennis. This resulted from 2.26 billion impressions, including television, print, radio, event attendance and promotions. These impressions were calculated to translate to $32.8 million in equivalent value and Volvo spent less than $5 million on its sponsorship (Schlossberg, 1991). This type of analysis can provide a good longitudinal comparative measure of exposure. It enables a sponsor to conclude that the year’s exposure of $32.8 million is greater/lesser than last year’s exposure. It can also provide sport managers with data enabling them to compare the exposure value their organization or event generates compared to other competing events. If media coverage is used as a measure of sponsorship effectiveness, the exposures should be weighted to reflect (i) the relative attractiveness of different types of media coverage; and (ii) the quality of the coverage, which is likely to vary widely across companies. Because the attractiveness varies, the appropriate portion of advertising equivalency costs to use as a measure of the value of media exposure will also vary. To some companies, a sponsorship mention may be worth only 10% of equivalent advertising time in a particular medium, while to others it may be worth 100%. Because tobacco companies, for example, are unable to advertise on television, sponsorship mentions in that medium are likely to be valued more highly by those companies than similar exposures achieved by a soft drinks supplier. If a company or brand has very high unaided recall before a sponsorship, then the value of media exposure is likely to be relatively small. For example, Coca-Cola has an unaided recall of around 95%, so media coverage is not likely to be as important to that product as it would be to a new soft drink trying to build awareness.
Measurement of sponsorship effectiveness in sport
273
Quality of media coverage is likely to vary from the highly favorable to the somewhat less favorable. Furthermore, the location and nature of coverage obtained even within a single medium will influence its impact. For example, a favorable editorial mention may be considered to be of greater value than mentions in a sports column, or a name in a headline or photograph may be given higher value than a mention of a brand in the body of a story. Some companies assign different values to different publications by using weightings. Thus, variables that may influence media equivalency values include: quality of exposure, size of audience, audience demographics, key messages communicated, type of coverage, type of media and prominence and position. A final type of quality measure that is used seeks to reflect the extent of clutter encountered by a sponsorship. This measure expresses media coverage achieved by the sponsor as a percentage of total coverage of that activity and/or as a percentage of total mentions attained by all sponsors of that activity. If this percentage is reasonably high, then it is deemed more likely to emerge from the clutter of other sponsors and make an impact. Measures of media coverage frequently inflate its real value. This inflation may occur in three ways. First, article length is measured and equated with advertising space, even though the sponsor’s name may only be mentioned a couple of times in the article. Second, typically, the maximal rate card value is assumed when quantifying the cost of equivalent advertising space, and few companies in fact pay these full rates. The third and most fundamental source of inflation is the assumption that two seconds here and four seconds there of background signage or logo, when summated, are equal to a television spot that gives an advertiser 30 seconds in which to sell. Thus, a well-respected authority commenting on the use of these procedures by the John Hancock Company stated, ‘Ad. equivalencies are bunk. If Hancock management thinks 30 seconds of ID has the same value as a 30 second ad. spot, that’s its problem.’ (Ukman, 1992, p. 2). Using media exposure measures and equivalences means that sponsorship is being defined in terms of traditional advertising which is inappropriate because sponsorship and advertising are designed to achieve different outcomes. Imposing familiar advertising evaluation models on to sponsorship is of little value. Sponsorship is not merely advertising with added value, it is a qualitatively different vehicle (Ukman, 1996). There is a tendency to measure what is easy, namely visibility, rather than what is important, namely impact. CPM (cost per thousand people exposed to the brand name) represents only a paper justification for the investment, it does not measure its effectiveness. Experiments on the recall of visibility of signs at sports arenas compared to advertising for the same brand, led to the conclusion that individuals needed 10 times more exposure to signage than to a commercial advertisement to approximate a similar recall impact because of the subtle nature of the background signage exposure (Poknywczynski, 2000). The issue has been expressed in the following terms: Measuring ‘visibility’ leaves the real questions unanswered. Does anybody notice the logo in the background? What message about the brand is communicated by the logo on the scorer’s table? The brand is paying a high price to be seen in this particular environment. Is being seen on the scorer’s table at the NBA All Star game really worth any more than being seen on the side of a building somewhere? Does anyone know that the brand is a sponsor of this event?
274
J. L. Crompton
Does anyone care? These questions aren’t about visibility. These questions are about impact. (Crimmins and Horn 1996, p. 12)
A defender of these procedures responded: ‘Is it better to interrupt a broadcast with your message? Is it better to upset viewers? Of course you usually won’t upset them because they are probably in the kitchen or the bathroom.’ (Urbanski, 1992)
This type of defense is not convincing. Sponsorship lacks the direct impact possibilities normally associated with advertising. This is widely recognized and explains why the rule-of-thumb adopted by sponsors who do use media coverage measures as their primary evaluation tool is that total exposure received should be worth at least three to six times the cost of their sponsorship. In addition to the pragmatic limitations of the media exposure approach discussed in the previous paragraphs, there is a fundamental conceptual flaw in considering it as a proxy measure of a sponsorship’s impact on awareness. Measurements of media exposure are taken at the message channel point in the communications process (Fig. 1). That is, they purport to assess the extent of media output of the company’s message that has occurred. Media output, however, does not equate to awareness in the target market, which occurs at the subsequent reception stage. It has been observed that: While you can certainly get a guide to the visibility of your sponsorship and the potential for awareness among your target audience, you certainly cannot tell by measuring media mentions how many of your target audience saw and registered the mentions, nor how the viewers’ attitude to you or your product has been influenced by the sponsorship. (Sleight, 1989, p. 227)
For awareness to occur, members of the target market have to interpret the message and then absorb it. There is a substantial probability that this will not occur because individuals are exposed to many more communications than they can possibly accept or decode. Selective perception and retention means that people become aware of, and retain, only a small portion of the information to which they are exposed. They tend to select that which is of interest and is consistent with their existing feelings and beliefs, and ignore the rest. If a name, picture, cue, logo, banner or other signage does not appeal, or if there seems to be no good reason why it should be noted, then an individual is unlikely to open his or her senses to it, and, therefore, it will not be received. This explains the results CocaCola obtained from exit interviews undertaken at a NASCAR event called the Coca-Cola 600. For seven hours, people in the stands watched cars race 600 miles around a huge Coca-Cola logo. Yet 60% of them could not name the sponsor afterwards (D’Alesandro, 2001). Hence, communication is not a one-way process from the sponsor organization to its target market, which use of the media exposure measure implies. Rather, it is a two-way process that depends on the intended recipients being interested sufficiently to interpret and absorb the communication. Despite the substantial limitations associated with using media exposure and advertising equivalency visibility measures to evaluate the impact of sponsorship, these measures continue to be the most widely used evaluation tool with 70% of companies in one survey reporting that they undertook evaluation using media equivalencies, whereas only 40% of these companies measured awareness/image and only 7% measured changes in sales volumes (Poknywczynski, 2000). There
Measurement of sponsorship effectiveness in sport
275
are three practical reasons for this sustained emphasis of media equivalencies. First, they are easy for management to understand. Second, these types of data are relatively easy to collect. Third, they offer quantifiable statistics that give the appearance that sponsorship decisions are being based on objective data, and thus offer peace of mind to those responsible for making those decisions. Sport managers who want to include a measure of the potential of their event in sponsorship proposal packages also can relatively easily adopt this measure. Indeed, media exposure is the only evaluative measure they can undertake without intruding into the business of the event’s sponsors. Other measures requiring, for example, preand post-tests of awareness levels of a sponsor’s product or sales performance, are likely to be outside the organizers’ realm of access. Measuring impact on awareness The positive impact of sponsorship in creating awareness was perhaps most vividly demonstrated by the Cornhill Insurance Company’s sponsorship of cricket. Before it committed to this sponsorship, research showed that unprompted spontaneous awareness of Cornhill insurance among UK residents was less than 2%, while after the 5-year sponsorship it increased to 21%. Cornhill’s analysis of the annual benefits from its sponsorship in a typical year showed that during 140 hours of television coverage the company received 7459 banner ratings on screen and 234 verbal mentions. In addition, there were 1784 references on radio, 659 in the national press and 2448 in the provincial press. The 250 tickets that Cornhill received for each Test Match were also a valuable aid in improving relations with brokers and customers. Cornhill estimated that its investment of £2 million (£1 million in event cost and £1 million backup cost) over the 5-year period, returned £10 million in increased annual premium income. It estimated that this would have cost £30 million in conventional advertising (Howard and Crompton, 2004). However, the Cornhill case is likely to be atypical for two reasons. First, Cornhill did not engage in any form of communication except sponsorship and its associated advertising and, second, the company had a very low awareness level at the beginning of the sponsorship. These factors made it relatively easy to measure increases in awareness attributable to the sponsorship. A similar situation existed at Green Flag: The Green Flag company was a vehicle rescue organization that had previously been called National Breakdown. The company’s goal in becoming the main sponsor of the England soccer team was to create awareness of its new name and what the company did. At the outset, national awareness of the company was 6% and at the end of its 4-year sponsorship this had risen to 27%, which it considered a good return on its $1.5 million per year sponsorship fee. (Miles, 2001)
However, for products that do not exhibit these characteristics, the research design is likely to incorporate: (i) a control group that is not exposed to the sponsorship that can be measured and used to discount the effects of other simultaneous communication efforts in which a company may be investing; and (ii) a two-part survey conducted before and after the event. NutraSweet compared results between control and treatment groups to assess the extent of linkage the company achieved between its target audience and its sponsorship of figure skating:
276
J. L. Crompton
NutraSweet was sole corporate sponsor of the United States Figure Skating Association, and sponsored such events as the World Professional Figure Skating Championship, the Challenge of Champions, and national Ice Skating Month. To assess the strength of the linkage, the company commissioned a study of sales and attitudes about its association with the sport in four television markets that carried the world championships. In two of the four markets, NutraSweet commercials were deliberately blocked out, but reviewers recalled seeing NutraSweet advertisements anyway. The company considered this to be indicative of the positive image emitted from association with figure skating. (Schlossberg, 1990)
This example of faulty recall exemplifies a limitation of using recall in measures of sponsorship effectiveness. Recall is notoriously faulty. People are more likely to associate a sponsor with an event based on the brand’s popularity, rather than on their remembrance of seeing a company’s signage on-site. For example, one study reported that only 6% of people used their actual memory of the sponsorship when asked to recall event sponsors; 42% of them recalled sponsors based on ‘relatedness’ (that is, congruence of image between the event and a brand) and 21% tended to assume that a market leader in a product category was the company affiliated with the event; the remaining 31% of responses were based on random guesses (Pham and Johar, 2000). Another study reported that people recalled seeing the brands they used, irrespective of whether those brands were involved in sponsorship (Oek and Gendall, 2002). An implication of this phenomenon is that market leaders and highly related companies are likely to receive some credit for sponsoring whether they actually do so or not. It also suggests that any ambushing strategy these companies initiate is likely to have a high probability of success. However, another implication is that these brands will overestimate the effect of their sponsorship if they use recall as an evaluation measure. For example, if a market leader generated 60% recall from its sponsorship of an event, attributed recall might have been 20% or 30% even without the sponsorship. If recall is an important objective of the sponsorship, one of the ways to obtain a more accurate assessment is to ask respondents how confident they are in their answers. This could help determine how much of the recall is attributable to educated guessing rather than actual memory (Pham and Johar, 2000). Another strategy is to use longitudinal studies that will identify shifts over time, using the first year as a baseline and measuring incremental shifts. Such studies are also used to gauge where a subsequent sponsorship is in its life cycle. They may suggest that awareness of a company through its association with the event is incrementally increasing at a satisfactory rate or that it has peaked and reached saturation level and that additional investment in it is not likely to be productive: Cannon made a commitment of $5 million to sponsor the Football League in England. In a three year period, awareness of Cannon went from below 20% to more than 80%. The company decided reaching the last 15% or 20% would not be cost effective, so it withdrew from its soccer sponsorship. However, Cannon did this in a very positive way. It invited all the journalists who covered the original announcement three years earlier to a press conference and explained how successful the sponsorship had been. Coverage of its withdrawal was very upbeat and the league was able to find a new sponsor without any problem. (IEG, 1986)
Awareness may also be measured by the number of visits made to websites. For example, Thatlook, which is a referral service for elective cosmetic surgery, recorded more than 4 million hits in the three days following its title sponsorship
Measurement of sponsorship effectiveness in sport
277
of a NASCAR Winston Cup race. Normal three-day traffic averaged 260 000 hits (IEG, 2000). This is a more convincing measure of awareness than recall because people have overtly demonstrated their awareness by engaging in an action. The linkage between awareness as measured by recall and subsequent purchase behavior is very tenuous. There are multiple other stages that need to be surmounted. Visits to websites places people much closer to the purchase decision (maybe only a click or two away), making it a more desirable measure from a sponsor’s perspective. Measuring impact on image Image enhancement or positive attitude change towards a product or company is a stage closer to the desired sales outcome than awareness (Fig. 1). The distinction between these two stages is illustrated in the following example: A manufacturer and distributor of alcohol sponsored a horse racing classic for fifteen years in a bid to achieve a greater awareness of the company’s leading brand among cognac drinkers who were followers of this sporting activity. With media coverage exposure showing an annual increase, the company assumed that the brand was achieving significant awareness amongst its target markets. [A questionable assumption!] They commissioned a market research study to identify the extent of positive attitude change. The findings showed that attitudes to the brand were no more positive among those cognac drinkers who could identify the brand’s association with the sponsorship, than among those respondents who were unaware of the brand sponsorship. These findings suggested to the company that the sponsorship investment (which was over $500 000) had no impact on the level of positive attitude to the brand, and thus the company considered withdrawing from it. (Meenaghan, 1983)
Trust and credibility are components of image, so measures of these dimensions should be incorporated into the evaluation of image. They are key elements in establishing relationships with consumers and the extent to which sponsorships enhance people’s perception of these facets of a company should be measured. Companies often want to know the extent to which a brand has effectively borrowed an event’s image. This ‘strength of link’ is best measured by the formula: ‘% of target market who recognize the link between the sponsoring brand and the event’ minus ‘% of target market who mistakenly believe there is a link between a nonsponsoring competitor and the event’. The larger the percentage who recognize that a brand is a sponsor and that its competitor is not, the stronger the link. Thus, Coca-Cola was recognized by 35% of NFL fans who were soft drink users as the official soft drink of the NFL. The company paid $250 million over 5 years for this right. However, 34% of the same target market mistakenly identified Pepsi as a sponsor of the NFL, which means that Coca-Cola failed to establish the link and gain value from its association (Crimmins and Horn, 1996). In the context of the Olympic Games, several large companies and well-known brands that were Olympic sponsors, such as Crest, Oscar Mayer, Panasonic, Maxwell House and Nuprin, to name just a few, met a similar fate. Having paid millions for the right to say they were Olympic sponsors and to use the Olympic logo, these companies never communicated their sponsorship to the consumer (Crimmins and Horn, 1996, p. 14)
278
J. L. Crompton
Another strategy for identifying how much image has been borrowed from an event is to use a longitudinal design. This was used by Visa as part of the company’s evaluation of its role as an Olympic Games TOP sponsor: Respondents were asked which brand or company offered the best credit card service. Three months before the Games, Visa’s advantage over MasterCard was about 15 percentage points. During the Games it doubled to 30 points. A month after the Games, its superiority was 20 points, still greater than before Games level. This suggested that Visa’s sponsorship resulted in a change in its relative position in the market place, which is somewhat akin to the Intentto-Purchase phase of the product adoption perceived stage. (Crimmins and Horn, 1996)
Measuring impact on intent to purchase The product adoption process suggests that potential purchasers move from awareness, to interest, to intent to purchase before investing in a sales action (Fig. 1). Hence, intent-to-purchase studies are perhaps the most useful indicators of the impact of sponsorship on future sales. Bassing America is a membership organization of 55 000 fishermen. A key to the organization’s success in attracting and retaining sponsors is the research which Bassing does each year concerning its members’ purchases and intentions to purchase: Bassing tries to find out what members own by brand, what they have purchased by brand, their intent to purchase by brand and when they anticipate buying. The information is compared to prior years’ results (looking back three or four years) to determine if sponsor’s products are being supported. Findings are especially helpful when contract renewals are near. The results show sponsors how involvement with Bassing has increased their sales. For example, one annual survey showed that 15 percent of members owned a Ranger boat and another 21 percent said they intended to purchase one. Four years later, 27 percent owned and 43 percent intended to buy a Ranger boat. (IEG, 1990)
Measuring impact on sales The most desirable measure from a sponsor’s perspective is the impact that a sponsorship investment has on sales. Sales objectives may be expressed in three ways. First, they may be accomplished by boosting traffic at retail points of sale: Coca-Cola uses sponsorship to gain prime retail display space. The axiom in the soft drink business is that if product goes on the floor, it sells. When Coke plans an event-themed promotion, it estimates the amount of incremental cases it will sell, factors in a profit ratio per case, and evaluates its return based on actual sales and the amount it spent on rights fees. For example, through its ties with NASCAR, Coke saw incremental sales of 30 million commemorative bottles and placement of 20 000 vending machines and point-of-purchase displays — bearing NASCAR themes — in retail outlets such as Home Depots and Wal-Marts. (IEG, 1999b)
DeWalt Industrial Tool cosponsored a NASCAR Winston Cup team. They displayed the cars and drivers at major retailers, such as Home Depot and Lowe’s, who stocked their products. As a result of the visits, these stores featured the DeWalt products. The company’s marketing manager reported this increased visibility typically led to a 30% sales increase during the promotion period. He regarded TV exposure in race broadcasts as ‘icing on the cake. It is new business
Measurement of sponsorship effectiveness in sport
279
from incremental shelf space that justifies the cost of the sponsorship ’ (IEG, 2002b, p. 8). A less direct method of evaluating the impact of a sponsorship on retail points of sale is to compare the number of retailers or dealers participating in the sponsorship-themed promotion with the number who typically participate in a nonsponsorship promotion. This may involve tracking the number of outlets carrying their brand, or measuring incremental increase in displays at the point-ofpurchase. An associated form of sales objective may be to produce targeted new leads: Xerox Corporation sponsored professional golf tournaments at which their managers entertained clients. Managers completed reports, three, six and nine months after an event estimating the impact the event had on client orders. (McCarthy, 1991) Ameritech Corporation received $20 million–$25 million in new business each year from its title sponsorship of a senior PGA Tour stop. The company entertained 200 CEO-types and 3000+ customers during event week; they alone represented about $6 billion in business. The company surveyed account executives to tally leads and new sales from the event (IEG, 1999b).
The third form of sales objective is an actual increase in sales associated with a sponsorship. There are two primary ways to track sales gains. The first is to tie sales directly to the sponsored event by tracking the redemption of coupons or ticket discounts given with proof of purchase: Burroughs Wellcome Company experimented with a women’s tennis sponsorship to market a new sunscreen lotion. By distributing coupons at the venue and tracking how many were redeemed, the company found that the tennis events effectively reached the target audience of upscale women aged 30 years and over. In the following year, the company expanded its sponsorship to 12 major tournaments based on those results. (IEG, 1999b) Bell Cellular Incorporated co-sponsored events such as the Cadillac Golf Classic. To prompt attendees to subscribe on site, Bell Cellular offered coupons worth $110 off the first year’s bill. In one year, they signed up 1675 new subscribers accounting for nearly $1 million. (Lavelle, 1991)
The alternative way used to measure increases in sales is to compare sales for the two or three month period surrounding the sponsorship to sales during a comparable period. The comparable period may be the same months in the previous year, or a similar period at another time of the year, if sales of the brand are not seasonal: The Guinness company sponsored the 1999 Rugby World Cup. The company measured the impact of the sponsorship by comparing sales figures during the October/November time period when the event was held with sales in the same time period in the previous year. The percentage increases reported included: France 37%, Australia 20%, South Africa 24%, Great Britain 17%, Dubai 71% and Malaysia 200%. (Rines, 2002) General Nutrition Centers sponsored numerous events connected with their 2500 stores. Typically in return for sponsorship, they offered a 20% discount on event entry fees that brought people into the stores. A computerized tracking system in the cash registers of all company-owned stores measured traffic before, during, and after an event and tracked increases over the same-period same-store levels from the previous year. For example, General Nutrition Centers provided $2000 sponsorship to the Los Angeles Marathon Bike Tour. The discount entry opportunity brought in approximately 200 incremental customers, which, given an average purchase of $20 per visit, provided a two-to-one return on investment. (IEG, 1995)
280
J. L. Crompton
Conclusion From the perspective of a sport manager, evaluation of sponsorship effectiveness has two purposes. First, it provides a measure of a sponsorship’s value. Sponsorships sometimes are dropped not because they do not have value, but because no one has actually measured the value. Evaluation answers the question: What did the sponsoring company achieve in relation to what it said it wanted to accomplish in its objectives? If the objectives were not fully met, then there needs to be a reappraisal by the sport organization of what should be done to improve the results and deliver the value a sponsor expected. The second purpose is that evaluation research provides the sport manager with information that can be used in sales presentations to future potential sponsors. As pressure on companies increases to demonstrate the return on sponsorship investments, many of them are likely to look to sport managers for the expertise to undertake evaluation studies. Increasingly, companies are requiring proposal packages seeking their support to include evaluation measures. As sponsorship has matured, there has been a progression in the benefits companies prioritize, moving from awareness through image enhancement, demonstration platform, hospitality opportunities and product trial to sales increases. In the 1980s and early 1990s sponsorship was viewed primarily as an alternative to advertising and as a way of obtaining media exposure. The primary benefits sought often were limited to visibility and image. For these objectives, evaluation measures of media exposure, awareness and image were appropriate. However, the emphasis has shifted to focus on intent-to-purchase, product trial and sales increases. Kodak corporation were one of the first major companies to shift their focus and the comments of one of their executives is probably representative of most major companies today: As a sponsor, I look to the promoter to come to us with ideas on how the property can, in our case, sell film. We are no longer satisfied with enhanced image, give us opportunities for onsite sales, well-developed hospitality packages, dealer tie-ins etc. and we’ll listen. (Diggelman, 1992, p. 5)
This movement towards seeking to increase intent-to-purchase, product trial and sales suggests that sport managers will be required to design evaluation research that measures the extent to which these benefits are required, rather than being able to rely on the much easier measures that evaluate media exposure, awareness and image enhancement. References Crimmins, J. & Horn, M. (1996) Sponsorship: from management ego trip to marketing success, Journal of Advertising Research, July/August, pp. 11–21. D’Alesandro, D. F. (2001) Beyond the mother-in-law strategy: avoiding consumers’ indifference, Sponsorship Report, 20(6), pp. 4–5. Diggelman, R. (1992) The bottom line on sponsorship, Sponsorship Report, 11(24), pp. 4–5. Hoek, J. & Gendall, P. (2002) When do ex-sponsors become ambush marketers?, International Journal of Sports Marketing and Sponsorship, December/January, pp. 383–401. Horn, M. & Buken, K. (1999) Measuring the impact of sponsorship, International Journal of Sports Marketing and Sponsorship, September/October.
Measurement of sponsorship effectiveness in sport
281
Howard, D. R. & Crompton, J. L. (2004) Financing Sport, 2nd edn, (Morgantown, WV: Fitness Information Technology). IEG (1986) Evaluating sponsorships, Special Events Report, 15 December, p. 5. IEG (1990) Evaluation: measuring return on investment, Special Events Report, 7 September, pp. 6–7. IEG (1995) General Nutrition Centers see sales increase, seek deals, Sponsorship Report, 14(23), p. 5. IEG (1999a) Evaluation leads Coke to new sponsorship strategy, Sponsorship Report, 18(13), pp. 4–5. IEG (1999b) ROI: sponsors share how their deals pay off, Sponsorship Report, 18(6), pp. 1,7. IEG (2000) Thatlook.com sets sights on more sponsorship, Sponsorship Report, 19(15), p. 3. IEG (2002a) IEG/Performance research survey reveals what matters to sponsors, Sponsorship Report, 21(7), pp. 4–5. IEG (2002b) DeWalt strategy ensures eight-figure motorsports team title pays for itself, Sponsorship Report, 21(20), p. 8. Kolah, A. (2001) How to Develop an Effective Sponsorship Programme (London: Sport Business Group). Lavelle, B. (1991) How Bell Cellular boosted its return from events, Special Events Report, 19(12), pp. 4–5. McCarthy, M. J. (1991) Keeping careful score on sports tie-ins, Wall Street Journal, 24 April, Section B, p. 1. Meenaghan, J. A. (1983) Commercial sponsorship, European Journal of Marketing, 17(7), pp. 5–73. Meenaghan, J. A. (1991) The role of sponsorship in the marketing communications mix, International Journal of Advertising, 10, pp. 35–37 Miles, L. (2001) Successful sport sponsorship: lessons from Association Football – the role of research, Sports Marketing and Sponsorship, December/January, pp. 357–369. Pham, M. T. & Johar, G. (2000) Research on recall rates raises flags for sponsors, Sponsorship Report, 19(3), pp. 1–3. Poknywczynski, J. (2000) Sports sponsors know what they want, Sports Business Journal, 5–11 June, p. 2. Rines, S. (2002) Guinness Rugby World Cup sponsorship: a global platform for meeting business objectives, International Journal of Sports Marketing and Sponsorship, December/January, pp. 449–464. Rozin, S. (1995) Olympic partnership, Newsweek, 18 July, Special Advertising Section. Schlossberg, H. (1990) Sports marketing, Marketing News, 2 April, p. 6. Schlossberg, H. (1991) Volvo proves marketing through sport pays, Marketing News, 1 July, p. 19. Sleight, S. (1989) Sponsorship: What Is It and How To Use It (Maidenhead: McGraw Hill). Team Marketing Report (1997) Raptors arrange consumer research to show partners how their sponsorships are – or aren’t – working, Team Marketing Report, 9(9), p. 7. Ukman, L. (1992) Assertions, Sponsorship Report, 18 May, p. 2. Ukman, L. (1996) Evaluating ROI of a sponsorship program, Marketing News, 30(18), p. 14. Urbanski, A. (1992) Fast track: strategies for business success. What’s a sponsorship worth?, Newsweek, 9 November (Suppl.).