Concept Maps: Theory, Methodology, Technology Proc. of the Second Int. Conference on Concept Mapping A. J. Cañas, J. D. Novak, Eds. San José, Costa Rica, 2006
CONCEPTUALIZING PEDAGOGICAL CHANGE: EVALUATING THE EFFECTIVENESS OF THE EPS MODEL BY USING CONCEPT MAPPING TO ASSESS STUDENT CONCEPTUAL CHANGE Richard J. Iuli and Sumitra Himangshu University of Rochester, Rochester, New York 14627, USA Email:
[email protected] Abstract. The research presented here is from a three-year study that uses concept mapping to assess change in student conceptual understanding in science at the undergraduate level. The fundamental question being addressed is, “To what extent do pedagogical changes such as adaptation of an environmental problem-solving (EPS) model influence student understanding in undergraduate science?” This study is part of a National Science Foundation (NSF)-initiative to improve the teaching of science at the undergraduate level, and to study changes in teaching practice and student learning that result from this improvement. NSF-funded regional summer workshops (RWP) trained 400 faculty in facilitating local environmental problem-solving experiences, field/laboratory exercises, and cooperative learning environments for students at their home universities. One and two years following workshop attendance, eight faculty members were selected from this pool of attendees for in-depth analysis of student learning in a selected course they taught. The study used qualitative and quantitative analysis of concept mapping data to assess student conceptual understanding across a wide range of institutions and academic disciplines. The sample population consisted of a total of 79 students, 59 science majors and 20 non-majors. Results suggest that the adaptation of the EPS model was effective in increasing student conceptual understanding, as measured by concept maps. The greatest determinant of increased conceptual understanding over the course of a semester was the student’s self-report of approaches to learning and studying. Approaches to learning, in turn, were reflective of differences in the quality of student concept maps. Concomitantly, the student concept maps reflected student gains in content and depth over a semester with respect to an expert map. The results also suggest that teaching styles, particularly the level of faculty-student interaction, are associated with student gains in depth of understanding.
1 1.1
Introduction Regional Workshop Project (RWP) and its Goals
This study is tied to a National Science Foundation (NSF) – funded national dissemination project – The Regional Workshops Project (RWP) that sought to train 400 undergraduate science, technology, engineering, and mathematics (STEM) faculty from across the United States. The RWP aimed to train faculty who 1) Create and deliver undergraduate STEM courses using environmental problem-solving as an integrative, challenging, effective way to engage students in undergraduate STEM courses, 2) Use concepts and field/laboratory techniques suitable for teaching undergraduates how science is done in the real world, and 3) Use research-based knowledge of how to assess student learning and support faculty capacity for development. Using local environmental problems, the RWP Model provides faculty with techniques and practices to improve undergraduate STEM instruction and thereby enhance contexts for STEM education. 1.2
Assessing Student Achievement (ASA) Project
The present study compared classroom observations of pedagogy with concept mapping as an assessment tool to study the effect of faculty teaching methods in undergraduate science courses on student learning. To this end, students in selected courses at colleges and universities across the United States were chosen for in-depth analysis of change in conceptual understanding over the course of a semester. Individual concept maps were analyzed to determine whether students had integrated new science concepts with existing concepts and improved in depth of conceptual understanding. As student learning is dependent on the goals of the instructor, the researchers also compared student maps with respective faculty maps to determine the instructor’s learning goals and analyze the extent to which the students achieved the instructor’s goals. 1.3
Environmental Problem-Solving Model
The objectives of this study was 1) to examine teaching methods, classroom culture, and student learning in undergraduate science courses taught by RWP faculty who adapted an Environmental Problem-Solving (EPS) approach to teach undergraduate STEM courses, and 2) to examine how innovative teaching approaches interact with individual and classroom variables to affect change in student conceptual understanding in science. Environmental Problem-Solving (EPS) is a model for science education that melds classroom instruction, field and
laboratory techniques, and cooperative learning (Haynes, 1991). The EPS model has been used successfully for undergraduate and graduate courses in biology, chemistry, geology, engineering, and environmental science across the United States. The RWP uses environmental impact analysis as a unifying theme to bring together the disparate techniques used by participants into a holistic, relevant problem-solving context. This provides a model to teach undergraduates how science is really done (learning and applying knowledge in a problem-solving context, “handson”, teamwork) while students work to address real, local environmental problems. Adaptation of the EPS model and subsequent student conceptual understanding is expected to vary depending on which key factors are in place in a particular classroom. Conceptual learning is encouraged through problembased activities that require critical thinking. However, the degree to which activities requiring critical thinking are applied can depend on faculty beliefs as well as institutional structure. In addition, individual students will differ in individual receptivity to assignments requiring critical thinking skills (Kinchin, 2000). By analyzing interview and observational data, and subsequent concept maps created from this data, the current research addressed the extent to which a discrepancy exists between faculty expectations for students and actual student learning outcomes when a science course is adapted to follow an EPS-based model. 2 2.1
Theoretical Perspectives Concept Mapping as a Research Tool
Competence in a domain of knowledge is defined by knowledge that has highly integrated structure around central concepts (Glaser and Bassok, 1989). Concept maps are visual representations of meaningful relationships between concepts and linking propositions. They offer an effective way by which to assess student understanding by providing evidence of the quality and accuracy of propositions applied by the individual in the process of higherorder thinking. Concept maps provide a “workable representation” of knowledge and can be used to infer accuracy and depth of knowledge. Since expertise in a knowledge area is represented by the interconnectedness of knowledge, we chose to construct expert concept maps from structured interviews with faculty participants. We used each faculty map as a benchmark representing key concepts and expectations emphasized in the target undergraduate STEM course. We then compared student concept maps to faculty maps at the beginning and end of a semester in order to assess change in student conceptual understanding compared to expert organization of knowledge (Ruiz-Primo et. al., 2001). In addition, we assessed the quality of individual student maps, based on qualitative criteria, in order to evaluate changes in content, accuracy, depth of understanding, and organization of knowledge from the beginning to the end of each course. 2.2
Meaningful Learning
The value of using concept mapping to assess change in conceptual understanding is based on the idea of meaningful learning. Within science education, it is widely accepted that prior knowledge is a key factor that influences learning (Clifton and Slowiaczek, 1981). Meaningful learning, originally proposed in Ausubel’s assimilation theory (1963), is in direct contrast to rote learning and involves an act of relating new knowledge to relevant concepts and propositions that are already known. Meaningful learning also involves the ability to link new concepts and their meanings to broader and more comprehensive concepts. In order for meaningful learning to occur, instructional methods have to discourage rote learning by stimulating critical thinking. 2.3
Problem-Based Learning-EPS Model
EPS courses are expected to facilitate high quality learning experiences through meaningful, problem-based activities. Problem-based learning environments center instruction around a unifying theme or problem that is relevant to the local community. Structuring science courses around a relevant problem to be solved allows students to see connections to the “real world” and experience science as it is actually practiced. Problem-based learning activities may include a series of integrated field and laboratory exercises, individual assignments addressing local environmental problems, and student written or oral presentations on their findings. The EPS environment provides an interactive setting for students to discuss, debate, build, and present their understanding and hear the perspectives
of their peers. As students work together solving problems, ideas are shared and refined, and the experiences translated into robust, usable knowledge (Brown, Collins & Deguid, 1991). Group collaboration allows students to negotiate, reflect upon, and evaluate each other’s understandings. As students gain more control in the learning process, they begin to participate consciously in the classroom-culture. Through “problem solving under adult guidance or in collaboration with more capable peers” (Vygotsky, 1978, p. 86), students make meaningful connections and their conceptual understanding develops. Meaningful learning, originally proposed in Ausubel’s assimilation theory (1963), involves an act of actively relating new knowledge to existing concepts. The teaching-learning environment present in undergraduate science courses represents a broad range of potential influences on student learning. Aspects of course design and organization, teaching and assessing course content, staff-student relationships, and individual variables present in a particular student cohort interact to affect student-learning experiences (Entwistle et. al., 2002). Course design and organization can impact level of student engagement and interest as well as depth of understanding of key concepts. Likewise, teacher beliefs and subsequent methods of practice will affect implementation of course content and the development of supportive student-teacher relationships. Individual differences in student approaches to studying, as well as disparate environments and prior knowledge and skills, can influence student receptivity to course contexts. Finally, sustainability of change in teaching practices depends not only on faculty attitudes and perceptions of disciplinary and student variables, but also require departmental policy and priorities compatible or aligned with the reform (Coburn, 2003). 3
Methodology and Materials
Our research design employed a mixed-methods approach to examine the extent of implementation of EPS techniques and their resulting impact on student learning using a select group of faculty participants varying by region, type of institution, and academic discipline. Faculty chosen for participation were selected from a pool of RWP participants. Student and faculty interviews, classroom observation data using the Reformed Teachers Observation Protocol (RTOP, Sawada & Pinburn 1999), concept maps, and questionnaires measuring student learning and studying approaches (LSQ, Entwistle et. al., 2002) provided a rich description of the teaching-learning environment in faculty participants’ classrooms. Site visits were conducted at the academic institution of each participant faculty for one or two semesters (Table 1). Each group of students enrolled under a participant faculty in a given semester was defined as a cohort. Some of the participant faculty taught the same course during different semesters or in different years and so had more than one cohort of students. Each cohort was visited at the beginning and end of their semester. Prior to each visit, the LSQ was administered to each cohort of students to provide information on individual approaches to studying. The differential between the deep and learning strategies reported on the LSQ was used to group students as deep, mixed or surface learners. Student participation in the study was voluntary. All students in a given cohort were administered the LSQ by their faculty, but not all students chose to participate in the study. Faculty interviews were conducted during the first site-visit to generate an expert map based on the faculty’s curricular goals for their student cohort. Classroom observations were conducted using the RTOP. Student conceptual understanding was measured using concept maps, constructed by the authors using data from semi-structured interviews with students. Student maps reflected levels of understanding of key concepts and concept relationships as identified by each faculty. For a detailed description of methods and techniques used for construction and analysis of concept maps, refer to Cassata & Himangshu (2005). Two different researchers individually generated a subset of the maps to ensure inter-rater reliability. In addition, each map was scored using a set of criteria agreed on by the members of the research group. The reliability of scoring was established by calculating Crohnbach’s alpha coefficient, for terms, misconceptions, and cross-links, on student maps, scored independently by two researchers. A high degree of correspondence of inter-rater consistency was observed (0.83 – 0.90) between the pre- and post-student maps. The scoring rubric considered data that related to students’ understanding (or lack) of relationships between concepts. The validity of the student concept maps was reflected in the high correspondence (>95%) between verbally expressed declarative knowledge (data from student interviews) and the researcher-generated maps for each student. In addition, faculty maps were
checked with individual faculty to ensure accurate representation of faculty curricular goals. Data from both qualitative and quantitative analyses was then compared and analyzed using SPSS 13.0 software. 4
Results
The sample population consists of 79 students from 11 classrooms taught by seven different faculty, of which 59 (75%) were science majors (including biology, chemistry, and environmental science) and 20 (25%) students were non-majors.
Number FACULTY
of
STUDENT
DISTRIBUTION
Students
BY
LEARNING
STYLES
(Number of Cohorts) Faculty A (2)
Deep Approach (%) 6
Mixed Approach (%)
Surface Approach (%)
(N) 17
59
35
Faculty B (2)
13
23
77
0
Faculty C (2)
9
0
100
0
Faculty D (2)
19
10
68
22
Faculty E (1)
7
0
57
43
Faculty F (1)
4
0
50
50
Faculty G (1)
10
100
0
0
Table 1: Distribution of Student Learning Styles by Faculty
Table 1 summarizes the distribution of student learning strategies for different cohorts, as reported on the LSQ. Two out of eleven cohorts had only mixed and surface learners (E & F) whereas both B cohorts had no surface learners and both A & D cohorts had all three groups of learners. Students in cohorts B, C and G tended to use significantly fewer surface-level learning strategies since these cohorts had no surface-learners but consisted of deep and/or mixed learners (Table 1). Students in cohorts A, D, E and F on the other hand, were evenly distributed by mixed and surface learning approaches and tended to use surface-level strategies to a greater degree. This correlated to the analysis of student post-maps for each cohort (Table 3). Each class was examined on dimensions of instructional strategies and activities, integration of new concepts into familiar contexts, level of student-student and student-teacher communication, encouragement of active student participation, and level of support provided by teacher to enhance student investigations. As shown in Table 2, comparison of the classrooms on the variables of interest revealed that all faculty incorporated aspects of the EPS model to differing degrees in their teaching practice, by 1) connecting concepts to “real/local” issues, 2) providing a highly or moderately interactive setting where student input was encouraged, and 3) by emphasizing peer collaboration as an integral part of the course. Student concept maps were compared with expert (faculty) maps to measure change in depth of understanding over a semester. Concept maps were analyzed for attainment of main ideas, presence or absence of misconceptions, tendency to make connections between concepts, and level of conceptual organization. Table 3 gives a summary of preliminary results highlighting that the majority of students in each cohort attained the main ideas of the course as specified by individual faculty.
Faculty A (Environmental Science)
Faculty B (Environmental Science)
Instructional Strategies Use of website
Use of website, whiteboard, video and power point
New Concepts
Student to Student Communication Occasionally, teacher-facilitated
Teacher to Student Communication Prompting students to express ideas in class, working with students on projects outside of class
Related current events (relationship between community and environment, emphasized merits of education vs. enforcement) to course content Related content with a variety of relevant examples
Regularly, through discussions in class and in-class group projects
Relaxed but focused atmosphere, stimulates and facilitates discussion in and out of class
Regularly, through discussions in class and in-class group projects
Related current events (Clean Air Act, EPA rules) to course content
Teacher Encouragement Helps students continue and expand on thoughts, asking students to express personal views based on actual environmental data Encouraged students to express different viewpoints on environmental issues, guides students toward logical conclusions
Teacher Support Uses several examples of actual data to clarify points (from EPA website)
Relaxed but focused atmosphere, stimulates and facilitates discussion in and out of class
Encouraged students to come up with their own answers, guided group discussion
Encouraged students to use the web to find information and share during group work Participated as a resource person to guide student questions
Uses examples relevant to everyday life (leaky mitochondria and runners’ wall) Uses examples (draws figures on board)
Faculty C (Biology)
Use of Power point and blackboard
Faculty D (Biology)
Use of Power point and blackboard
Used a interrelated framework to explain organ functions
Regularly through group lab projects
Relaxed atmosphere, encourages questions
Faculty E (Analytical Chemistry)
Use of Power point and blackboard
Related to standards for Chemical Society
Occasionally, teacher-facilitated
Focused atmosphere, faculty encouraged alternate modes of thinking
Faculty F (Environmental Chemistry)
Use of website and blackboard
Related to local events (Paper Mill; Hurricane in NC)
Occasionally, teacher-facilitated and through group lab projects
Limited discussion during project work
Prompted students to express ideas regarding local environmental issues
Faculty G (Environmental Science)
Use of Power point and white board
Used examples and connected concepts
Faculty encouraged interpretation of evidence, alternate solutions
Relaxed atmosphere, faculty was patient and clarified student questions
Encouraged students to think aloud through their answers
Uses several examples of actual data to clarify points (from USDA and Canadian agricultural department)
Uses several examples of actual data to clarify points (from ACA website) Uses several examples of actual data to clarify points (regarding local Paper Mill) Used local examples of pollution (ASARCO)
Table 2: Level of Faculty Interaction as Measured by Classroom Observations and RTOP
Analysis of student maps suggests that the quality of maps correlated to student approaches to learning and studying, as measured by the LSQ. Average gain from beginning to end of semester in number of terms and linkages between concepts was calculated. Student-cohorts A and D (Table 3), largely using a mixed approach to studying, incorporating surface and deep strategies, showed the greatest improvement at 70% in overall quality of conceptual understanding between pre- and post-test (Table 3). However, when grouped with cohort G, which consisted of
100% deep learners (Table 1), only 60.87% of the moderately-high cohorts showed improvement in quality of postmaps. This is due to the pre-maps of the deep learners in cohort G already having good organization and linkages between the concepts. Consistently, student maps from cohorts E and F using a greater degree of surface approaches to learning showed only 54% of overall improvement in map quality (Table 3). Cohorts from the highly interactive faculty (B & C) that had no surface learners (Table 3) showed maximum gain in content and depth of understanding represented by the quality of their post-maps (Table 3).
Student Cohorts Belonging to Faculty:
Level of Faculty Interaction
% Students with Main Ideas
Student Number (n)
% Students with Misconceptions
% Students with Improved Organization
Average Gain in Links (%)
Average Gain in Terms (%)
% Surface Learners
B&C
High
22
86
34
62.5
29
22
0
A&D &G E&F
Moderately High Moderate
46
85
19.5
60.87
18
15
22
11
81.5
21.5
54
15
15.16
41.5
Table 3: Correlation of Student Post-Maps with respect to Faculty Teaching Style
In addition, student concept maps were analyzed in comparison to faculty maps. Students of Faculty A, D, E and F on the whole, demonstrated lower gains in conceptual understanding, measured by gain in number of links between concepts from beginning to end of semester, compared to students of Faculty B and C. Students varied in the degree to which their conceptual understanding paralleled that of the expert map.
ENVIRONMENTAL CHEMISTRY
PEOPLE can
can be used to
affect
ENVIRONMENT
CFC's
by POLLUTION
GASOLINE caused
by
RUN-OFF FROM PESTICIDES & TOP SOIL
FACTORIES
due
to
cause
which can reduce SAFE DRINKING WATER SUPPLY
can lead to
pH LEVEL OF WATER
KILLING EVERYTHING IN WATER
CO2 AND CO
can
STRIPS
released into
increases
ACID RAIN
kill
FORESTS
OZONE LAYER
LOW LEVEL CLOUDS resulting in
KEEPING ALL OF THE HEAT IN THE EARTH
ATMOSPHERE
causing
can
POOL KITS
which enter
released into
measured using
including FISH & WILDLIFE LIVING IN LAKES & STREAMS
releases
INCREASING HUMAN POPULATION
BURNING CHEMICAL S
which enter
causes
by
affected by
DUMPING WASTE INTO STREAMS can
burned LARGE NUMBERS OF CARS
INDIVIDUALS DUMPING WASTE
STAGNANT WATER
FIX DAMAGE HUMANS HAVE CAUSED
used for making
which causes GLOBAL WARMING
SMOKE IN CITIES which can affect PEOPLE'S RESPIRATORY HEALTH
pH METER
yield
DIFFERENT RESULTS
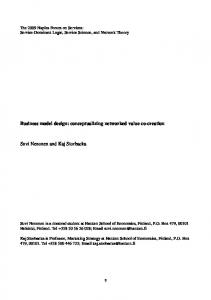
Figure 1. Example of a student pre-map from cohort F showing a misconception regarding pH and acid rain. The different colors correspond to commonality of concepts with respect to cohort F’s expert map (not included)
Gain in understanding was represented by the difference between the percent of student linkages with respect to the faculty map from the beginning to the end of the semester. The maximum gain observed in this cohort was 29% from pre- to post-test. Between types of classes, students in highly interactive classes tended to exhibit a higher percentage of gain than students in moderately interactive classes. The apparent high degree of misconceptions in student maps from the highly interactive cohorts is due to a third of surface learners in this cohort that were using mainly surface strategies for learning (Table 3). In comparison, equivalent degrees of the moderately-high
interactive cohorts (19.5%) and moderately active cohorts (21.5%) showed presence of misconceptions although only a fourth of that population used surface-level approaches to learning (Table 3). According to the RTOP analysis (Table 2), all seven faculty facilitated open communication with the students through class discussion, group work, teacher proximity to students, and individual student-teacher interactions. In addition, all seven faculty related course material to real-world applications by using visual tools such as power point presentations as an interactive medium of instruction. In addition, all seven faculty emphasized critical thinking through adoption of the scientific process to assignments and classroom activities. In summary, all seven faculty applied some aspects of the EPS model to their teaching practices. Analysis of student maps in comparison to faculty maps reflected gains in number of concepts as well as depth of understanding (represented by linkages between concepts) between pre- and post-concept maps for the majority of students. Statistical analysis was conducted to calculate Pearson’s correlation coefficient for the relationship between the change in terms and change in links between student pre- and post-concept maps found a strong positive correlation (r (77) = 0.926, p