Beckman Research Institute of the City of Hope, 1450 East Duarte Road, Duarte, CA 91010-0269. Contributed by Susumu Ohno, August 8, 1989. ABSTRACT.
Proc. Nati. Acad. Sci. USA Vol. 86, pp. 8452-8456, November 1989 Evolution
Concordant evolution of coding and noncoding regions of DNA made possible by the universal rule of TA/CG deficiency-TG/CT excess (intrinsic evolution/symmetry/universal rule)
TETSUYA YOMO AND SUSUMU OHNO Beckman Research Institute of the City of Hope, 1450 East Duarte Road, Duarte, CA 91010-0269
Contributed by Susumu Ohno, August 8, 1989
ABSTRACT The universal rule of TA/CG deficiencyTG/CT excess previously proposed as the construction principle of coding sequences applies to noncoding regions of the gene as well. Analysis of a 1989-base-long gene sequence for mouse immunoglobulin y2 heavy-chain constant region as well as the 19,002-base-long gene sequence for human serum albumin revealed deficiency and overabundance of very similar sets
entire genes, including introns and 5' and 3' noncoding regions. The most recent release of the GenBank data base (May 1989 update) contains 27,242 base sequences. However, those containing sufficient lengths of 5' and 3' noncoding regions, as well as complete sequences of all introns, constitute only a small fraction of the total. Nevertheless, this small fraction is substantial in absolute numbers. After sampling divergent sequences in this fraction, we have chosen two genes as examples in the present study: the 1989-base-long mouse immunoglobulin heavy-chain Y2a constant region (Y2a CH) gene (4) and the 19,002-base-long human serum albumin gene (5).
of base trimers and tetramers in the coding and noncoding regions of the same gene, in spite of the fact that noncoding regions were considerably richer in A+T. Inasmuch as this universal rule does not discriminate one strand of DNA double helix from another, two complementary DNA strands of the entire gene maintained nearly perfect symmetry. That is to say, the degrees of excesses, deficiencies of the 64-base trimers remained nearly identical between two complementary strands, and this symmetry was only slightly disturbed in the coding region. It would thus appear that the universal rule as an intrinsic force has been exerting far greater influence than natural selection in the evolution of genes.
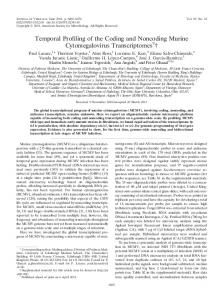
The 990-Base-Long Coding and 999-Base-Long Noncoding Regions of Mouse Immunoglobulin 'YUa CH Gene The complete published sequence of the mouse immunoglobulin y2?, gene began with a 248-base-long 5' noncoding region followed by four exons (CH1, hinge, CH2, and CH3), interrupted by three introns, and ended in a 222-base-long 3' noncoding region (4). Fortunately, the sum of four coding regions encoding 330 amino acid residues was almost identical in length with the sum of five noncoding regions; 990 bases versus 999 bases. In Fig. 1, the total coding region and the total noncoding region were analyzed as separate entities, for as doublestranded DNA, GC/AT ratios of the two showed the inverted relationship. The coding region was G+C-rich (52.7%), whereas the noncoding region was A+T-rich (52.9o) in almost the same proportion. When dealt as a single-stranded sense strand, four bases in the order oftheir abundance of the former were C, A, G, and T, whereas this order in the latter was changed to A, C, T, and G. As shown at the top of Fig. 1, the coding region demonstrated the customary TA/CG deficiency and TG/CT excess. In addition, however, there were peculiarities unique to this particular coding sequence. Compared to the severity of CG deficiency (22% the expected amount), TG and CT were rather mildly in excess (167% and 132% the expected amounts). Accordingly, CA among the dimers having C as the first base and AG among dimers having G as the second base also occurred in excess (124% and 122%) to compensate for the severe deficiency of the CG dimer. Among four base dimers having T as their first base, in sharp contrast, 167% excess of TG amply compensated for the milder deficiency of TA (48% the expected amount). However, the TT dimer was also mildly deficient (61%) and was compensated for by a slight excess of TC (123%). Among the four dimers having A as a second base, TA deficiency, in this instance, was compensated for by a mild 124% excess of CA dimer.
It was previously shown that coding sequences of diverse organisms are constructed that obey the universal rule (1). This rule is elaborated here as follows: (i) Regardless of their base compositions, long enough coding sequences show a gross deficiency of two base dimers-TA and CG. (ii) Among the four base dimers having T as their first base, this TA deficiency is always compensated for by an excess of TG. As TG is also one of the four base dimers having G as the second base, TG excess also compensates for a deficiency of CG. (iii) Among the four base dimers sharing C as the first base, it is the CT dimer in excess that compensates for deficiency of CG. (iv) In the case of the four base dimers having A as their second base, however, deficiency of TA may be compensated for by excesses of any or all of the remaining three base dimers-CA, GA, or AA. Because of the CT/TG excesses noted above, CTG almost invariably becomes one of the most numerous base trimers in divergent coding sequences, provided that they are of rather balanced base compositions. In fact, CTG has been shown to be the most numerous base trimer in the entire Escherichia coli genome (2). It is a small wonder that CTG serves as the most frequently used of the six leucine codons in E. coli as well as humans (3) and that leucine is one of the most consistently abundant amino acid residues in proteins of diverse functions. In many of the eukaryotic genes, coding sequences are interrupted by introns. In this paper, we now show that the above universal rule, in fact, governs the construction of The publication costs of this article were defrayed in part by page charge payment. This article must therefore be hereby marked "advertisement" in accordance with 18 U.S.C. §1734 solely to indicate this fact.
Abbreviation: CH, heavy-chain constant region.
Abbreviation: CH, heavy-chain constant region. 8452
Evolution: Yorno and Ohno
Proc. Natl. Acad. Sci. USA 86 (1989)
MOUSE IG Y2A CH GENE (1,989-BASES) TOTAL CODING: COl. HINGE. 012. CH3 (990-BASES) GC: 52.61 G: 235 (0.237) A: 274 (0.277) C: 286 (0.289)
15 (68) L: 99 (83) 1. 19 u68
74 (56) a: 98 (79) 72 4464
L,77 T;7
(46)
47 77 (46) :
a:79 -1.22
T: 195 (0.1977)
(56)
- :15 (68) 2
23 (38)
T A: 26 (54)
,:64
(65)
1.14
+3 69 (56) ZZ.LA
: 26 (54) , 98 (79) LA: 72 (64) 0: 78 (76) 1.22 G47.8 1.12 1.T 4 TOA aCDI~ L1 24-AE_3ITOS '22-AE 99RSS C 71 G: 213 (0.213 T: 234 (0.234) C: 258 (0.258) A: 294 (0.294)
2 a: 82 (60)
L
96 (76)
":
78 (67)
i:
92 (63)
": 1.24
62
T.-6
&I: T.-M
57 (45)
L,{, 1. 24
62 (50)
":
72 (60)
":
2 (55)
D04
1.16
&A: U--4
2 (55)
ZILI
(50)
J_.:
0.93
1.20
51 (55)
C71
49
(69)
A
a 96 (76)
T416
TOP 10 BASE TRIMERS CODING 1. C C A 35 2. C A G 33 3. C T G 29 4. T G G 29 5. A G A 28 6. C C T 28 7. A C A 27 8. C T C 26 9. T C C 26 10.G T G 26 A A G 22 A G G 14 A G C 21 C A C 24
,", 70 ,63) 1. 11
NONCODING 30 (3) 31 (1) 24 17 31 (2) 27 (5) 26 (7) 25 (9) 23 9 28 (4) 27 (6) 26 (8) 25 (10)
AA 79 (86) 0. 92 BOTTOM 10 BASE TRIMERS CODING 1 64. C G C 2 63. G C G 3 62. C G T 4 61. C C G 4 60. T C G 4 59. T T A 4 58. T A T 4 57. T A G 4 56. T T G 5 55. A C G 5 54. C G A 5 53. A T A 6 C G G A G T 16 T A C 11
,:I 0.
49 (69)
NONCODING O (64) O (63) O (62) 1 (60) 1 (59) 5 (56) 10 (54) 12 13 O (61) 1 (58) 21 1 (57) 8 (55) 10 (53)
FIG. 1. Base dimer and trimer analyses of 1989-base-long mouse immunoglobulin Y2a CH gene (4). The coding regions represented by four exons are compared with the noncoding region of 5' and 3' flanking regions and three introns. Base composition of each is shown in numbers and fractions (in parentheses) of the four bases. Shown immediately below are four sets of 4 base dimers; the first set of 4 share C as their first base, the next 4 share G as the second base, the third set share T as the first base, and the last 4 share A as the second base. The observed number of each base dimer is accompanied by the expected number (in parentheses) and the observed/ expected ratio is also shown immediately below each base dimer. Each set of 4 dimers is arranged from the left to right in order of most overrepresented to most underrepresented. The base dimers that were 125% in excess are underlined by thick solid bars, while those that were in excess to lesser degrees are marked by progressively thinner solid bars. Those base dimers that were 70% or more deficient, on the other, are underlined by open bars. (Bottom) The 10 most numerous base trimers (Left) as well as the bottom 12 base trimers (Right) found in the coding region. The ranking and actual number of each base trimer are shown to its left and right, respectively. Also shown are rankings and actual numbers of corresponding base trimers in the noncoding region. Inasmuch as the concordance between the coding and noncoding region was not 100%1, the remaining members of the top 10 and bottom 12 base trimers in the noncoding region are also shown accompanied by numbers of their counterparts in the coding region.
As shown in the middle of Fig. 1, the universal rule of TA/CG deficiency-TG/CT excess applied equally well to the noncoding region. CG deficiency (only 4% the expected amount) was even more severe, whereas TA deficiency (71%)
8453
was even milder than that found in the coding sequence. Comparing dimer compositions between the coding and noncoding regions shown in Fig. 1, it is noted that the rank order of four base dimers from the most overrepresented to the most underrepresented is the same between coding and noncoding regions with regard to three of the four setsthose having C and T as their first base as well as the set of four having A as their second base. Only in the set of four having G as their second base did greater deficiency of CG, combined with a marginal excess of TG in the noncoding region, change the rank order from TG, AG, GG, CG to AG, GG, TG, CG. Reflecting on the above similarity, despite considerable differences in their base compositions, coding and noncoding regions contained CA, GA, and TC dimers in nearly equal numbers. Thus, similarity between coding and noncoding regions was expected to extend to their base trimer compositions. This was, indeed, the case, as shown in Fig. 1 (Bottom). At the left, the 10 most numerous base trimers found in the coding region are listed in order of abundance. Top rankings enjoyed by CCA and CAG reflected C+Arichness of this coding region. In spite of G+T-poorness, however, CTG ranked third thanks to CT and TG excess. It should also be noted that 6 of the top 10 base trimers in the coding region also enjoyed the top 10 ranking in the noncoding region and that many of the base trimers (numbering >20) were present in nearly equal numbers in both regions. They were CAG, CCT, ACA, CTC, and CAC (shown in Fig. 1) and GAG, GAA, and TCA (not shown). Shown to the right of the top 10 base trimers in Fig. 1 are the 12 least abundant base trimers found in the coding region. It is no coincidence that all but 1 (TTG) contained either CG or TA. Fig. 1 shows that 9 of the bottom 12 base trimers in the coding region also ranked in the bottom 12 in the noncoding region. The 19,002 Bases of the Human Albumin Gene
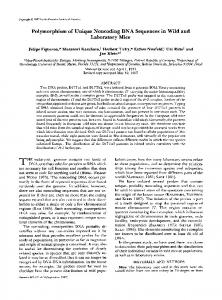
The coding region composed of 14 exons of the human serum albumin gene contained 609 codons. This large size, however, paled in comparison to 13 introns, which added up to the total of 14,127 bases. In addition, the sequenced data also included 5' and 3' flanking noncoding regions totaling 3048 bases (5). Because of the enormity of these base numbers, 5' and 3' flanking regions and introns of the noncoding region were treated as separate entities in Fig. 2. It should be noted that data in Fig. 2 are essentially a recapitulation, in greater numbers, of those in Fig. 1. Although the human albumin coding region was already A+T-rich (57%), noncoding regions were even richer in A+T; 67% for 5' and 3' flanking regions and 66% for introns. In Fig. 2, observed versus expected numbers of all 16 base dimers in each of the three entities are shown. They are vertically arranged in order from the most overrepresented to the most underrepresented, with a gap separating the least overrepresented from the least deficient. With regard to the coding region and two noncoding regions, the two most underrepresented base dimers were, again, CG and TA; CG deficiency was more acute, while TA deficiency was milder in two noncoding regions. Two base dimers, CT and TG, were again in excess in coding as well as in two noncoding regions, although to variable degrees. In addition to obeying the universal rule noted above, the coding and the two noncoding regions of the human serum albumin gene shared a number of individual peculiarities. As shown in Fig. 2, in addition to CG and TA, three other base dimers-AC, AT, and GT-were underrepresented in the coding as well as in the two noncoding regions of human serum albumin. Similarly, three of the overabundant base dimers-CT, CA, and TT-were in excess almost to the same degree in all three regions-one coding and two noncoding. The above data
Proc. Natl. Acad. Sci. USA 86 (1989)
Evolution: Yorno and Ohno
8454
HUMAN SERUM ALBUMIN GENE (19.002-BASES) CODING 14 EXONS (1,827-BASES) A: 554 (0.30) T: 487 (0.27) G: 421 (0.23) C,365 (0.20)
j5: 191
(112)
113 (84)
1.34
":
129
(97)
1.33
L: 217 (168)
1.29 153 (128) 1:
150 (130)
1.16 C 84 (73) 1.18
Lk:
142 (128)
1.11 LA:
LI:
197 (161)
j5: 1.27
508
(100)
ji:
108 (89)
I:
1.013
(871)
886
(764)
1.22
1.70
iS:
NONCODING 5', 3' FLANKING (3.048-BASES) 13 INTRONS (14.127-BASES) T: 4.928 (0.35) T: 1.047 (0.34) A: 4.324 (0.31) A: 1.013 (0.33) 6: 2.494 (0.18) G: 522 (0.17) C: 2.378 (0.17) C: 472 (0.15)
123 (111)
1.11
1.21 C : 86 1.18 L.: 394 1.17 AG: 201 1.16 ALL 202 1.13 LA: 178 1.13 LI: 391 IS:
6id:
85
(97)
96 (112)
0.86 AL:
112 (148)
0.76
AI: 83 (111) 0.75 6 0.61
(337)
CJ: 1.'15
834
(728)
(173)
LI:
943
(830)
505
(441)
1.14 (178)
59 (97)
,>: 61 (148) 0.41 : 29 (84) 0.34
1.871 (1,719)
1.09 1.445 (1.323)
LA:
177 (161)
1.09 ja: 1.09
460
(420)
82 (81)
JA:
792
(764)
791
(830)
Ad: 1.374
(1.508)
1.04
170 (173) 0.95
0.98 Il:
LI:
(356)
1.01 a:
jj:
1.14
(157)
1.10
0.87
L:
1.18
1.10
j5:
L&:
1.16
(73)
162 (178)
0.91 LI: 291 (346) 0.84 jo: 127 (157) 0.81 >: 271 (346) 0.78 11 (81) 0.14
0.91 6 T: 0.85 AS:
710
(871)
619
(728)
0.85
A: 0.83 ok 0.22
1.253 (1.508) 93
(420)
FIG. 2. The complete base dimer analysis of the 19,002-base-long human serum albumin gene (5). Because of the enormous size of this gene, the 1827-base-long coding region composed of 14 exons was contrasted with two noncoding regions: (i) the 3048-base-long 5' and 3' flanking regions, which went beyond the promoter as well as transcription terminator site; (ii) 13 introns totaling 14,127 bases. Base compositions of the three regions are shown in the same manner as in Fig. 1. Immediately below, all of the 16 base dimers of each region are shown in order from top to bottom of most overrepresented to most underrepresented. The actual number and the expected number (in parentheses), as well as the observed/expected ratio of each dimer, are shown. The always overabundant TG and CT dimers are underlined by thick solid bars, whereas the invariably most underrepresented CG and TA dimers are underlined by open bars.
indicate that coding and noncoding regions of the human albumin gene might also show remarkable similarity in base trimer composition. As shown in Fig. 1 (Bottom), there was a very strong indication of such a similarity in the shorter mouse gene. The enormous total length of this human serum albumin gene sequence warranted the detailed scrutiny of so intriguing a possibility. Shown in Fig. 3 are three pairwise comparisons of base trimer compositions between the coding region and introns, between 5' and 3' flanking regions and introns, as well as between the coding and 5' and 3' flanking regions. Comparison between two noncoding regions (5' and 3' flanking regions and introns) shown in Fig. 3b reveals that 59 of the 64 base trimers were in either the upper right square or the lower left square. Points located in the upper right square represent base trimers that are in excess in both, while those in the lower left square represent base trimers that are deficient in both. Only one base trimer (GGT) was clearly in the upper left square, while four others straddled lines separating the squares. Even this GGT overrepresented in one and underrepresented in the other, however, was very close to the center, thus signifying that observed numbers of GGT in two regions were very close to expected numbers. In short, two noncoding regions were exceedingly similar in base trimer composition. As to similarities between the
coding and one or the other of two noncoding regions, Fig. 3 a and c shows that only 8 and 9 base trimers of 64 were clearly
in the lower right square. Thus, the following 8 base trimers that were overrepresented in both noncoding regions were slightly underrepresented in the coding region-TCT, TGG, CAT, CAC, AGG, GGC, GGA, and GGG-to which GGT should be added in Fig. 3c. Not surprisingly, the last 4 base trimers underrepresented only in the coding region were four glycine codons. Human serum albumin is an unusually glycine-poor protein, only 23 of 609 residues are glycine, while there are 63 alanine residues. The virtual emptiness of the upper left square, on the other hand, indicates that none of the base trimers underrepresented in two noncoding regions is overabundant in the coding region. In view of a considerable difference in base composition between the coding (A+T; 57%) and two noncoding regions (A+T; 66% and 67%), the similarities in base trimer composition revealed in Fig. 3 a and c are truly impressive. Although not shown, we have also done three pairwise comparisons of base tetramers with essentially the same results as for base trimers. Maintenance of Symmetry Between the Two Complementary Strands
Both of the universally underrepresented base dimers, TA and CG, are palindromes. It follows that two complementary strands are destined to remain symmetrical as far as these two dimers, as well as their reciprocal dimers, AT and GC, are concerned. Inasmuch as the TA/CG deficiency part of the universal rule is inherently indiscriminate as to sense and antisense strands of DNA double helix, it is a distinct possibility that the universal rule has been enforcing symmetry to be maintained between two complementary strands of DNA. As to the two universally overabundant base dimers, TG and CT, their counterparts in the complementary strand are CA and AG. Figs. 1 and 2 reveal that with regard to noncoding regions of both mouse and human genes, these two pairs of complementary dimers on the same strand, TG and CA, as well as CT and AG, are excessive almost to the same degree. It follows that, as far as noncoding regions are concerned, two complementary strands of DNA are also maintaining symmetry with regard to CT, AG, TG, and CA dimers. Although clear symmetry is indicated only with regard to CT and AG in the coding region of the mouse as well as human genes, the top 10 base trimers of the mouse gene coding region shown in Fig. 1 (Bottom Left) includes two pairs of complementary base trimers: no. 1 CCA and no. 4 TGG, and no. 2 CAG and no. 3 CTG. Furthermore, the bottom 12 base trimers shown to the right of the top 10 also include four pairs of complementary base trimers. They are as follows: no. 64 CGC and no. 63 GCG, no. 60 TCG and no. 54 CGA, no. 62 CGT and no. 55 ACG, and no. 58 TAT and no. 53 ATA. The above were taken as a very strong indication that, in spite of evolutionary constraints imposed by natural selection, coding regions might also be maintaining a surprising degree of symmetry with their complementary strands. Because of its great size, this intriguing possibility has been tested on the human serum albumin gene in great detail. Results are tabulated in Fig. 4. In two complementary strands of a given DNA, both the observed and the expected numbers of a given trimer, such as CTG on one strand, are the same as those of its complementary base trimer CAG on another strand. In Fig. 4, 64 base trimers of sense and antisense strands of two noncoding and one coding regions were plotted as in Fig. 3. Accordingly, each pair of complementary base trimers was invariably represented as two points placed equidistant from the diagonal slope. One example is shown on the GCA/TGC pair in Fig. 4c. The point marked GCA is also the point for TGC in the antisense strand. Conversely, the point marked TGC is
Evolution: Yomo and Ohno
20.01 a * fI
Proc. Natl. Acad. Sci. USA 86 (1989) b
c
a
I
8455
20.0
10.0 .
10.0.
Z"I
-10.01
-10.0
X
-20.
-20.0
0.0 Introns
-10.0
20.0
10.0
0.0
-20.0
-10.1,0
Introns
0.0
10.0
20.0
S' and 3' flanking
FIG. 3. Three pairwise comparisons involving the coding region and two noncoding regions (introns and 5' and 3' flanking regions) of 64 base trimers. (a) Coding regions (ordinate) versus introns (abscissa). (b) The 5' and 3' flanking regions (ordinate) versus introns (abscissa). (c) Coding regions (ordinate) versus 5' and 3' flanking regions (abscissa). We defined the position in the axis (of ordinates, as well as abscissas) of each base trimer as follows: X(ijk) = {N(ijk) - [Nt x P(i) x POj) x P(k)]}/[Nt x P(i) x PO) x P(k)]'/2, where N(ijk) is the number of particular base trimer ijk in a given DNA sequence, while Nt is the total number of bases in that sequence, and P(m) is a fraction of that total represented by base m. In the above equation, (observed) - (expected) was divided not by (expected) but by the square root of (expected), which approximates the standard error of (expected). This gave different weights to various degrees of excesses as well as deficiencies exhibited by 64 base trimers within the same sequence. At the same time, however, values given to the same degree of excess or deficiency found in 5' and 3' noncoding regions and introns became roughly 1.3 and 2.8 times greater than that given to the coding sequence. This was because 5' and 3' flanking region and introns were 1.7 and 7.7 times longer than the coding sequence. This procedure managed to spread 64 points along the axis of abscissas in a-c, so that most of the points were readily recognizable and easily distinguished those base trimers that were either significantly in excess or in deficiency in both of the two sequences being compared from insignificant ones, since the latter stayed close to the center. With regard to each axis, overrepresented base trimers were placed between 0 and 20.0 and underrepresented ones were placed between 0 and -20.0. The lines were obtained by the least-squares method. Correlation coefficients (r) for a-c, respectively, were 0.667, 0.882, and 0.598, whereas slopes were 0.46, 0.47, and 0.78, and y intercepts were 0.0012, -0.019, and 0.0157. With regard to each graph, points located in the upper right square represented base trimers that were in excess in both members of the pair, whereas those in the lower left square represented base trimers deficient in both.
also the point for GCA in the complementary strand. It follows that the shorter the distance between two members of a pair, the greater the symmetry between the two complementary strands with regard to that pair of base trimers. In Fig. 4, two dashed lines are drawn parallel to the diagonal slope at a distance of 2.5 units each. The reason for the above is explained in the legend to Fig. 5b. In the case of Fig. 4 a and b, all 32 pairs of complementary base trimers are placed between the two dashed lines, thus indicating nearly perfect symmetry between complementary strands of two noncoding regions; introns and 5' and 3' flanking regions. In short, as far as noncoding regions are concerned, degrees of excesses and deficiencies of the 64 base trimers of one strand are nearly identical with those of its complementary strand. Even in the coding sequence (Fig. 4c), only members of 5 of the 32 pairs
20.01
a a
a
a
IL
Intrinsic Evolution by the Universal Rule Versus Adaptive Evolution by Natural Selection When data presented thus far are considered together, it becomes clear that coding and noncoding regions of genes are governed by the same universal construction rule of TA/CG deficiency-TG/CT excess. It is this intrinsic force that has
b
/
A
of complementary base trimers are outside the two dashed lines, the greatest distance being shown by the GCA/TGC pair already noted. Yet, in the case of 3 of the 5 pairs, including the GCA/TGC pair, both members of each pair are in the upper right square; thus, both are overrepresented in two strands. The symmetry maintained by two complementary strands of the coding region is quite remarkable.
c
,
10.0^
I
I
-0.0^ -10.0 ,. -20.0
I
Io,
-10.0
I
0.0
Sense
Introns
10.0
20.0
0.0
Sen
5' and 3'
flankog
20.0
Sense
Coding
FIG. 4. The 64 base trimers of the sense strand (abscissas) and the antisense strand (ordinates) were plotted as in Fig. 3 on introns (a), on 5' and 3' flanking regions (b), and on coding regions (c). When plotted in this manner, 64 base trimers are seen as 32 pairs of complementary
base trimers, with members of each pair occupying the points equidistant from the diagonal slope drawn from the lower left corner to the upper right corner (for example, the GCA/TGC pair in c). Two dashed lines parallel to the central slope were drawn at a distance of 2.5 units each from the diagonal slope. This is explained in the legend to Fig. 5b.
8456
Evolution: Yorno and Ohno
Proc. Natl. Acad. Sci. USA 86 (1989)
a
b
20.0
10.0I
.5
0.0
-10.0
20.0 -20.0
l -10.0
I
-l
0.0 Randomized
10.0
20.0
-10.0
0.0
10.0
20.0
hinton-like R
and
gmie- introt-like
FIG. 5. An artificial version of Fig. 3a. The coding region of the ordinate remained the same, whereas introns totaling 14,127 bases of the abscissa were replaced by a computer-generated randomized sequence of the same length and base composition as introns. Correlation coefficient r = -0.034, slope = -0.11, and y intercept = -0.001. (b) An artificial version of Fig. 4a. The same computer-generated randomized sequence of the same length and base composition as introns was used. All the points generated by several randomized sequences of the same length and base composition were distributed within the boundary demarcated by two dashed lines drawn parallel to the diagonal line, each distanced 2.5 units from it.
been maintaining the base sequence of noncoding regions in unity with coding regions. In the case of the human serum albumin gene, the sum of 13 introns exceeds the total length of 14 exons by nearly 10-fold. Yet, noncoding regions remain quite similar to coding regions in composition of base trimers and even base tetramers. This is despite the fact that noncoding regions are considerably richer in A and T than coding regions. The significance ofthis similarity between the coding and noncoding regions of the serum albumin gene shown in Fig. 3 a and c can best be appreciated by comparing Fig. 3a with Fig. Sa. For Fig. Sa, introns of Fig. 3a totaling 14,127 bases were substituted by a computer-generated randomized sequence of the same length and base composition on the abscissas. Because of the enormity of the length involved, several computer-generated sequences have very similar trimer compositions. Base trimers of this randomized sequence were plotted in relation to those of the albumin coding region. The total absurdity of Fig. Sa, as indicated by its correlation coefficient of -0.034, attests to the extreme significance of Fig. 3a. In spite of overabundances and deficiencies of many base trimers, the two complementary strands of the noncoding regions maintain nearly perfect symmetry. Furthermore, this symmetry is disturbed only slightly in the coding regions. The latter was a surprise, for only one of the complementary strands in the coding regions has been under surveillance by natural selection. As to the significance of the observed symmetry between complemen-
tary strands of the human serum albumin gene, Fig. 4 should
be compared with Fig. 5b. In Fig. Sb, base trimers in two complementary strands of the computer-generated randomized intron-like sequence used for Fig. Sa are plotted. Because of the enormity of length involved, nearly all of the 64 base trimers occur very close to their expected rates. Accordingly, all the points are clustered around the center and remain largely within the boundary of the two dashed lines. The type of symmetry between complementary strands shown by a long randomized sequence of Fig. 5b is, indeed, very different from that shown in Fig. 4. Thus, it appears that as far as evolution of DNA base sequences is concerned, the universal rule as an intrinsic force has been exercising a far greater influence than natural selection. This is no surprise when the inherent paradox in the role of natural selection on gene evolution is recalled. A gene encoding a functionless protein shall forever be ignored by natural selection. It follows that the initial acquisition of a function by a newborn gene has to be intrinsic in its construction. 1. Ohno, S. (1988) Proc. Nati. Acad. Sci. USA 85, %30-9634. 2. Phillips, G. J., Arnold, J. & Ivarie, R. (1987) Nucleic Acids Res. 15, 2611-2626. 3. Grantham, R., Gautier, C., Gouy, M., Jacob, M. & Mercier, R. (1981) Nucleic Acids Res. 9, 543-574. 4. Yamawaki-Kataoka, Y., Miyata, T. & Honjo, T. (1981) Nucleic Acids Res. 9, 1365-1381. 5. Mingheti, P. P., Ruffner, D. E., Kuang, W. J., Dennison, 0. E., Hawkins, J. W., Beattie, W. G. & Dugaiczyk, A. (1986) J. Biol. Chem. 261, 6747-6757.