Concurrent Test Algebra Execution with Combinatorial Testing Wei-Tek Tsai∗ , Jie Luo† , Guanqiu Qi∗ , Wenjun Wu† , of Computing, Informatics, and Decision Systems Engineering Arizona State University, Tempe, AZ, USA † State Key Laboratory of Software Development Environment School of Computer Science and Engineering, Beihang University, Beijing, China
[email protected],
[email protected],
[email protected],
[email protected] ∗ School
Abstract—Software-as-a-Service (SaaS), a new software delivery model, plays an important role in daily life. In SaaS, mission-critical applications are composed, deployed, and executed on cloud platforms. SaaS applications needed to have high reliability and availability before publishing. Testing SaaS applications becomes important, as the large number of testing prior to their deployment. Test Algebra (TA), a algebraic system, identifies faults in combinatorial testing for SaaS applications using existing test results and eliminates those related faults. Although TA eliminates a large number of configurations from considerations, it is still difficult to finish testing enormous combinations of services in a reasonable time. To improve TA analysis, this paper proposes a concurrent TA analysis. It allocates workloads into different clusters of computers and performs TA analysis from 2-way to 6-way configurations. Different database designs are used to store the test results of various configurations. Faulty and operational table search algorithms are proposed to retrieve existing test results. One 25-component experiment is simulated using the proposed solutions. The same experiment is also simulated on multiple processors for concurrent TA analysis. Keywords-Combinatorial testing, algebra, concurrent, and SaaS.
I. I NTRODUCTION Combinatorial testing is a testing technique that can be used to test a component-based application. It tests interactions among components in the configuration, assuming that each component has been tested individually already. A t-way interaction is one that involves t components, and t-way coverage in a test suite means that every tway interaction appears in at least one test configuration. Traditional combinatorial testing techniques focus on tests to detect the presence of faults, but fault location is an active research area. Each configuration needs to be tested, as each configuration represents a tenant application. Traditional combinatorial testing methods, such as AETG [2], can reveal the existence of faults by using few test cases to support tway coverage for t ≥ 2. But knowing the existence of a fault does not indicate which t-way interactions are faulty. When the problem size is small, an engineer can identify faults by knowing which test configurations contain a fault. However, when the problem is large, it difficult or even impossible to identify faults if the test suite only ensures t-way coverage.
Combinatorial testing technique can be used in SaaS application testing [2], [12]. For SaaS application, a huge number of possible combinations needs to be tested. It is difficult to finish SaaS combinatorial testing in single machine. Cloud computing allows hundreds of thousands of processors available for testing. Potentially a large number of processors with distributed databases can be used to perform large-scale combinatorial testing. For example, they support concurrent and asynchronous computing mechanisms such as MapReduce, automated redundancy and recovery management, automated resource provisioning, and automated migration for scalability. One simple way to perform combinatorial testing in a cloud environment is: 1) Partition the testing tasks; 2) Allocate these testing tasks to different processors in the cloud platform for test execution; 3) Collect results from the processors. However, this is not efficient. While computing and storage resources have increased significantly with cloud computing, the number of combinations to be considered is still too high. Testing all of the combinations in a SaaS system with millions of components can consume all the resources of a cloud platform. Two ways to improve this approach are available based on learning from previous test results: • Devise a mechanism to merge test results quickly, and detect any inconsistency in testing; and • Eliminate as many configurations as possible from future testing using existing testing results. In a cloud environment, test results may arrive asynchronously and autonomously. TA [12], to address the above two approaches, facilitates concurrent combinatorial testing. It tracks the test results through existing test results without knowing how these results were obtained. Specifically, it does not record the execution sequence of previously executed test cases. So allocating different configurations to different processors for execution in parallel or in any order becomes possible, and the test results are merged following the TA rules. The execution order and the merge order do not affect the merged results if the merging follows the TA operation rules. TA defines five different statuses of interactions, infeasible
(X), faulty (F), operational (P), irrelevant (N), and unknown (U). Three operations are proposed to merge existing test results to get the test result of candidate interaction. In TA analysis, if a t-way interaction is faulty, every (t+1)-way interaction that contains the t-way interaction as a subset is necessarily faulty. Similarly, if any sub-interaction of (t+1)way interaction is infeasible, (t + 1)-way interaction is also infeasible. This paper proposes concurrent TA analysis with the following features: 1) Test workloads can be assigned to different processors for concurrent processing, but test results are shared by all processors. TA analysis workloads are classified into different clusters and cluster-based TA analysis are executed from 2-way to 6-way configurations. 2) Each processor can use existing test results done by any processors to reduce test workloads. 3) A large number of N configurations can be eliminated from consideration directly. 4) X and F interactions can be used to exclude the related configurations from testing consideration. 5) Different test databases can be designed for improving data retrieval efficiency. For example, test results of frequently used interactions can be stored in the top of test databases. As P-table, a table stores those P interactions, stores a large number of interactions can be organized so that frequently used interactions can be retrieved quickly similar this can be applied to F table, a table to store F results, and other tables. Proposed solutions are simulated with 25-component experiment from single processor to multiple processors. This paper is structured as follows: Section II discusses the related work; Section III proposes concurrent TA design; Section IV proposes TA analysis algorithms; Section V discusses TA analysis process; Section VI proposes test database design; Section VII simulates the proposed design and algorithms; and Section VIII concludes this paper. II. R ELATED W ORK SaaS testing is a new research topic [15], [4], [13]. Using policies and metadata, test cases can be generated to test SaaS applications. Testing can be embedded in the cloud platform in which tenant applications are run [15]. Gao proposed a framework for testing cloud applications [4], and proposed a measure for testing scalability. Another scalability measure was proposed in [13]. For software testing, a main challenge is to represent the variability in an expressive and practical way. Domain specific languages, feature diagrams, and other modeling techniques are used to express variability [11]. Another main challenge is how to generate test cases automatically using a description of the variability in order to reveal faults effectively. Testing all combinations of inputs and/or configurations is infeasible in general [5], [7]. The
number of defects in a software product can be large, and defects occurring infrequently are difficult to find [16]. Testing regimes balance the needs to generate tests quickly, to employ as few tests as possible, and to represent as many of the potential faults in tests as possible. Combinatorial interaction testing (CIT) ensures that every interaction among t or fewer elements is tested, for a specified strength t. Among the early methods, AETG [2] popularized greedy one-test-at-a-time methods for constructing such test suites. In the literature, the test suite is usually called a covering array, defined as follows. Suppose that there are k configurable elements, numbered from 1 to k. Suppose that for element c, there are vc valid options. A t-way interaction is a selection of t of the k configurable elements, and a valid option for each. A test selects a valid option for every element, and it covers a t-way interaction if, when one restricts the attention to the t selected elements, each has the same option in the interaction as it does in the test. A covering array of strength t is a collection of tests so that every t-way interaction is covered by at least one of the tests. Covering arrays reveal faults that arise from improper interaction of t or fewer elements [9]. There are numerous computational and mathematical approaches for construction of covering arrays with few tests [3], [6]. If a t-way interaction causes a fault, executing a test that contains that t-way interaction must reveal the presence of at least one faulty interaction. Covering arrays strive to certify the absence of faults, and are not directed toward finding faults that are present. SaaS testing is concerned with identifying those interactions that are faulty including their numbers and locations. Furthermore, the number and location of faults may change as new components are added to the SaaS database. Executing each test of a covering array, certain interactions are then known not to be faulty, while others appear only in tests that reveal faults, and hence may be faulty. At this point, a classification tree analysis builds decision trees for characterizing possible sets of faults. This classification analysis is then used either to permit a system developer to focus on a small collection of possible faults, or to design additional tests to further restrict the set of possible faults. In [17], empirical results demonstrate the effectiveness of this strategy at limiting the possible faulty interactions to a manageable number. The Adaptive Reasoning algorithm (AR) is a strategy to detect faults in SaaS [14]. The algorithm uses earlier test results to generate new test cases to detect faults in tenant applications. It uses three principles: • Principle 1: When a tenant configuration fails a test, there is at least one faulty interaction covered by the tenant configuration. • Principle 2: When a tenant application passes a test, there is no faulty interaction covered by the tenant configuration.
Principle 3: Whenever a configuration covers one or more faulty interactions, it is faulty. Test results are used to isolate the faulty combinations that cause the software under test to fail. Effective classification can increase efficiency [10]: The faulty combinations in scenarios where failures are not commonly observed are classified. Test augmentation and feature selection can be used to enhance classification. TA defines five states of interactions. • Infeasible (X): For certain interactions, it may happen that no feasible test is permitted to contain this interaction. • Faulty (F): If the interaction has been found to be faulty. • Operational (P): If an interaction has appeared in a test whose execution gave an operational result, the interaction cannot be faulty. • Irrelevant (N): For some feasible interactions, it may be the case that certain interactions are not expected to arise, so while it is possible to run a test containing the interaction, there is no requirement to do so. • Unknown (U): If none of these occurs then the status of the interaction is required but not currently known. These five status indicators are ordered by X ≻ F ≻ P ≻ N ≻ U under a relation ≻. A valuation function V (S), so that for every subset S of components, indicates the current knowledge about the operational status consistent with the components in S. A binary operation ⊗ on {X, F, P, N, U} can be defined to determine V (T1 ∪T2 ) from V (T1 ) and V (T2 ), with operation table as follows:
Eliminate configurations from testing considerations
•
⊗ X F P N U
X X X X X X
F X F F F F
P X F U N U
N X F N N N
U X F U N U
One configuration contains many different interactions. The status of one configuration is composed by merging tests results of all its ⊙interactions. The status of T can be defined as V (T ) = I⊆T V (I), where I is an interaction covered by configuration T and ⊙ is defined as ⊙ X F P N U
X X X X X X
F X F F F F
P X F P U U
N X F U N U
U X F U U U
In order to merge testing results from different servers, a new status indicator, error (E), is introduced with E ≻ X. We define a binary operation ⊕ on {E, X, F, P, N, U}, with
TA Analysis
Combinatorial Testing
AR AETG IPO
Interaction (X, F, P, N, U) Configuration (X, F, P, N, U) (1) Identify pass/fault configurations (2) Identify fault location
Automated detection of X or F configurations using existing test results Figure 1.
The Relationship between TA and Combinatorial Testing
operation table: ⊕ E X F P N U
E E E E E E E
X E X E E E E
F E E F E F F
P E E E P P P
N E E F P N U
U E E F P U U
Operation ⊕ is also commutative and associative; To examine the distributivity of ⊗ over ⊕, the definition of ⊗ is extended to support E: ⊗ E X F P N U
E E E E E E E
X E X X X X X
F E X F F F F
P E X F U N U
N E X F N N N
U E X F U N U
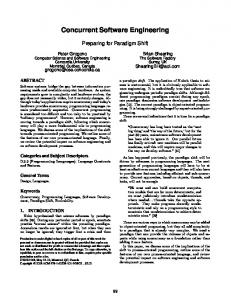
Our methods do not rely on whether random, anti-random, combinatorial interaction, or another type of combinationbased test suite generation is used. We focus on the task of large-scale distributed testing, merging and maintaining test results in order to reduce the amount of testing needed. III. C ONCURRENT TA A. TA Analysis Framework Figure 1 shows the relationship between TA and combinatorial testing. Combinatorial testing can use AETG, AR, or IPO [1] to identify P and F configurations, and even fault locations. The identified configurations and fault locations are saved as test results for future use. TA automatically detects X or F configurations using existing X or F results. All X and F configurations are eliminated from testing considerations. In combinatorial testing, test workloads of those X and F candidate configurations are reduced by TA analysis. Similarly, those N configurations can also be eliminated from considerations. Figure 2 shows the concurrent design for TA analysis. There are many candidate components for tenants to pick
up to compose their own applications. The composed applications of different tenants will be assigned to different clusters for analysis. Each cluster has multiple servers to handle TA tasks in parallel. The two-level architecture not only automatically balances the workloads across multiple clusters and servers, but also scales up with increasing loads with automated expansion. This is similar to the scalability architecture commonly used in SaaS [13]. The high level load balancer allocates testing and TA analysis tasks to different clusters, and each cluster has its own local load balancer and it will dispatch testing and TA analysis tasks to different servers within the cluster. All clusters share a global database, and each sever within a cluster shares a local database for efficient processing. Test scripts and databases can be stored at the global database as well as at local databases within clusters. As TA rules automatically detect test result consistency, thus any temporary inconsistency between local database with the global database can be resolved quickly once communicated. The finished test results will be saved as P T R (Previous Test Result) and shared. Before saving, all test results must be verified by the test oracle to check the correctness. Only the correct test results will be saved in test database. Same configurations may be analyzed in different clusters. In this case, if one cluster gets test result of any configuration first, it can be shared and reused by others. For example, cluster1 gets that configuration (a, b) fails in combinatorial testing first. cluster2 and cluster3 can reuse the shared faulty result of configuration (a, b). The following example illustrates the testing process of fifteen configurations. All feasible configurations should be tested. For simplicity, assume that only configuration (c, d, f ) is faulty, and only configuration (c, d, e) is infeasible, and all other configurations are operational. The existing test results of configurations can be used to analyze test results of candidate configurations for reducing test workloads. If one assigns configurations 1, 3, 5, 7, 9, 11, 13, 15 into Server1 , configurations 2, 4, 6, 8, 10, 12, 14 into Server2 , and 4-11 configurations into Server3 . If Server1 and Server3 do their own testing first, Server2 can reuse test results of interactions from them to eliminate interactions that need to be tested. For example, when testing 2way interactions of configuration (b, c, d, f ) in Server2 , it can reuse the test results of (b, c), (b, d) of configuration (b, c, d, e) from Server3 , (b, f ) of configuration (a, b, c, f ) from Server1 . They are all passed, and it can reuse the test results of (b, c, d) of configuration (a, b, c, d) from Server1 , (b, c, f ) of configuration (a, b, c, f ) from Server1 , (b, d, f ) of configuration (a, b, d, f ) from Server1 , and (c, d, f ) of configuration (a, c, d, f ) from Server3 . Because (c, d, f ) is faulty, it can deduce that 4-way configuration (b, c, d, f ) is also faulty. For the sets of configuration that are overlapping,
their returned test results from different servers are the same. The merged results of these results also stay the same. (a,b,c,d) (a,b,c,e) (a,b,c,f) (a,b,d,e) (a,b,d,f) (a,b,e,f) (a,c,d,e) (a,c,d,f) (a,c,e,f) (a,d,e,f) (b,c,d,e) (b,c,d,f) (b,c,e,f) (b,d,e,f) (c,d,e,f)
Server1 P
Server2
Server3
P P P P P X F P P X F P P X
P P P X F P P X
M erged Results P P P P P P X F P P X F P P X
B. Relationship among Different Configurations This subsection explores the relationship among different type configurations. The definition of each factor is as follows: • Number of components: #E • Options of each component: OK • Number of configurations: #G • Number of infeasible configurations: #X • Number of faulty configurations: #F • Number of operational configurations: #P • Number of irrelevant configurations: #N • Number of unknown configurations: #U • Number of repeating counted configurations: #R E The ∑#Etotal mnumberm of configurations (G) is (OK + 1) = m=2 C#E OK , m ∈ Z. TA is used to analyze t-way configurations for 2 ≤ t ≤ 6. The following equations show the number of each configuration. • Number of configurations (N C): ∑6 m m m=2 C#E OK , m ∈ Z • Number of infeasible configurations (N XC): ∑6 ∑6−m n m=2 [#Xm (1 + n=1 C#E−m )] − #RX , m ∈ Z, n∈Z • Number of faulty configurations (N F C): ∑6 ∑6−m n m=2 [#Fm (1 + n=1 C#E−m )] − #RF , m ∈ Z, n∈Z • Number of operational configurations (N P C): ∑6 m=2 #Pm , m ∈ Z • Number of irrelevant configurations (N N C): ∑6 m=2 #Nm , m ∈ Z • Number of unknown configurations (N U C): ∑6 m=2 #Um = N U C = N C − N XC − N F C − N P C − N N C, m ∈ Z, n ∈ Z The relationships among different type configuration are shown in Figure 3. The rectangle is the the number of
Figure 2.
Concurrent TA Analysis Design
testing.
Figure 3.
The Number of Configurations
configurations. X, F, P, and N configurations are represented by red, yellow, blue, and purple circle respectively. The remaining grey part of rectangle represent unknown configurations. The size of each circle corresponds to the number of related configurations. P and N configurations have larger number than X and F configurations in most cases. As X, F, and N combinations can be used to reduce test workloads, it gets the following conclusions. •
•
•
If the number of X interactions is large or increases, more related X configurations will be eliminated for testing. If the number of F interactions is large or increases, more related F configurations will be eliminated for testing. If the number of N configurations is large or increases, more related N configurations will be eliminated for
Those X, F, and N combinations can be used to eliminate candidate testing configurations. Oppositely, P interactions do not work for eliminating candidate testing configurations. The P interactions can be used as sub-components of candidate configurations. So maximizing the number of X, F, and N combinations initially is a good way to reduce testing efforts. However, the initial X and F interactions must be obtained though testing. It is difficult to obtain a large number of X and F interactions at the beginning. But it is easy to have a large number of N configurations in a short time. A well-known eScience website myexperiment.org [8] whose software can be cast into SaaS shows that many N can be generated or the number of N can be large. So large, N table may not be necessary as anything not in X, F, P, U tables can be considered as in the N table. The following examples illustrate this point. •
•
QR code (matrix code) generator This workflow uses the QR code service provided by the ChemTools project. It has four components (shown in Table I), the total number of possible combinations is 16. The total number of actual combinations is 2. Actual combinations are only 12.5% of possible combinations. In this example, 12.5% of possible combinations needs to be analyzed. The other 87.5% of possible combinations are irrelevant that can be excluded from TA analysis. Entrez Gene to KEGG Pathway
Table I QR C ODE G ENERATOR C OMPONENTS 1 2 3
Type Input QR code Output
Number 1 1 2
Table II E NTREZ G ENE TO KEGG PATHWAY C OMPONENTS 1 2 3 4 5
•
Type Input Add, split Gene Merge Output
Number 2 2 3 2 2
This workflow takes in Entrez gene ids then adds the string “ncbi-geneid:” to the start of each gene id. These gene IDs are then cross-referenced to KEGG gene IDs. Each KEGG gene ID is then sent to the KEGG pathway database and its relevant pathways returned. It has eleven components (shown in Table II), and the total number of possible combinations is 2048. The total number of actual combinations is one. Actual combinations are only 0.0488% of possible combinations. Gene annotation pipeline for graves disease scenarios illustrates the feasibility of combinatorial testing for large component size This is a revised workflow for the Graves disease scenario gene annotation pipeline used in the myGrid project. The workflow had to be re-written due to the loss of the services invoked in the original workflow. It has 48 components (shown in Table III), and the total number of possible combinations is 248 . The total number of actual combinations is 19. Actual combinations are only 6.75 ∗ 10−12 % of possible combinations. Almost all possible combinations are irrelevant that can be excluded from TA analysis.
C. Measurements •
•
Related Configurations (RC): For example, if the status of a configuration C = (C1 , C2 , C3 ) is known, significant information is about those configuration D that contain C as a sub-
D. Incremental Development Starting from a small SaaS, or a small subset of a SaaS, testing the tenant applications, and gradually develop the X, F, P, and U table incrementally. •
Table III G ENE A NNOTATION P IPELINE C OMPONENTS 1 2 3 4 5 6 7
Type Input Get data Get string and diagram Remove and clean data Calculation Other Output
Number 1 13 2 4 5 1 12
configuration. – Related Configurations or RC(t, C) = the set of configurations that have t elements with C as a sub-configuration. – Cumulative Related Configurations or CRC(w, C) ∪w = t=2 RC(t, C), where w is the maximal number of elements in configurations. – CRC(w, C) ≥ RC(t, C), if w ≥ t. Reduction Ratio (RR): – If the number of configurations needs to be tested after TA analysis is N C, RR = N C/total number of conf igurations. – X, F, N can reduce the number of configurations that need to be tested by generating CRC(6, sum(X, F, N)). N C = total number of conf igurations−CRC(6, sum(X, F, N)), and it is computed by the following TA analysis algorithm: ∗ Starting from 2-way configurations, the simulation goes through each 2-way configuration, eliminate those initial X, F, P, and N 2-way configurations, and identify those needs to be tested. For those needs to be test, obtain the simulated test results. ∗ Once completing the 2-way configurations, all the tables are updated, and start identifying those 3-way configurations that need to be tested using the TA rules. ∗ Once completing the 3-way configurations, all the tables are updated, and the process repeats for 4-way configurations to 6-way configurations. This can be done by TA computation, but TA analysis followed by testing, followed by TA analysis, from t = 2 to t = 6. – Parallel computing can be used to increase the speedup of TA analysis and enhance the efficiency of TA analysis.
•
•
When a new component arrives without any association with any tenant, it is not necessary to test any configuration. When a new component arrives and associated with a set of tenant applications, all configurations of this component with any 2-way to 6-way configurations will be marked as U, and sent to testing and TA analysis. TA will analyze if any of these new tenant applications need not be tested (if any of them contains any X, F, or N).
•
•
When a tenant application is tested, all 2-way, 3-way,.. 6-way configurations with any new components will be marked P. If the tenant application is faulty, the faulty interaction must be identified, by algorithms such as AR. IV. TA A NALYSIS A LGORITHM
A. Search Process and Algorithm For new candidate testing configurations, the testing process as follows: 1) Search in F-table For n-way candidate configuration, search in related Ftable from 2-way to n-way to check whether it contains any F interactions. If yes, candidate configuration is faulty and can be eliminated from testing. Otherwise, search in P-table to find which test results can be reused. • Best condition: For a n-way candidate configuration, related 2-way faulty interaction is found in F-table. Stop searching in F-table and return F as the test result of candidate configuration. • Worst condition: All related interactions of n-way candidate configuration are searched in F-table, but none is found in F-table. The n-way candidate configuration cannot be eliminated from the TA analysis. Algorithm 1 F-table Search Algorithm Input: F-table, n-way candidate configuration (n ≤ 6) Output: Test results of candidate configuration 1: Calculate all related interactions of n-way candidate configurations 2: Search related interactions from 2-way to n-way interaction F-table 3: for (i=2; i