Dept. of Aeronautics, Imperial College, London SW 7 2 BY, UK ..... hot R~vo to approach -1, implying that all hot fluid (erupt- ..... Imperial College Aero Tech.
Experiments in Fluids
Experiments in Fluids 7, 173-189 (1989)
9 Springer-Verlag 1989
Conditional-sampling schemes for turbulent flow, based on the variable-interval time averaging (VITA) algorithm J.F. Morrison *, H. M. Tsai ** and P. Bradshaw***
Dept. of Aeronautics, Imperial College, London SW 7 2 BY, UK
Abstract. The variable-interval time-averaging ("VITA") algorithm has been tested in a variety of turbulent boundary layers for its ability to detect shear-stress-producing motions from hot-wire signals. A "VITA+ LEVEL" scheme (which uses criteria for both short-time variance and short-time average, i.e, "level") has been devised, and used in several different boundary layers. This scheme yields length-scale statistics that are acceptably independent of the conditioning criteria, which the VITA scheme does not.
1 Introduction
The basis of conditional sampling of a time-dependent signal f(t) is to generate an on-off signal c(t), equal to unity at times when f(t) is "interesting" (according to some pre-chosen sampling criterion) and equal to zero at other times. A very simple sampling criterion would be f(t) > F, where F is a pre-chosen threshold value: c (t) = 1 when this inequality is satisfied, else c ( t ) = 0. The "conditional average" o f f ( t ) is defined as c (t)f(t), and the "event average" as c ( t ) f ( t ) / c (t) = ~ - ~ : the notation is from Kovasznay et al. (1970). The choice o f f ( t ) , and of the sampling criterion to detect meaningful events in the signal, depends on physical arguments. Conditional sampling as described here was developed for analysis of hot-wire records of turbulence: similar concepts apply to other problems o f detecting order in nearlyrandom processes in one or more dimensions, but in most other cases the problem is to detect a coherent component - such as a narrowly-modulated radio or TV signal against random background noise; in turbulence, however, even the "interesting" part o f f ( t ) has a nearly-Gaussian probability distribution.
* Present address: GEC Turbine Generators Ltd., Barton Works, Barton Dock Road, Urmston, Manchester M31 2LD, UK ** Present address: Dept. of Nuclear Engineering, Queen Mary College, London E 1 4NS, UK *** Present address: Thermosciences Div., Stanford University, Stanford, CA 94305-3030, USA
In this paper we report tests on a number of conditional-sampling schemes for detecting shear-stress-producing events in a turbulent boundary layer from time-series records of the velocity at a given point. Turbulence measurements using the best of these schemes are described by Bradshaw and Morrison (1986) and Morrison etal. (1988a, b). Our preconception is important: we assume that the main purpose of studying shear layers is to identify the shear-stress-producing mechanisms and the regions in which contributions to shear stress are large, and our conclusions do not necessarily apply to any other aims of turbulence research. Further, we concentrate on "onedimensional" (time-series) data from hot-wire or resistance-thermometer records at a small n u m b e r of different locations: we do not directly discuss pattern recognition in turbulence simulations, where all variables are available as discrete functions of three space dimensions and time. However, such 3D simulations provide useful data for testing one-dimensional algorithms operating on f(t) or f(x). Chen and Bradshaw (1988) use simulation data to compare a number o f burst-detection schemes, and confirm the superiority o f the " V I T A + LEVEL" scheme described in the present paper. Our specific objective was to investigate and improve the variable-interval time-averaging (VITA) scheme o f Blackwelder and Kaplan (1976), which - to a first approximation - identifies prolonged regions of large df/dt in the presence o f short regions of large df/dt or prolonged regions of small df/dt. The duration o f the identified region tends to be roughly equal to the averaging interval, so that short regions of large df/dt, i.e. spikes, are filtered out. "Bursts" of shear-stress-producing turbulence generally begin and end with large, prolonged gradients of u, or uv or temperature, which VITA can identify against a background of low-frequency undulations and high-frequency spikes. The VITA scheme is widely used, but, like other workers, we found it to have severe limitations: notably, VITA may detect only the front and back of a "burst" and ignore the central portion, in which f - u v, say - is large but df/dt small (we use the term "dropout" to
174 describe a region within a burst where VITA detection fails). Also, VITA shares the defect of many detection schemes - results are very sensitive to the values of the sampling criteria so that a given fractional change in threshold may produce a fractional change of the same order in some of the final statistics (Chen and Bradshaw 1988). We note that if the results are to be compatible with "law of the wall" or "law of the wake" scaling - or even to show up departures from them - the threshold on any velocity signal should be a universal multiple of the friction velocity u~, and any averaging length scale should be a multiple of v/u~ (i.e. a fixed-probe timescale should be a multiple of v/(u~ U)). We have modified the VITA algorithm to produce statistics that are as nearly as possible independent of the sampling criteria and thresholds. As a severe test, we examine integral moments of the probability distribution function of event ("burst") length, obtained from an optimised VITA scheme applied to the instantaneous uv fluctuation. We follow the general procedure of Murlis et al. (1982), who stress the importance of using probability distribution functions, and their integral moments, to represent the lengths of conditionally-sampled events - as opposed to some arbitrary specification of "average" event length. An advantage of the present work over previous investigations is that the ratio of boundary-layer thickness to hot-wire length is large enough that measurements in the logarithmic region (30 v/u~ < y < 0.2 6 are free from spatial averaging effects - which, before their explanation by Blackwelder and Haritonidis (1983), caused much confusion over the validity of inner-layer scaling on u~ and y. One of our test boundary layers initially developed over a rough surface and then passed on to a smooth surface (Bradshaw and Morrison 1986). In this case, the ratio of typical outer-layer turbulent intensity to inner-layer turbulent intensity is much larger than in a simple smooth-wall flow: this tests the ability of a conditionalsampling scheme to detect the "active", shear-stress-producing, motion in the inner layer in the presence of significant "inactive" motion induced by disturbances from the outer layer. We also studied a boundary layer heated by a spanwise line source, so that the instantaneous temperature of the fluid could be used as t h e f ( t ) signal (see also Tsai 1988). The VITA scheme is used here with the instantaneous uv signal, the temperature signal, and an approximation to the spanwise component of the vorticity fluctuation: (i) The uv signal is used because the final application is to detect motions which contribute to the shear stress - Q uv. Corino and Brodkey (1969) showed that motions with - u v > 0 (positive contributions to shear stress) are of two basic types: "ejections", with v > 0, which follow a low-speed streak-and-lift-up motion (Often and Kline 1974), and "sweeps", with v < 0, which are the large-scale intrusions of outer-layer fluid that produce "pockets"
Experiments in Fluids 7 (1989) (Falco 1984) or large-eddy "footprints" in or just above the sublayer. (ii) It is difficult (e.g. Muck 1980) to devise reliable computerized discrimination schemes based on u-component velocity or on u v, even for the comparatively simple task of detecting the turbulent/non-turbulent interface at the outer edge of a shear layer (the word "computerized" reflects the fact that even an inexperienced human eye is quite good at detecting the interface from u traces). Muck showed that tracer-based (specifically, temperature-based) schemes are preferable. Therefore we have studied a boundary layer with a spanwise line source of heat some distance downstream of the origin, so that the thermal boundary layer fills approximately half of the total boundary layer at the measurement station. This is analogous to the combined dye and hot-wire experiments of Often and Kline (1974). The molecular and turbulent Prandtl numbers are close to unity, so that the hot region closely follows the fluid. (iii) Finally, we used a four-wire array to make wavenumber-limited measurements of the spanwise (z-wise) component of vorticity (parallel to the wall but normal to the direction of the flow) and of the strain rate in the (x, y) plane - essentially, only the larger energy-containing motions, with wavelengths more than about 0.2 times the boundary layer thickness, were resolved. Motions producing large uv may be expected to contribute significantly to large-scale vorticity and strain rate, which (Bradshaw and Koh 1981) also control the generation of pressure fluctuations. Section 2 describes the experimental techniques, Sect. 3 reviews conditional-sampling schemes and introduces the "VITA-plus-level" scheme, and Sect. 4 presents and discusses the results.
2 Experimentalarrangement The main (isothermal) measurements were made on the floor of a 3' x 3' (914 mm • 914 mm) closed circuit tunnel. In the fully-smooth boundary layer at the measurement station, 3.8 m from the boundary layer origin, the properties were Reo = 14,500, 6995= 68.2 mm, Ue = 32.8 ms -1 and u~= 1.09 ms -1. The rough-to-smooth boundary layer w a s generated by covering the first 2.3 m of the test surface with an array of 0.5 in. (12.7 mm) cubes at 1.5 in. (40 mm) spacing. At x = 3.8 m, Reo = 30,000, with 6995 = 119.0 mm, Ue = 33.5 ms -1 and u, = 1.05 ms -l. The measurements in the partly-heated boundary layer were made by Tsai (1988) on the floor of a 30"• 5" (762x 127mm) blower tunnel described by Bradshaw (1972). A thin, electrically-heated, spanwise wire was mounted on the surface 2.53 m downstream from a 0.76 mm diameter wire used to trip the boundary layer; there was a further fetch of 0.156m between the heat source and the measurement station. The input power to
J. F. Morrison et al.: Conditional-sampling schemes for turbulent flow, based on variable time interval the heat source was 0.26 kW, giving a maximum mean temperature difference of 1.8 ~ at the measurement position. Here the thermal boundary layer thickness was 18 mm, with 6995 = 40.0 mm, Ue = 29.0 ms -1, u~ = 1.04 ms -1 and Reo = 7,700. In both rigs, mean velocities were measured with 1 mm o.d. pitot tubes. Measurements of u- and v-components of velocity fluctuations were made using a home-made constant-temperature anemometer system (Hoffmann 1981) and standard X-array probes with 5 gm diameter platinum wires operated at an overheat ratio of 1.8. Probes were individually calibrated, using a King's law exponent of 0.45: yaw calibrations were fitted by an effective cosine law (Bradshaw 1971). Temperature fluctuation measurements were made with 1 lam diameter platinum "cold wires" operated at a constant current of 1 mA. The cold wire was placed parallel to, and 1 mm away from, the plane of the cross wire. The thermal inertia of the wire was compensated up to about 10 kHz by an analogue circuit: the frequency response was checked by measuring the rise-time (0.05 ms) of the output signal generated by a square-wave electrical input signal. The signals were recorded on analogue tape and transcribed at a lower speed onto digital tapes: the effective real-time sampling rates were 73,510 samples/s per channel for 3-channel data, 71,936 samples/s per channel for 4-channel data and 68,986 samples/s per channel for 6-channel data. Details of the digitizing procedure and data processing, including correction of velocity measurements for the effect of temperature fluctuations, are given by Subramanian and Bradshaw (1984).
3 Conditional-sampling schemes 3.1 The VITA and quadrant-hole schemes The VITA scheme, due to Blackwelder and Kaplan (1976), has been widely used, both for studies of the outer layer (e.g. Chen and Blackwelder 1978; Subramanian et al. 1982) and for the detection of inner-layer bursts (e.g. Johansson and Alfredsson 1982; Chambers etal. 1983; Alfredsson and Johansson 1984a, b). As applied to a timevarying signal,f (t), the scheme may be stated as follows: 1 t+r/z [ 1 t+T/2 ]2 defining var ( f ) = f ( t' T) = --f t- ~r/2f 2 d t - [--~ L - t - ~r/2f dt Jl , the detection criterion is f > VITH ~ . Here VITH is the variance threshold, T is the short-time averaging period, and overbars denote conventional averages. The output of the algorithm is the ID (t) identity trace, unity when the criterion is satisfied and zero otherwise. If VITA is applied to a sinusoidal signal, with an averaging time T short compared to the period, it becomes a pure gradient criterion. That is, the maximum
175
VITA variance coincides with the maximum gradient of the sine wave (e.g. near t = 0 where sin cot = cot over the short time T), and in this case the scheme detects regions in which d f / d t , averaged over time T, numerically exceeds ][6(VITH)1/2/T. Slightly more generally, the difference between the maximum and minimum values of the VITA variance for a sinusoidal signal is greatest when T is half the period of the signal. This accounts for several workers' observation that the VITA scheme preferentially detects turbulence events - primarily, regions of large d f / d t - of about the same duration as T. A specific method of detecting bursts that contribute substantially to u v is the "quadrant-hole" scheme of Lu and Willmarth (1973), in which the detection criterion is: uv>HV~,
v2 ,
where H is an arbitrarily chosen threshold. This is a simple "level-detection" scheme while VITA approximates a " gradient-detection" scheme. Events can be sorted into quadrants in the u, v plane: quadrant two (u < 0, v > 0) corresponds to ejections and quadrant four to sweeps. The comparisons of the VITA and quadrant-hole schemes made by several workers show conflicting results, because of the high degree of subjectivity involved in the selection of thresholds and the way in which an algorithm is applied to different signals. Our appraisal of the VITA scheme includes a comparison with the quadrant-hole u vlevel scheme, because our modified scheme includes a "level" criterion similar to that of the quadrant-hole scheme. Alfredsson and Johansson (1984a) found that neither the VITA nor the quadrant-hole scheme had a distinct advantage over the other, but they noted that the v signal (and presumably therefore the u v signal) was a more reliable indicator of bursting than the u signal. Historically, VITA has usually been applied to the u signal, for simplicity, but u includes low-frequency inactive events that do not contribute to uv, and this puts a strain on VITA's ability to reject large, but slow, changes in signal level. Bogard and Tiederman (1986) added a gradient criterion on d u / d t to their VITA scheme; they also tested the quadrant-hole technique. They concluded that the quadrant scheme was more reliable for detecting bursts, as did Luchik and Tiederman (1987). Luchik and Tiederman noted that VITA, applied to u (t), tended to detect the edges of a large excursion, where the gradient was largest. Subramanian et al. (1982) found that the detections of the VITA scheme, applied to the temperature signal in a slightly-heated boundary layer, corresponded better with the temperature "fronts" observed by Chen and Blackwelder (1978) than did the quadrant-hole scheme in the u, v plane. (Chen and Blackwelder did not claim that a temperature front necessarily coincides with the start of a uv burst, but most simple concepts of turbulent mixing would suggest that it does.) Murlis et al. (1982) showed that the temperature signal, being necessarily non-nega-
176
Experiments in Fluids 7 (1989) Level
i0_0
__n
(8 ) ~
__
gLrq_A__f-L
~
r-q r--U'~
[O+O 00
Vita+ Level
(8)
ID 0 f~
ID+0 0 0
Vita (8)
10-0 i0+o
J&q
~
~
J-[
__/q
J]_
l
f
q
.
_
_
~
UV0 0 8
V
0
0 U Q 0
1.36
2.72
4.08
5.44
6.80
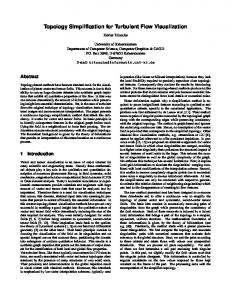
8.16 Time Fig. 1. Comparison of temperature-based schemes: identity traces
tive, was comparatively free from "dropouts" in midevent, so that a level-only scheme worked well: however, a level-only scheme using first and second rectified time derivatives of the uv signal performed poorly, and had to be reinforced by a "hold time" (the m i n i m u m accepted spike or dropout excursion length) closely analogous to the VITA averaging time. Guezennec (1985) used the VITA scheme with f ( t ) = u, and sorted events according to the sign of the time derivative at the event centre (following Alfredsson and Johansson 1984a). He showed that VITA (u) tends to show an ejection immediately following, or preceding, a sweep, which may not be a common event in practice: again, the explanation is that VITA tends to detect large gradients. Guezennec also used the quadrant-hole technique, and found that VITA events with positive or negative du/dt contained two periods of large negative uv, corresponding to events in the second or fourth quadrants in the u, v plane. The general conclusion is that if T is set to emphasize the fronts and backs of a shear-stress-producing event, VITA may ignore or garble the body of the event where the detection signal f ( t ) reaches a plateau of small df/dt: also, it is likely to trigger on the strong acceleration between an ejection and an adjacent sweep, and thus detect even weak examples of this comparatively rare double event. A pure gradient criterion also ignores the mid-part of an event with small df/dt, and has the additional disadvantage of replacing a single event containing several extrema by a train of short bursts with dropouts between them. N o w
9.5Z
10.88
12.24
13.60 ms
]4.96
extrema are usually flanked by large gradients, and thus a large VITA variance for the values of T normally used: thus, although VITA is to a first approximation a gradient criterion if T is small, its advantage over a pure gradient criterion is that it avoids dropouts at sharp extrema. The quadrant-hole technique is not confused by mid-event plateaux or sharp extrema, but necessarily produces dropouts at zero crossings: it also truncates the front and back of an event, where df/dt is large but the excursion in f is still small.
3.2 The VITA + L E V E L scheme The above discussion suggests the use of a VITA-variance criterion combined with a "level" criterion: VITA avoids dropouts at zero crossings, and a "level" criterion avoids rejecting plateaux. We have devised a two-stage scheme as follows: (i) an event is provisionally detected, if / > VITH" f ~ and f > TH ( f 2 ) 1 / 2 . (ii) when both these conditions are met, the level criterion alone, f > TH ( f 2 )1/2,
J. F. Morrison et al.: Conditional-sampling schemes for turbulent flow, based on variable time interval is applied at successive data points before and after the centre of the VITA detection period, the first violations of the LEVEL criterion being taken as the front and back of the event. Thus the VITA stage, (i), detects the approximate front and/or back of an event and smooths out the effect of zero crossings, and the level stage, (ii), ensures that regions of small gradient in mid-event are not ignored. Using a level criterion in stage (i), in addition to the variance criterion, ensures that the scheme triggers on a large excursion of the signal rather than on a succession o f zero crossings. Once these two criteria are met, the use of the level criterion alone determines the length of an event and, in particular, decides when a dropout that could terminate an event prematurely is really a quiescent period between events. In a pure VITA scheme, it is simplest to scan the signal with successive, contiguous short-time averaging periods; once a detection has been made, the averaging period is centered at successive data points, in order to determine the beginning and the end of the event. (The alternative is to average around each data point even in the scanning stage, but this is more expensive and does not significantly alter the number of detections.) Stage (i) of the VITA + LEVEL scheme operates in the same way, except that for a successful detection the level criterion must also be satisfied. Velocity thresholds should scale on the friction velocity, but temperature thresholds depend on the heat input and we have not tried to deduce universally applicable values. We have also used a pure LEVEL scheme, which simply by-passes the variance criterion, (i).
4 Results and discussion
4.1 Temperature-conditioned statistics Figure 1 compares "zero-one" identity traces generated by the VITA scheme, the LEVEL scheme and the VITA + LEVEL scheme, using the temperature 0 as the detection signal. In this set of results, detections are sorted into two groups, using 0c, t h e temperature at the centre of an event. When 0c > ~, ID + ( t ) = 1 and these events are referred to as " > H O T " while those events for which 0c < ~,, I D - ( t ) = 1, are referred to as " < HOT". ff is the conditional average of 0, i.e. conditional on ID ( t ) = 1. This additional feature provides information about the relative contributions made by " > H O T " and " < H O T " fluid to the shear stress - our. The VITA averaging time T was set to be roughly twice the time taken for a 1 m m long eddy to pass the (1 m m long) hot wire. Thus the VITA low-pass filtering effect has about the same cutoff as the expected spatial filtering of the wire: a shorter time would be meaningless and a longer one was not necessary. Evidently the VITA scheme selects the regions of large gradient at the front and back of a hot zone as separate
177
0.12 0.08
0.08- / I
~176/
0.04
0
o.o:I 0
z'o
go
b
~
o
k
~
tt6t
20
40
60
80
100
6'o
8'o
16o
6'~
8o
too
~'o
8b
1(~0
t/Ot
e
0
.
0
8
~
0.04 01
2)
d
4'o t/0t -
o_
9
o
2'0
e
4o
=-
t/~t
0.160.12O.08' ok.
0.04 o
f
z'o
4'o t/~t-
Fig. 2 a - f . Comparison of temperature-based schemes; probability distribution of event durations at y/6=0.185; a VITA "> HOT", b V/TA "< HOT", e VITA + LEVEL "> HOT", d VITA+ LEVEL "< HOT", e LEVEL "> HOT", f LEVEL "< HOT"
178
Experiments in Fluids 7 (1989)
-1.85
-1.11
I
i
-175.95
TUe/6 -0.37 I i
0.37
1.11
I
i
[
Tu~/~
-1.85 I
-1.!4
=
-~o#.57 -370
3~,.~0
I0~.57 -175.05
UV O
-105.57
TUe/6
-o.77
Tu~/~ -35.19 i
0.37
1.]1
1.85 I
35.191
105.57
175.95
1.~3 rns
L
O,
OV 0OU O-
8-
0-
0-
80 -Z.55
-1.~3
-0.~1
0.51
0 1.53 ms-2.1
oJ -1.85
I
-175.95
-1.53
-0.51
0.51
-1.11 i
TUe/O -0.37 i
0.37 i
2.55
bO-
-1.11 i -105.57
TUe/6 -0.37
0.37
i
i
Tuz/v -----,--35,.19 35,.19
UV 0
~
1.11 i
-1.85 I
Tu21v
105,.57
-175.95
-105.57
-35'.18
:-
1.11 i
1.85
~o5.57
175.95
I
=
35,.18
0
0 V O 0 U O
O
S
Fig. 3 a - f. Comparison of temperature-based schemes: ensemble-averaged time his-
O O0 -2.55 c
8]
-~.53
-o.~
0.'51
0 1.i3 ms-2.55
-1.83
aoJ
events (e.g. near 10.2ms): the V I T A + L E V E L scheme and the LEVEL scheme correctly identify this hot zone as a single event. Only when the temperature trace has a single peak (e.g. at about 13.0 ms) does the plain VITA scheme correctly identify the complete hot zone. The thresholds for stages (i) and (ii) were set by visual inspection; the temperature excursions are positively skewed "boxcar"-shaped - so that the choices are not critical. In fact, for the measurements shown in Fig. 1 the LEVEL threshold was set somewhat higher than would be chosen
.2
-o.'5~
tories; sequence as in Fig. 2; 0.51
1.53 ms 2.55
y/6 = 0.185
L simply to measure temperature intermittency (when the whole region between 4.7 and 5.9 ms, for example, would be counted as "HOT"). The plain VITA scheme misses two obvious hot zones between 14.0 and 16.0 ms, while the LEVEL and VITA + LEVEL schemes identify them. Figure 2 shows the probability distribution function (p.d.f.) of the hot-zone durations, separated into " > HOT" and " < HOT" groups. Distributions generated by the plain VITA scheme reach their peaks at t/fit = 5 (fit is the sampling interval), a time equal to the short-time aver-
J. F. Morrison et al.: Conditional-sampling schemes for turbulent flow, based on variable time interval TUe/O ~
-1.85
I
-I.]I
-0.37
TUelO'
0.37
1.]1
-1.85 I
Tu~/v ~
-175.95
-I05.57
-35.19
35.19
105.57
-175.95
uv 0-
O"
o-
O.
vo-
-0.37 ,
T@v -105.57
-35.19
"
1
0.37,
1.11 ,
1.85
35.19
105.57
175.95
I
I
0-
ouo. 0 8
-1.11,
179
-2.55
e0J
O. O. 0
ms ?.55
f01
aging period, T, while those generated by the other two schemes peak at larger times. P.d.f.'s from the VITA scheme with different short-time averaging periods invariably peak at T, a clear demonstration of the essential shortcoming of the VITA scheme. The distribution produced by the LEVEL scheme does not tend to zero at t/6t = 0: a similar effect was found in the 0-based level scheme of Murlis etal. (1982) for p.d.f.'s of "rotational zones" inside a fully-heated boundary layer at y/6 < 0.5. The probabilities at large event duration are greater for the > HOT group than for the < HOT group for all three schemes at this y/6 (0.185). The integral moments of the event-length p. d. f.'s of these event durations are not proportional to the power o f y expected from inner-layer scaling: the first and second moments decrease with increasing y. Figure 3 shows ensemble-averaged time histories, generated about the centre of each event and non-dimensionalised by r.m.s, quantities. Those generated by the plain VITA scheme show little correspondence between the temperature and velocity signatures, except that the ucomponent fluctuation shows a marked deceleration for ' > HOT' events. The uv-average is very slightly negative for these events. The histories for VITA + LEVEL and LEVEL schemes are very similar to each other but with much sharper and larger peaks in temperature than those in the VITA results. The averages for ' > HOT' events show all the expected features, although the ' > HOT' value of Ru~, at zero time is only about -0.1 whereas the 'hot' average is about -0.35. This is simply attributable to the different ways in which each of these values was calculated: ensemble-averaged time histories are always subject to the randomness of phase associated with each de-
Fig. 3. Continued
[
tection, whereas a simple average over the total duration of many events is not. For the ' < HOT' group of events, all three schemes give a very slightly positive average of u v at the centre of the event - both u- and v-components are positive. In other words, the hotter fluid is more likely to contain - u v , and this justifies the use of a high temperature threshold for stage (i) of the criterion, whether it be a variance or level criterion or both. Of particular interest in Table 1 are the relative values of 'hot' Ruv and Ruvo for each of the schemes. The R~vo correlation is indicative of how reliable the temperature-conditioning of events is; ideally one would expect coefficients of hot R~vo to approach - 1 , implying that all hot fluid (erupting from near the wall) had negative u and positive v. One might also expect coefficients of hot Ruv to approach - 1 , implying that a hot event has a high degree of coherence. The actual values of Ru, produced by either the VITA + LEVEL or LEVEL schemes are of course considerably greater than - 1 . 0 but the fact that the corresponding value of R,~ changes roughly in proportion to the value of Ru,, indicates that the latter implication is at least plausible. Figure 4 shows correlations in quadrant-decomposition form (details of the quadrant analysis are given in the unpublished version of this paper, Morrison et al. 1986). These are correlations non-dimensionalised using conventional r.m.s, quantities so that schemes giving different identity ratios can be compared legitimately. Events are assigned to each quadrant by the values of u and v at the centre of the event. The correspondence between R.v and Ru~o in quadrant two is a measure of the relative success of each scheme; for example if, in quadrant two, hot fluid always coincides with a negative-u v-bearing
180
Experiments in Fluids 7 (1989)
event, the two coefficients averaged over the event will be equal. C o m p a r i s o n o f correlations from each scheme in quadrants two and three show why the VITA scheme is the least satisfactory. It a p p a r e n t l y fails to select some negative uv as 'hot' in q u a d r a n t two and selects some positive us, as 'hot' in q u a d r a n t three (see also Chen and Bradshaw 1988). 4.2 uv-conditioned statistics
The uv-based schemes were c o m p a r e d using the same data as the 0-based algorithms. N o LEVEL scheme
1
2 3 Quo~ront number
4
Fig. 4. Comparison of temperature-based schemes: correspondence of quadrant contributions to hot-zone correlations Ru,, and R,,o; open area = R,~,, hatched area = R , , , o ' y / 6 = 0.185; left to right in each quadrant: VITA, VITA + LEVEL, LEVEL
was used; this would have been even cruder than the relatively unsuccessful u v-based scheme used by Murlis et al. (1982). Regions labelled with ID ( t ) = 1 by the uvschemes are further sorted according to a temperaturelevel criterion, 0c > t7 giving ID + = I, and Oc > t7 giving I D - = 1. Comments on the identity traces of Fig. 5 are similar to those concerning Fig. 1: an obviously single downward excursion in the uv signature at about 16.8 ms is detected as two separate events by the VITA scheme because of the small region of negative gradient in a region of positive average gradient. The VITA + LEVEL scheme detects this correctly as a single event. This downward excursion in the u v signature corresponds to one in the r signature but not in the u signature, and therefore qualifies as a dropout (as defined above) rather than a genuine interval between two events. The probability distributions of event durations in Fig. 6 show that dropouts are ignored by both schemes (but presumably would have been seen by a LEVEL scheme): if spurious dropouts are counted, the p r o b a b i l i t y distribution will not tend to zero when t / 6 t = O . Both o f the p.d.f.'s generated by the VITA scheme peak at t / 6 t = 4, while those from the V I T A + LEVEL scheme peak at slightly higher values. The p.d.f.'s generated by the VITA + LEVEL scheme at large t / S t are larger than those o f the VITA scheme, as were the p. d. f.'s generated by the corresponding 0-based schemes. The division of events into H O T and C O L D according to the conventionally-averaged temperature, 0, allows the C O L D , "sweep", contributions to the shear stress to be assessed. The durations o f H O T and C O L D events detected by VITA and by VITA + LEVEL are nearly the same. The ensemble-averaged time-histories from the two schemes (Fig. 7) are also very similar, except that the VITA + LEVEL scheme produces a sharper peak in the
0 84
0
Vito+ Level (uv)
o IOJLJ-L
io+O
t~
~
Fq.
J L ~
J-t__J~
7q__
o oIO-
o
[D. O UV 0
Vita (uv)
__Z__FTL/Ft~
OO-
V
Time
Fig. 5. Comparison of uv-based schemes (heated flow): identity traces; y/6 = 0.185
f~
/qYY._.._&
J. F. Morrison et al.: Conditional-sampling schemes for turbulent flow, based on variable time interval
uv-average. The correlations between uv and the hot and cold peaks in the temperature ensemble are remarkably close; the peaks occur at zero time. Figure 8 shows histograms of the Ru~ and quadrantaveraged R , , coefficients for the two schemes. Figure 8a is, and should be, very similar to the histograms for the corresponding schemes in Fig. 4. The u v-based VITA scheme performs better than its 0-based counterpart (which as always suffers from small gradients in midevent), and both u v-based schemes produce larger coefficients than the 0-based schemes. The values of R,~o in quadrant two for HOT events (Fig. 8a) and in quadrant four for COLD events (Fig. 8 b) confirm the expected correspondence with cold and hot fluid respectively.
0.16-
0J2-
~o
0,08
o_ 1104-
0
2'0
0
4'0 t/6l
5'0
181
8'0
4.3 Event-length statistics (unheated f l o w s )
0.16-
0.12-
0.08-
O.O4-
Z~ 410 L6'0
0 b
8'0
1~o
~0
100
0.08.
004
C A2'0
~o
--~ 5'o
t/6t
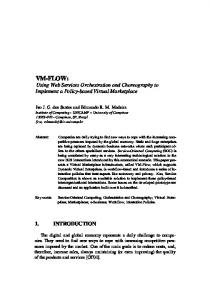
Figures 9 - 1 5 all refer to the VITA + LEVEL scheme. Events contributing to positive uv are discarded and those contributing to negative u v are divided into u > 0 (sweeps) and u < 0 (bursts/ejections). Discarding positive uv sharpens the peaks near detection time, but otherwise the results resemble those of Fig. 7. The value of the identity ratio, y, (the intermittency factor for u v-producing events) is not much reduced by the exclusion of positive-uv events: 7 is 0.17 in the heated boundary layer results, which include positive u v, and is typically 0.15 here. Figure 10 shows the variation of event lengths, and Fig. 11 the variation of event durations and periods between events, in the smooth-wall boundary layer. Eventlength statistics are calculated from the first and second moments of the p.d.f.'s of event durations. The lengths are calculated as L = L (t/fit) 0fit, where O is the eventaveraged streamwise component of velocity; U + for "u > 0" events or U- for "u < 0" events. Mean lengths for positive and negative events vary as (y+)0.25; the gradients of the second moments are slightly larger. The solid line is proportional to (y+)0.25, which is the variation of the Kolmogorov dissipation-range length scale ~/ in the log region. The durations and periods of Fig. 11 are also normalised by the Kol.mogorov length scale, using the local mean velocity as the fixed-axis convection velocity. Periods between events are calculated as
O.08(1 - j
f
N
To
+ L 1 ( t / 6 t ) 9 fit
~ 0.04-
o d
2'0
4'0 tt6t
~o
do
4o
Fig. 6 a - d . Comparison of uv-based schemes (heated flow): probability distributions of event durations at y/6=0.185; a VITA "HOT", b VITA "COLD", c VITA + LEVEL "HOT", d VITA + LEVEL "COLD"
where N is the number of detections, 7 is the identity ratio for the detections, and To is the total time of the data record. This is the reciprocal of what most workers refer to as the "burst" or "event" frequency. The Kolmogorov (y+)0.25 scaling is closely followed out to about y + = 1500 ( y / f i = 0.32). Figures 12 and 13 show results, corresponding to those of Fig. 10 and 11, for the boundary layer following a change from rough to smooth surface. Event lengths again
182
Experiments in Fluids 7 (1989)
-1.85 1--175.95
TUd6
-17 -105.57 I
-o 7 I
0;37
Tu~/w -35.19
35.19 I
I
UV 0
lill 105.57 I
-1.~5 -175.95
-1.7t
-105.57 1
TUel6 = -0.3710.37 TuZ.r/~,~ -35.19 35.19 I I
1.11 I
1.85
105.57
175.95
I
0-
/.-
0
0-
VO
O-
0 UO 080 - ;
.55
-1.~3
0.~
-0.51
Z!
1.i3 ms -2.55
,.fQ.51-~--~--1.53
boJ
a0-1.85
-1.!1
-0.37.
I
0.37
1.11
-1.85
I
I
-175.95
-105.57i
TuZr/v -35.19i
-1.11 L
-
35.19
105.57
-175.95
-105.57 J
TUe/6-'----"-0.37 I 0.77 TU~/~ -35.19
3~.1g
ms 2.55
[
1.!1
1.85
~0~57
175.95
I
UV 0 0 VO
~
0 i
0 UO
0
0 801 - 2.55
oo]
iqi
-19
-o.~1
0.51
1.53 ms -u2:5
-'1?53--'--'~ 0 .'51.~
dO-
follow the Kolmogorov scaling out to y/5 = 0.3 approx. In the rough-to-smooth layer, the inactive motion in the inner layer, induced by the large-scale outer-layer eddies, is particularly intense, but since this motion is only apparent in the u and w components of motion and not in v or uv, the Kolmogorov scaling appears to be unaffected. Morrison etal. (1988a) discuss this viscous scaling of shear-stress-producing events at values of y+ much greater than the viscous sublayer thickness.
~
1.53 ms 2.55
Fig. 7 a - d . Comparison of u v based schemes (heated flow): ensemble-averaged time histories; sequence as in Fig. 6; y/6 = O.185
[
The actual values of event lengths (and durations) depend on the thresholds, although their scaling with y does not: Fig. l0 shows event lengths generated when the level threshold, TH (which effectively determines event lengths) is reduced from 0.46 to 0.1. There was no discernible change in event length when the VITA short-time averaging period was reduced by a factor of two: the VITA + LEVEL scheme uses VITA merely to flag the presence of an event, and not to determine its length.
J. F. Morrison et al.: Conditional-sampling schemes for turbulent flow, based on variable time interval To assess the effect of wire resolution on these results, the same scheme was used with data taken at a lower value of u~ (lower tunnel speed) in the smooth-wall layer. These results are shown as durations and periods in Fig. 14; the Kolmogorov (y+)0.25 scaling is again evident. Perhaps the best justification for believing that the variations of length-scale statistics shown in Fig. 10-14 are independent of the conditioning criteria is the deviation of event durations and periods from the Kolmogorov scaling (e.g. Fig. 11) for y / f > 0.3. A scheme that was insensitive to physical changes in the flow would not show
I
I
/z
S/ i
-1 I
a
-2
-b 1
2 Ouodront
4 3 numbers
I
1
i_
I
2 3 4 Ou•dront numbers
Fig. 8a and b. Comparison of uv-based schemes: correspondence of quadrant contributions to event correlations of R~ and Ru~; a "HOT", b "COLD"; Open area = R~, hatched area = R,~o; y/t5 = 0.185; left to right in each quadrant: VITA, VITA + LEVEL
-I]3
4.74,
-lg3.98
-116.39
TUelO
-02,5
o.z5
TU~I~ - - - - ' -38.80 38.80 i
0.74 I 116.39
1.23 [
-1.Z3
193.58
-193.98
I
i
this kind of trend. The usual inner layer arguments require all length scales of the shear-stress-producing part of the turbulence to be proportional to y, Morrison et al. (1988a) discuss the (y+)0.25 scaling in detail and reconcile these results with the logarithmic and defect laws. The observed Kolmogorov (y+)0.25 scaling of event lengths is consistent with the idea that the V I T A + LEVEL algorithm samples a streamwise "slice" of a coherent volume of fluid. Finally, Fig. 15 shows events sampled by the VITA + LEVEL scheme applied to the spanwise component of vorticity. These measurements were made using the fourwire array of Subramanian et al. (1985). In this case, the effective wire resolution is the same for both x (streamwise) and y (normal) directions and equivalent to 6x § 5y § 306.0 or 6x/6=6y/6=O.065. Also shown in Fig. 15 are the values of thresholds and short-time averaging period used: the VITA variance VITH and the LEVEL threshold TH were adjusted to give identity ratios similar to those of the uv-conditioned results, and the averaging time T was adjusted in conformity with the resolution arguments discussed in Sect. 4.1. Vorticity-sampled events show the same (y+)0.2s dependence as the uv-sampled data, although only for y+ < 1000. The correspondence of uv-sampled and vorticity-sampled events is discussed in more detail by Morrison etal. (1988a). Morrison etal. (1988b) also present statistics produced by applying the VITA + LEVEL algorithm to more complicated velocity derivatives: these results also show a scaling with y that is independent of the sampling criteria.
-0.74
TUd 0-----,--o.25 -O.,ZS
o.74
~.~3
-116.39
Tu$t~ -3&80
116.39
193.98
L
UV 0
183
38.80
i
i
-0.51
0.51
i
UVO 0 VO 0
u ol
UO
O.
0
PO -2.55 a
oJ
-1.53
-0.51
0.51
1.53 ms
2.55
L
PO -2.55
b
oJ
i
-1.53
~-7 "~V
- -
1.53 ms Z.55
L
Fig. 9a and b. VITA + LEVEL; (uv) ensemble-averaged time-histories (unheated flow); a: u > 0, v < 0; b: u < 0, v > 0
184
Experiments in Fluids 7 (1989)
10 3 - -
I
r
I
I
t
I
] l
/ ~
I
--1
I
I
I
I
1133 - -
I
1
I
"1~1
I
I
I
[
l
t
I
I
I0
9
__--
~
I
(y+)
I
I
1/4
(//4y+
/ e
t
i o
o
10l
r
i
10 ]
,
~--I
i
i
i
I~L
I
~
'
'-'
I
I ~
8,
I
I
I
I
t
I
,
E
,
,
~
cT-
I
10~ 103 - -
I
I
LI
I
i
I
I
I~1
I I
I
I
J
~
I
I I
9
I
I
I
I
I
Iol
~
I I
(y+//4
o 9
----~
~
9
9
t
J
f_/.f
6)
9
o
h
10z2"~10
z
I
I
I
, I b l
i 103
I
I __1
i
J
I
10 2
[~
104
b
I
I
L
I
I
I
2.10 z
I I
I.__
y+.------.,--
I
I
I
I
I
104
y+
Fig. 10a and B. Variation of integral moments of p. d. f.'s of event lengths across smooth-wal|ed boundary layer (unheated flow), VITA +LEVEL (uv): a first moment (mean), b second moment (standard deviation); 9 u > 0; | u < 0; - TH = 0.46; . . . . TH = 0.1
I
103 r--
Fig. 12 a and b. Variation of integral moments of p. d. f.'s of event lengths across rough-to-smooth boundary layer, VITA + LEVEL (uv); threshold as in Fig. l; a first moment (mean); b second moment (standard deviation); symbols as in Fig. 11 lOS
q--I
t
~-,
t ~ , I
, , , ,
o
9
104
9
o
104
o (y+)1/4
/
a
(y
//4
Periods
t
Periods
_2,...1~j~,I
~
~
j
t
@
I 103
1031 o
OUfO[iOns
10 2
10 z
~
J
,
,
, , llJ
r
103
o ~
r
i
(y+)l/4
e,
Ducotions
l
i
I a
104
y +-----...-
Fig. 11. Event durations and periods between events corresponding to lengths in Fig. 1"0
10;10 z
,
o
9
,
,~_,
, ,,I 103 y+
,
~
, , , , , 104
,L
Fig. 13. Event durations and periods between events corresponding to lengths in Fig. 11
J. F. Morrison et al.: Conditional-samplingschemes for turbulent flow, based on variable time interval
104
,
i
i
,
,
i
,i
I
Periods f . j . . $ ~ . ~ 4
!103 [y+)l/4
,2 Durations
10: 102
,
T
_ ~ / ~
,
r
,
,
J , I
10a
,
i
,
,
,
,
104
y + --.-.-,,.-
14. VITA + LEVEL (aO event durations and periods between events at (lower) a~=0.857, lu~/v= 55.0, fully smoothwalled layer; VITH = 0.2, TH = 0.46, TUe/5= 0.06; symbols as in Fig. ] 1 Fig,
104
i
i
~
,
,
,
i[
t
,
i
t
(y*)1/4
,
o
185
criterion, has been developed and compared to the VITA and LEVEL schemes, using the instantaneous u v signal and also the temperature signal in a partly-heated b o u n d a r y layer. The new scheme identifies complete ejections or sweeps rather than merely the regions of large time derivative at their fronts and backs: it retains VITA's advantages, that zero crossings of the detection signal do not cause spurious "dropouts" as in a simple level-only scheme, and that sharp extremes do not cause dropouts as in a pure gradient scheme. The V I T A + LEVEL scheme, based on uv, has been used to produce event-length statistics in three b o u n d a r y layers. The (y)1/4 dependence of the results is i n d e p e n d e n t of the threshold values. In a heated b o u n d a r y layer, the scheme also gives the best agreement between the temperature-velocity statistics sampled using the u v signature and those sampled using the temperature signature. The modified scheme has also been tested with a variety of signals, including the l o w - w a v e - n u m b e r contributions to the vorticity and strain rate. It has been shown that the scalings of event lengths, durations and periods can plausibly be attributed to physical phenomena, rather than to the influence of the sampling criteria used within the scheme or the effects of probe resolution.
,'r~-
0
Table 1. Comparison of schemes: heated flow y / 6 = 0.185, 'hot'/ 'turbulent' temperature-velocity and shear correlation coefficients; 'hot'/'turbulent' R,,o = u 0 h o t / ~ etc.
I
-~ 103
(y+)1/4
L~
Durations
Scheme
Ruo
Rvo
Ruvo
Ruv
VITA (0) VITA + LEVEL (0) LEVEL(0) VITA (uv) VITA + LEVEL (u v)
-
0.14 0.20 0.18 0.30 0.28
-
-
0.40 0.79 0.71 0.75 0.77
0.08 0.16 0.14 0.27 0.28
0.34 0.37 0.33 0.75 0.86
o ~..
Acknowledgements
102
i
i
i
i
i
I
, , ,
10~-
I0~ y
+
i
i
i
i
i
i i
104
~
Fig. 15. Event durations and periods between events sampled using spanwise component of vorticity (Oz): VITH=0.08; TH = 0.46, TUe/5 = 0.11; 9 oz > 0; o oz < 0
We are indebted to Dr. C. S. Subramanian for his help with the experimental work, and in particular, his design of the four-wire array. We are grateful to Mrs. R. Fairhurst for typing this paper, and to the Science and Engineering Research Council and the United States Army for financial support.
References 5 Conclusions It has been shown that the VITA scheme preferentially detects events whose duration is approximately equal to the short-time averaging period: the scheme is essentially a selector of regions of large time derivative. A modified VITA + LEVEL scheme, incorporating an additional level
Alfredsson, P. H.; Johansson, A. V. 1984a: On the detection of turbulence generating events. J. Fluid Mech. 139, 325-345 Alfredsson, P. H.; Johansson, A. V. 1984b: Timescales for turbulent channel flow. Phys. Fluids 27, 1974- 1981 Blackwelder, R. F.; Haritonidis, J. H. 1983: The bursting frequency in turbulent boundary layers. J. Fluid Mech. 132, 87- 103 Blackwelder, R. R.; Kaplan, R. E. 1976: On the wall structure of the turbulent boundary layer. J. Fluid Mech. 76, 89-112
Experiments in Fluids 7 (1989)
186 Bogard, D. G.; Tiederman, W. G. 1986: Burst detection with single point velocity measurements. J. Fluid Mech. 162, 389-413 Bradshaw, P. 1971: An introduction to turbulence and its measurement. New York: Pergamon Bradshaw, P. 1972: Two more low-turbulence wind tunnels driven by centrifugal blowers. Imperial College Aero. Rep. no. 72-10 Bradshaw, P.; Koh, Y. M. 1981: A note on Poisson's equation for pressure in a turbulent flow. Phys. Fluids 24, 777 Bradshaw, P.; Morrison, J. F. 1986: Bursts and pressure fluctuations in turbulent boundary layers. US Army Final Technical Report, Contract No. DAJA45-84-C-0049 Chambers, F. W.; Murphy, M. D.; McEligot, D. M. 1983: Laterally converging flow, part 2: Temporal wall shear stress. J. Fluid Mech. 127, 403-428 Chen, C. P.; Blackwelder, R. F. 1978: Large scale motion in a turbulent boundary layer: a study using temperature contamination. J. Fluid Mech. 89, 1-31 Chen, M. Z.; Bradshaw, P. 1988: Studies of burst-detection schemes by use of direct simulation data for fully turbulent channel flow. Imperial College Report (in draft) Corino, E. R.; Brodkey, R. S. 1969: A visual observation of the wall region in turbulent flow. J. Fluid Mech. 37, 1- 30 Falco, R. E. 1984: Recent progress in understanding the turbulence production process. Michigan State Univ. Dept. Mech. Eng. Rep. TSL-84-1 Guezennec, Y. G. 1985: Documentation of large coherent structures associated with wall events in turbulent boundary layers. PhD thesis, Illinois Institute of Technology Hoffmann, P. H. 1981: The "WOMBAT" constant-temperature hot-wire anemometer. Imperial College Aero. Tech. Note 81-102 Johansson, A. V.; Alfredsson, P. H. 1982: On the structure of turbulent channel flow. J. Fluid Mech. 122, 295-314 Kovasznay, L. S. G.; Kibens, V.; Blackwelder, R. F. 1970: Large scale motions in the intermittent region of a turbulent boundary layer. J. Fluid Mech. 41,283-325 Lu, S. S.; Willmarth, W. W. 1973: Measurements of the Reynolds stress in a turbulent boundary layer. J. Fluid Mech. 60, 481-511
Luchik, T. S.; Tiederman, W. G. 1987: Timescale and structure of ejections and bursts in turbulent channel flows, J. Fluid Mech. 174, 529-552 Morrison, J. F.; Tsai, H. M.; Bradshaw, P. 1986: Conditionalsampling schemes based on the variable-interval time-averaging algorithm. Imperial College Aero Rept. 86-01 Morrison, J. F.; Subramanian, C. S. Bradshae, P. 1988a: Bursts and the law of the wall in turbulent boundary layers (in preparation) Morrison, J. F.; Subramanian, C. S.; Bradshaw, P. 1988b: Bursts and pressure fluctuations in turbulent boundary layers (in preparation) Muck, K. C. 1980: Comparison of various schemes for the generation of the turbulence intermittency function. Imperial College Aero. Rep. no. 80-03 Murlis, J.; Tsai, H. M.; Bradshaw, P. 1982: The structure of turbulent boundary layers at low Reynolds numbers. J. Fluid Mech. 122, 13-56 Often, G. R.; Kline, S. J. 1974: Combined dye-streak and hydrogen-bubble visual observations of a turbulent boundary layer. J. Fluid Mech. 62, 223-239 Subramanian, C. S.; Bradshaw, P. 1984: Apparatus and programs for digital analysis of fluctuating quantities in turbulent flow. Imperial College Aero Tech. Note 84-101 Subramanian, C. S.; Rajagopalan, S.; Antonia, R. A~; Chambers, A. J. 1982: Comparison of conditional sampling techniques in a turbulent boundary layer., J. Fluid Mech. 123,335-362 Subl'amanian, C. S.; Kandola, B. S.; Bradshaw, P. 1985: Measurements of the low-wave-number structure of a turbulent boundary layer. Imperial College Aero Tech. Note 85-01 Tsai, H. M. 1988: Some experimental contributions to the study of large-eddy structures in turbulent boundary layers. PhD thesis, Imperial College, London
Received May 24, 1988