CONFLICT PARTNERS AND INFRASTRUCTURE USE IN SAFETY CRITICAL EVENTS IN CYCLING – RESULTS FROM A NATURALISTIC CYCLING STUDY Katja Schleinitz*, Tibor Petzoldt*, Luise Franke-Bartholdt*, Josef F. Krems* & Tina Gehlert+ *Technische Universität Chemnitz, +German Insurers Accident Research
Accepted for publication in Transportation Research Part F: Traffic Psychology and Behaviour http://www.journals.elsevier.com/transportation-research-part-f-traffic-psychology-and-behaviour/
ABSTRACT Accident statistics show that cyclists are at considerable risk of being involved in a crash. However, statistics based on police reports are often heavily biased towards on-road, bicycle-motor vehicle crashes. Crashes that do not involve motorised vehicles or that occur on other types of infrastructure are neglected. Naturalistic cycling methodology appears to be a promising approach to address these issues. The goal of this study was to identify and classify safety critical cycling events involving a variety of conflict partners and covering all types of infrastructure. Thirty-one participants in three age groups had their own bicycles equipped with a data acquisition system. Participants rode their modified bike as usual for a period of four weeks. Over 1,600 trips were recorded overall. We were able to identify 77 safety critical events during the observation period. Only 43% of these events involved motorised vehicles as conflict partners. Conflicts with other cyclists and pedestrians accounted for about 57% of the situations. Likewise, less than 35% of the events occurred on-road. The data show that although motorised vehicles are still the single biggest threat to cycling safety, and roads still constitute one of the most crash prone types of infrastructure, the importance of crashes that do not involve motorised road users or occur not on-road should not be underestimated. Keywords: Bicycle, Conflicts, Crashes, Critical Events, Cyclist Behaviour Address for correspondence: Technische Universität Chemnitz, Department of Psychology, Cognitive and Engineering Psychology, 09107 Chemnitz, Germany, Contact:
[email protected]
NOTICE: This is the author’s version of a work submitted to Elsevier (Transportation Research Part F: Traffic Psychology and Behaviour). Changes resulting from the publishing process, including peer review, editing, corrections, structural formatting and other quality control mechanisms, may not be reflected in this document. Changes may have been made to this work since it was submitted for publication. The final version is available at www.sciencedirect.com (Journal: Transportation Research Part F: Traffic Psychology and Behaviour): http://dx.doi.org/ 10.1016/j.trf.2015.04.002 Citation: Schleinitz, K., Petzoldt, T., Franke-Bartholdt, L., Krems, J. F., & Gehlert, T. (2015). Conflict partners and infrastructure use in safety critical events in cycling - Results from a naturalistic cycling study. Transportation Research Part F: Psychology and Behaviour,35, 99-111. doi:10.1016/j.trf.2015.04.002
1. INTRODUCTION With 71 million bicycles (incl. electric bicycles) in German households, a number that has increased by three million since 2007 (Zweirad-Industrie-Verband, 2013), nearly every German citizen owned a bicycle in 2012. Cycling is expected to become even more popular in the coming years (Statistisches Bundesamt [Destatis], 2013), which makes cyclists a non-negligible part of road traffic. As a consequence thereof, the number of cyclist fatalities in Germany increased about three percent in the last twenty years (Statistisches Bundesamt [Destatis], 2013). In Europe, an increase of six percent was recorded just from 2010 to 2012 (European Commission, 2014). Cyclists constitute the secondmost accident and fatality prone road user group (Statistisches Bundesamt [Destatis], 2012a, 2012b). It is vital to reach a better understanding of the factors that might contribute to cycling crashes. What are the circumstances that lead to safety critical events (SCE)? What types of infrastructure are particularly dangerous? And who are the conflict partners? Unfortunately, as Walker (2011) notes: “With most aspects of bicycling research, the best we currently have are hints and incomplete stories.” (p. 367). While some specific aspects have been well researched, the overall image is patchy at best. One of the reasons is that until recently, the available research methods have not allowed researchers to draw a complete picture of cycling crashes or cyclist behaviour. 1.1. Assessing safety risks for cyclists Previous research mainly employed four different methods for investigating cyclists’ risk in traffic: 1) surveys or interviews with cyclists, 2) analysis of accident statistics or in-depth accident investigations, 3) hospital data, and 4) local observation. In surveys and interviews, cyclists are asked to recall safety critical situations from memory (Bacchieri, Barros, Dos Santos, & Gigante, 2010; Chaurand & Delhomme, 2013; Washington, Haworth, & Schramm, 2012). These methods help gain deeper insight into cyclists’ subjective experiences and help identify the factors that influence the perceived threat. For example, cyclists report a higher level of perceived threat as a result of risky motorist behaviour (e.g., failing to yield, not signalling when turning, tailgating, red light running) as compared to situations in which the same behaviour would be exhibited by a cyclist (Chaurand & Delhomme, 2013). Roundabouts are also perceived as a cause of threat, especially when a car is Citation: Schleinitz, K., Petzoldt, T., Franke-Bartholdt, L., Krems, J. F., & Gehlert, T. (2015). Conflict partners and infrastructure use in safety critical events in cycling - Results from a naturalistic cycling study. Transportation Research Part F: Psychology and Behaviour,35, 99-111. doi:10.1016/j.trf.2015.04.002
entering or exiting while a cyclist moves around (Møller & Hels, 2008). Likewise, mixed traffic with other road users is experienced as less safe than bike paths (Kolrep-Rometsch et al., 2012). However, such subjective reports are highly vulnerable to the influence of recall biases. One of the consequences can be an underreporting of less severe events (Bacchieri et al., 2010). Especially in cases in which older participants are asked to report the occurrence of rare events over a long period of time (such as crashes or critical events), data validity is questionable (Hagemeister & Tegen-Klebingat, 2012). Social desirability is another problem that can lead to systematic distortions in the data, as road users tend to conceal their own risky behaviour (Bacchieri et al., 2010). The investigation of accident statistics based police records, provides, at first glance, a more objective approach for assessing risk factors in cycling crashes (e.g. Alrutz et al., 2009; Atkinson & Hurst, 1982; Boufous, de Rome, Senserrick, & Ivers, 2012; Martínez-Ruiz et al., 2013; Pfaffenbichler, 2011). In-depth investigations (e.g. GIDAS, SafetyNet) add further information by assessing a relatively small sample of crashes in greater detail (e.g. Orsi, Ferraro, Montomoli, Otte, & Morandi, 2014; Otte, Jänsch, & Haasper, 2012; SafetyNet, 2009). Major risk factors that have been identified through the investigation of crashes include specific rider and driver traits and states (e.g. age, intoxication), intersections (and here, especially roundabouts), specific traffic cycling and driving manoeuvres (e.g. being overtaken, crossing, turning, speeding), environmental conditions (e.g. visual conditions), and the state of the bicycle (e.g. no lighting, defective brakes) (Boufous et al., 2012; Candappa et al., 2012; Daniels, Nuyts, & Wets, 2006; Martínez-Ruiz et al., 2013; Orsi et al., 2014). These factors have been linked to more frequent and / or more severe accidents. However, accident reports as well as in-depth investigations rely on retrospective accounts of the incident. These are prone to several forms of bias, which raises questions about the interpretation of findings based on these statistics. In addition, whereas it can be assumed that fatal accidents are fully captured in accident statistics, the potential underreporting of specific types of non-fatal bicycle accidents must be considered a serious issue (OECD/International Transport Forum, 2012; Tin Tin, Woodward, & Ameratunga, 2013). It is very likely that minor accidents without seriously injured conflict partners remain undocumented (Elvik & Mysen, 1999). Likewise, non-motorised vehicle accidents are often Citation: Schleinitz, K., Petzoldt, T., Franke-Bartholdt, L., Krems, J. F., & Gehlert, T. (2015). Conflict partners and infrastructure use in safety critical events in cycling - Results from a naturalistic cycling study. Transportation Research Part F: Psychology and Behaviour,35, 99-111. doi:10.1016/j.trf.2015.04.002
not reported to the police, and hence do not appear in official statistics (OECD/International Transport Forum, 2012; Twisk & Reurings, 2013). According to de Geus et al. (2012), only 7% of non-severe (minor injuries which lead to hospitalisation) bicycle accidents are registered in official accident statistics in Belgium. De Mol and Lammar (2006) showed that only 50% of traffic accidents in which cyclists are hospitalised are reported in European police statistics. This underreporting can lead to a severe bias in accident statistics, as the differences between bicycle crashes as they appear in official accident statistics and cycling injury data as they are collected by hospitals show (Lopez, Sunjaya, Chan, Dobbins, & Dicker, 2012). For instance, German accident data indicate that motorised vehicles are involved in more than three quarters of collisions that result in injury to cyclists (Statistisches Bundesamt, 2011). However, investigations of hospital data suggest that this rate might actually be below 40% (Juhra et al., 2012). Compared to crash investigations, hospital data can contribute to a better understanding of accidents, especially of minor or single bicycle accidents (Juhra et al., 2012; Niska, Gustafsson, Nyberg, & Erikson, 2013). These datasets contain a lot of the information that is also found in crash reports, but additionally include incidents that are not severe enough to be reported to the police. In addition, they include detailed information on the consequences of crashes, such as crash severity and specific injury type (Dennis, Ramsay, Turgeon, & Zarychanski, 2013; Short & Caulfield, 2014). It has been found that injuries of the lower extremities are particularly frequent, and were often the result of direct collisions with a motorised vehicle (Richter, 2005). Head injuries are common as well (Richter et al., 2007), and are reported to have been the cause of death in up to 70% of single bicycle accidents (Niska et al., 2013). However, like crash investigations, hospital data are prone to bias as they also rely on retrospective accounts of the incident. And even though a larger percentage of overall crashes is included, researchers have criticised those data because information about outpatient treatment is often not included (Haileyesus, Annest, & Dellinger, 2007; Teschke et al., 2012). While a combination of hospital data and crash statistics can certainly provide a more comprehensive picture (Cryer et al., 2001; Twisk & Reurings, 2013), the problem remains that the incident in question has not actually been observed or recorded by an independent party. Citation: Schleinitz, K., Petzoldt, T., Franke-Bartholdt, L., Krems, J. F., & Gehlert, T. (2015). Conflict partners and infrastructure use in safety critical events in cycling - Results from a naturalistic cycling study. Transportation Research Part F: Psychology and Behaviour,35, 99-111. doi:10.1016/j.trf.2015.04.002
Observational studies usually do not suffer from such biases. In most cases, cameras are placed in hidden locations to observe defined environments, such as intersections (Bai, Liu, Chen, Zhang, & Wang, 2013; Monsere, Mcneil, & Dill, 2012; Summala, Pasanen, Räsänen, & Sievänen, 1996) or one-way streets (Bjørnskau, Fyhri, & Sørensen, 2012). This method is especially useful for investigating accident black spots or specific phenomena like Red Light Running (Johnson, Newstead, Charlton, & Oxley, 2011). Observational studies on cycling accidents with turning cars found that a simple lack of sight or shoulder checks by the motorist (Kolrep-Rometsch et al., 2012), or more specific deficiencies in their visual scanning behaviour (Räsänen & Summala, 1998) might be blamed for a vast number of turning crashes. Observations of bicycle paths have shown that crossing pedestrians were the most common conflict partner (van der Horst, de Goede, de Hair-Buijssen, & Methorst, 2014). However, as cyclists and their behaviour outside the predefined environment are not observable, the approach cannot provide a complete picture of dangerous traffic situations. For example, it is likely that in the observation of intersections, the proportion of conflicts with motorised traffic might be higher compared to the share of such conflicts overall. Field studies of traffic behaviour represent a promising approach for overcoming the limitations of the aforementioned methods. For nearly two decades, so called Naturalistic Driving Studies (NDS) have used cameras and sensors to record drivers’ behaviour in their everyday and accustomed driving environment to obtain externally valid data that is not contaminated by experimental manipulation or the apparent presence of a researcher. However, even in research in which data are collected for hundreds of drivers over multiple years, crashes rarely observed. Therefore, researchers rely mostly on so called safety critical events as a proxy, an approach that is based on the ‘Heinrich triangle’ (Heinrich, Petersen, & Roos, 1980) and which is supported e.g. by Guo, Klauer, McGill, & Dingus, (2010). SCEs can be defined as “[s]ituations (including crashes) that require a sudden, evasive manoeuvre to avoid a crash or to correct for unsafe acts performed by the driver himself/herself or by other road users”(Bagdadi, 2013, p. 118). The most prominent examples to date are the 100-Car Study (Dingus et al., 2006; Neale, Dingus, Klauer, Sudweeks, & Goodman, 2005) and the recently completed SHRP2 project (Campbell, 2013), which focused specifically on accidents Citation: Schleinitz, K., Petzoldt, T., Franke-Bartholdt, L., Krems, J. F., & Gehlert, T. (2015). Conflict partners and infrastructure use in safety critical events in cycling - Results from a naturalistic cycling study. Transportation Research Part F: Psychology and Behaviour,35, 99-111. doi:10.1016/j.trf.2015.04.002
and critical situations in car driving. A similar project is also under way in Europe, in which not only cars and trucks, but also motorised two-wheelers are part of the sample (Eenink, Barnard, Baumann, Augros, & Utesch, 2014). Given that data in NDS are not based on subjective information, results are not influenced by recall bias or social desirability. Behaviour in traffic is recorded in its entirety, so there is no systematic underreporting of several types of incidents or accidents. Consequently, an observation of factors that precede and influence SCEs becomes possible; thereby, allowing for a comprehensive understanding of such situations. 1.2. Naturalistic Cycling Studies Based on the NDS methodology, in recent years, a handful of so called Naturalistic Cycling Studies (NCS) investigated aspects of mobility and cycling behaviour (Dozza & Werneke, 2014; Gustafsson & Archer, 2013; Johnson, Charlton, Oxley, & Newstead, 2010; Knowles, Aigner-Breuss, Strohmayer, & Orlet, 2012). Johnson et al., (2010) recorded 13 Australian commuters on their commuter cycling trips using helmet cameras for a maximum of 12 hours each. Overall, two collisions, six near-collisions and 46 critical incidents were classified, all of them involving another motorised road user. In nearly 90% of the situations, drivers were judged to have been at fault. About 70% of the events occurred at an intersection or were annotated as intersection-related. A similar study investigating SCEs was conducted in Sweden (Dozza & Werneke, 2014). Sixteen cyclists rode test bicycles equipped with recording instruments and used them as substitutes for their own bikes for a period of two weeks. Participants were required to press a button on the handlebar to indicate any SCE they experienced. In the analysis, intersections and situations in which other road users crossed the bicyclist’s route were identified as major risk factors. While previous projects successfully demonstrated the feasibility of NCS in general, most of them did not fully utilize the potential of this methodology. Small sample sizes (e.g. N = 5, Knowles et al., 2012) or lack of behavioural or demographic representativeness in the sample (e.g. sample of working age cyclists that used their bikes primarily for commuting, see Gustafsson & Archer, 2013; Johnson et al., 2010) limit the external validity of the results. Others have further reduced external validity by placing restrictions on the types of trips that would be recorded and analysed, e.g. Citation: Schleinitz, K., Petzoldt, T., Franke-Bartholdt, L., Krems, J. F., & Gehlert, T. (2015). Conflict partners and infrastructure use in safety critical events in cycling - Results from a naturalistic cycling study. Transportation Research Part F: Psychology and Behaviour,35, 99-111. doi:10.1016/j.trf.2015.04.002
excluding off-road trips, such as trips on bike paths or on the pavement (Johnson et al., 2010). The focus on specific user groups, types of infrastructure and types of trips considerably limits the generalisability of findings. In particular, due to general sociodemographic trends, the number of elderly cyclists has increased and further increases are expected (Kubitzki & Janitzek, 2009; Steffens, Pfeiffer, & Schreiber, 1999). However, this trend has not been reflected in the participant samples of previous studies. People cycle for reasons other than transportation (Moudon et al., 2005) and cycling does not only occur on the road (Dill & Carr, 2003); yet, so far, this has been the focus of naturalistic cycling studies. Therefore, the goal of our study was to identify and describe SCEs (and crashes) in cycling for all kinds of trips, across all types of infrastructure, and with a participant sample that also included older cyclists using the naturalistic cycling methodology. Of specific interest were the conflict partners that are involved in SCEs, and the types of infrastructure on which such events occur. 2. METHOD 2.1. Participants 2.1.1. Participant recruitment We recruited participants for the NCS through different media, including ads in newspapers and flyers in cycling shops. The prospective participants completed a recruitment questionnaire, which included questions gathering contact information, socio-demographic status and bicycle technical data. Also, as part of the project, a sample of electric bike users was recruited, which is not a subject of this paper. Potential participants were required to use their bike at least three days per week. In addition, we tried to recruit at least ten riders for each of our three age groups (see Table 1). 2.1.2. Participants A total of 32 cyclists (divided in three age groups - 40 years and younger, 41 - 64 years, 65 years and older) took part in the study. We had one dropout, which left us with 31 participants with usable data (see Table 1). As we had only a few female applicants, gender was not distributed evenly in the sample. Most participants reported owning two or more bicycles in their households. Thirty of them had a driver licence. All participants received monetary compensation of 100€. Citation: Schleinitz, K., Petzoldt, T., Franke-Bartholdt, L., Krems, J. F., & Gehlert, T. (2015). Conflict partners and infrastructure use in safety critical events in cycling - Results from a naturalistic cycling study. Transportation Research Part F: Psychology and Behaviour,35, 99-111. doi:10.1016/j.trf.2015.04.002
Table 1: Sample overview. Age group
M age
SD age
Min age Max age
Male
Female
Total
≤ 40 years
30.7
6.2
24
39
5
5
10
41 to 64 years
52.4
8.0
41
62
7
3
10
≥ 65 years
69.5
3.2
65
74
7
4
11
Total
51.5
17.2
24
74
19
12
31
2.2. Data Acquisition System (DAS) A small box containing two cameras (Type ACME FlyCamOne eco V2) was installed on the handlebars of the participants’ bicycles. One camera recorded the face of the cyclist while the other one was forward facing. The videos were recorded with a resolution of 720x480 pixels (VGA) at 30 frames per second. In addition, speed sensors were installed on the front wheel (2 Hz recording rate). All data were stored on two SD-memory cards, one for video (32 GB) and one for speed data (4 GB). Recording was started and stopped with a flip switch. Trained technicians installed and uninstalled the DAS on participants’ bicycles. 2.3. Procedure The study was carried out in and around Chemnitz (Germany). Participants were instructed to use their own bicycles. Data were recorded over a period of four weeks for each participant between July and November 2012. Participants were instructed to use their bicycle as usual and were directed to record all their trips with the DAS. Weather conditions varied from hot and sunny in summer to cold and icy in October. An individual appointment for the installation of the DAS was arranged for each participant. A technician mounted the DAS on the participants’ bicycle and conducted a short cycling skill test with the participants in order to check their ability level (no specific deficits were observed). During installation, participants completed the pre-observation survey. Required maintenance procedures (DAS repairs, exchange of storage media) were carried out by trained technicians. After four weeks, the DAS was dismounted and participants completed the postobservation survey. 2.4. Data preparation Citation: Schleinitz, K., Petzoldt, T., Franke-Bartholdt, L., Krems, J. F., & Gehlert, T. (2015). Conflict partners and infrastructure use in safety critical events in cycling - Results from a naturalistic cycling study. Transportation Research Part F: Psychology and Behaviour,35, 99-111. doi:10.1016/j.trf.2015.04.002
2.4.1. Video annotation Before actual video annotation began, the material was checked for quality. In total, 85 videos had to be excluded from the analysis. Among these were recordings in which the bicycle was parked (n = 55) or in which the cyclists walked the bicycle (n = 10), i.e. no actual riding occurred. Only a small faction had to be excluded because of technical issues (n = 9) or because insufficient lighting during night time riding made annotation impossible (n = 11). To annotate the usable video material, we used ELAN (Wittenburg, Brugman, Russel, Klassmann, & Sloetjes, 2006), a free application provided by the Dutch Max Planck Institute for Psycholinguistics. The overall annotation procedure was based on Klauer, Perez, and McClafferty (2011). All annotators received a special training on the classification system used for annotation. Each annotation was double checked by a senior annotator. Any discrepancies were discussed and resolved in team meetings. A three-step annotation procedure was developed to facilitate the analysis of SCEs and crashes. In the first step, videos were reviewed in order to identify potential events. As the identification of single bike events (apart from actual crashes) is very difficult and prone to error, we focused on SCEs which occurred during interactions with other road users. We classified such SCEs in accordance with Reynolds', Harris', Teschke's, Cripton's, and Winters' (2009) definition of a conflict as an “interaction between a bicyclist and another road user such that at least one of the parties has to change speed or direction to avoid a collision” (p. 4). Every potential SCE was reviewed and discussed with a group of annotators and the senior researcher before a decision was taken to include or not include it in the final set of events. In the second step, the conflict partner (see Table 2) and the infrastructure the participant was travelling on (see Table 3) were annotated for each SCE. The classification of infrastructure was based on definitions found in German road traffic regulations (StVO). In the final step, a verbal description of the event was added to allow for a more vivid characterisation. This verbal description was standardised in a way that still allowed us to categorise situations based on the description. In total, 1,974 videos were reviewed and annotated in case an SCE was identified.
Citation: Schleinitz, K., Petzoldt, T., Franke-Bartholdt, L., Krems, J. F., & Gehlert, T. (2015). Conflict partners and infrastructure use in safety critical events in cycling - Results from a naturalistic cycling study. Transportation Research Part F: Psychology and Behaviour,35, 99-111. doi:10.1016/j.trf.2015.04.002
Table 2: Overview of annotated categories for conflict partners. Conflict partner
Description
Pedestrian Bicycle
Bicycle, electric bicycle
Powered two wheeler
Motorbike, moped
Car
Car up to light commercial vehicle
Lorry Bus Rail transport
Train, tram
Other motorised vehicle
Mobility scooter, tractor
Multiple conflict partners
More than one type of road user, e.g. pedestrian with dog, or pedestrian and cyclist at the same time
Table 3: Overview of annotated categories for type of infrastructure. Type of infrastructure
Description
Road
Regular road (shared with motorised vehicles), lane
Bicycle infrastructure
Bicycle lane, bike path
Pavement Pedestrian area Unpaved
Forest or field path
Miscellaneous
All other types of infrastructure, e.g. parking facility, small path between houses
An additional layer of video annotation was introduced to investigate infrastructure use in non-critical situations. For each participant, the infrastructure he/she was travelling on was annotated for each trip continuously. In total, 1,449 videos with a duration of about 383 hours were annotated. As the main goal of this annotation was to assess distance travelled on the different types of infrastructure, only trips for which usable speed sensor data were available were annotated – see 2.4.2. 2.4.2. Sensor data Citation: Schleinitz, K., Petzoldt, T., Franke-Bartholdt, L., Krems, J. F., & Gehlert, T. (2015). Conflict partners and infrastructure use in safety critical events in cycling - Results from a naturalistic cycling study. Transportation Research Part F: Psychology and Behaviour,35, 99-111. doi:10.1016/j.trf.2015.04.002
In addition to the video data, we collected speed sensor data for each trip. The data of 28 participants were analysable (due to technical difficulties, data could not be obtained from three participants). Subsequently, speed and distance data were synchronised with the video annotations in our database. This made it possible to, for example, link infrastructure use (video) with travel distance (wheel sensor) to calculate the distance travelled on a specific type of infrastructure. 2.5. Data analysis In order to assess SCEs for each of our three age groups, we analysed the time of day during which the SCE occurred, the conflict partners that were involved, the type of infrastructure on which the SCE took place, and the speed at which the cyclist was travelling immediately before the SCE. We also assessed the verbal description of the event, and used this qualitative information to determine the rate of traffic violations that occurred immediately before the SCE. A safety incident rate (SIR) (OECD/International Transport Forum, 2013) was calculated as the number of SCEs per 100km cycled for the different times of day and infrastructure types. Relative risk was calculated for select aspects by comparing two SIRs. 3. RESULTS Because of technical issues, video data were available for 31 participants and speed sensor data were only available for 28 participants. As we were mainly interested in the SCEs (which were identified through video review), we decided to keep all 31 datasets for analysis. In this results section, we always report the number of datasets (either N = 31 or N = 28) that were the basis for the analysis. In general, analyses that relied solely on the videos included 31 datasets. Any analysis that involved speed sensor data (speed, distance, time of day) used 28 datasets. 3.1. Mobility behaviour Overall, our participants (N = 28) recorded 1,667 trips with a total distance of 5,280 kilometres and 372 hours of riding during the four weeks of data collection. On average, each participant cycled about 188.30 km during the study, with a mean trip distance per cyclist of 3.53 km (SD = 2.52 km). This translates into a mean of 13.30 hours (SD = 6.93) riding per cyclist overall, and a mean single trip Citation: Schleinitz, K., Petzoldt, T., Franke-Bartholdt, L., Krems, J. F., & Gehlert, T. (2015). Conflict partners and infrastructure use in safety critical events in cycling - Results from a naturalistic cycling study. Transportation Research Part F: Psychology and Behaviour,35, 99-111. doi:10.1016/j.trf.2015.04.002
duration of 15 min. It has to be noted that there were substantial differences in total distance covered (range 30.19 to 425.82 km) and total cycling duration (range 2.90 to 29.73 hours) between participants. Total mean speed was about 13.87 km/h (SD = 2.89), ranging from 9.03 km/h for the slowest and 20.15 km/h on average for the fastest participant. The participants aged 41 to 64 years produced the highest average mileage (M = 210.86 km, SD = 113.26 km) and the longest overall riding time (M = 14.88 hours, SD = 8.27 hours). The older cyclists rode about 198.30 km / 14.42 hours each (SD = 131.38 km / 7.36 hours), the younger group 149.14 km / 9.98 hours (SD = 69.67 km / 3.45 hours). However, due to large in-group variance, there were no significant differences between the three age groups for either total mileage or total cycling duration. In terms of average speed, the older cyclists rode a little slower (M = 12.70 km/h, SD = 2.77 km/h) than the other two groups (41-64 years: M = 14.40 km/h, SD = 2.16 km/h, under 40 years: M = 14.90 km/h, SD = 3.50 km/h). However, again, there were no significant differences between the three age groups. 3.2. Safety critical events A total of 77 SCEs (N = 31) were identified, an average of 2.48 events per participating cyclist (see Table 4 for an overview). Nearly 30% of the participants was not involved in any SCE. The majority (52%) experienced one to three events. Only six cyclists were involved in five or more SCEs. As Table 4 shows, there were hardly any differences between the age groups with regard to the number of SCEs. A Kruskal-Wallis-Test (data not normally distributed) confirmed this impression (H(2) = 0.654, p = .721, d = 0.18). In addition, we calculated the safety incident rate (SIR, Table 4). Again, we found no significant differences between the three age groups (H(2) = 0.481, p = .786, d = 0.32). However, it has to be acknowledged that test power was comparatively low (25%).
Citation: Schleinitz, K., Petzoldt, T., Franke-Bartholdt, L., Krems, J. F., & Gehlert, T. (2015). Conflict partners and infrastructure use in safety critical events in cycling - Results from a naturalistic cycling study. Transportation Research Part F: Psychology and Behaviour,35, 99-111. doi:10.1016/j.trf.2015.04.002
Table 4: Descriptive statistics for SCEs per age group (N = 31). Total
M
SD
Median
Min
Max
SIR
≤ 40 years
25
2.50
2.55
1.5
0
7
1.92
41-64 years
28
2.80
3.46
2.5
0
12
1.19
≥ 65 years
24
2.19
2.96
1.0
0
9
1.29
Total
77
2.48
2.92
2.0
0
12
1.44
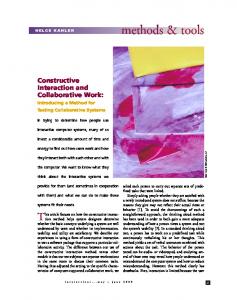
For all age groups, the majority of the events occurred in the afternoon between 14:00 and 17:00 (N = 28). This roughly corresponds with the time at which most cycling took place (see Figure 1). In general, exposure and the relative frequency of SCEs appeared to be congruent (rall = .931, r≤ 40 = .828, r41-64 = .882, r≥ 65 = .908). However, even when corrected for exposure, the risk of an SCE appears to be highest in the afternoon hours (see Table 5). The analysis of SIRs for the different age groups and time of day segments also showed that SIR peaks for the younger and older cyclist groups in the morning between 8:00-10:59, with 1.75 (younger group) and 1.41 (older group) events per 100 km. For the younger group, this equals an increase in risk of about 50% compared to the time of day during which most cycling took place (afternoon).
Citation: Schleinitz, K., Petzoldt, T., Franke-Bartholdt, L., Krems, J. F., & Gehlert, T. (2015). Conflict partners and infrastructure use in safety critical events in cycling - Results from a naturalistic cycling study. Transportation Research Part F: Psychology and Behaviour,35, 99-111. doi:10.1016/j.trf.2015.04.002
Figure 1: Proportion of SCEs and cycling distance for different times of day (N = 28).
Table 5: SIR dependent on time of day (N = 28).
≤ 40 years
0.96
1.75
11:0013:59 0.00
41-64 years
1.52
0.00
1.40
1.96
1.41
0.00
-
≥ 65 years
-
1.41
0.68
1.53
0.59
-
-
0.00
-
5:00-7:59
Total
8:00-10:59
14:0016:59 1.19
17:0019:59 0.86
1.15 1.08 0.78 1.61 1.06 Note. SIR only reported for cells with at least 100 trip kilometres.
20:0022:59 -
23:00-4:59 -
In order to assess the potential effect of specific types of infrastructure on the occurrence of SCEs, we compared the amount of exposure to different infrastructure types to the relative frequency of SCEs across different types of infrastructure (N = 28). Table 6 displays the absolute mileage and Citation: Schleinitz, K., Petzoldt, T., Franke-Bartholdt, L., Krems, J. F., & Gehlert, T. (2015). Conflict partners and infrastructure use in safety critical events in cycling - Results from a naturalistic cycling study. Transportation Research Part F: Psychology and Behaviour,35, 99-111. doi:10.1016/j.trf.2015.04.002
the respective proportion of total mileage on each type of infrastructure, the number of SCEs and the SIR (for all age groups). Most of the time, participants were travelling on the road (i.e. in mixed traffic with motorised road users). For approximately one fourth of total trip distance, participants used bicycle-specific infrastructure (the younger cyclists used it somewhat less). Interestingly, about 10% of total trip distance was travelled on the pavement (14% in the youngest group), even though cycling on the pavement is in most cases illegal for adults in Germany. When comparing infrastructure type exposure and relative frequency of SCEs, some clear discrepancies became apparent. While travelling on the road accounted for more than half of total trip distance, only about one third of the events occurred there. Another third of all SCEs was observed when participants used bicycle infrastructure, although this type of infrastructure was used for only one fourth of their distance. When comparing the SIR, the risk of an SCE on bicycle infrastructure was two times higher than on roads. This seems to be especially true for the two older groups, whereas the SIR was about the same for on-road cycling and cycling on bicycle infrastructure for cyclists of 40 years or younger. In general, it appears relatively safe to travel on unpaved roads and paths, with the risk of an SCE only 0.28-0.31 times the risk of an SCE on cycling infrastructure or the pavement. This is presumably because other road users are seldom encountered on unpaved roads. For our miscellaneous category (which included small paths between houses/in allotments or parking facilities), we found a comparatively high SIR. This might be explained by the fact that these types of infrastructure usually do not have (clear) rules and regulations. At the same time, it has to be acknowledged that these specific SCEs typically are low speed events.
Citation: Schleinitz, K., Petzoldt, T., Franke-Bartholdt, L., Krems, J. F., & Gehlert, T. (2015). Conflict partners and infrastructure use in safety critical events in cycling - Results from a naturalistic cycling study. Transportation Research Part F: Psychology and Behaviour,35, 99-111. doi:10.1016/j.trf.2015.04.002
Table 6: SCE, distance cycled and SIR on different types of infrastructure (N = 28). Distance cycled (km)
Proportion of total distance cycled (in %)
Number of SCEs
Proportion of total number of SCEs (in %)
SIR
Age groups
Infrastructur e
≤ 40 years
Road
612.7
60.7
8
50.0
1.31
Bicycle infrastructur e
184.6
18.3
2
12.5
1.08
Pavement
142.9
14.2
4
25.0
2.80
Pedestrian area
34.4
3.4
0
0.0
-
Unpaved
13.7
1.4
2
12.5
-
Miscellaneous
20.1
2.0
0
0.0
-
Total
1,008.4
100.0
16
100.0
1.59
Road
800.2
48.2
6
24.0
0.75
Bicycle infrastructur e
467.6
28.2
14
56.0
2.99
Pavement
161.2
9.7
3
12.0
1.86
Pedestrian area
33.6
2.0
0
0.0
-
Unpaved
146.8
8.9
0
0.0
0.00
Miscellaneous
50.4
3.0
2
8.0
-
1,659.8
100.0
25
100.0
1.51
41-64 years
Total
Citation: Schleinitz, K., Petzoldt, T., Franke-Bartholdt, L., Krems, J. F., & Gehlert, T. (2015). Conflict partners and infrastructure use in safety critical events in cycling - Results from a naturalistic cycling study. Transportation Research Part F: Psychology and Behaviour,35, 99-111. doi:10.1016/j.trf.2015.04.002
≥ 65 years
All participants
Road
1052.9
54.4
8
33.3
0.76
Bicycle infrastructur e
465.3
24.0
7
29.2
1.51
Pavement
175.5
9.1
4
16.7
2.28
Pedestrian area
18.6
1.0
0
0.0
-
Unpaved
155.2
8.0
0
0.0
-
Miscellaneous
68.3
3.5
5
20.8
-
Total
1.935.8
100.0
24
100.0
1.40
Road
2465.8
53.6
22
33.8
0.89
Bicycle infrastructur e
1117.5
24.3
23
35.4
2.06
Pavement
479.6
10.4
11
16.9
2.29
Pedestrian area
86.6
1.9
-
-
-
Unpaved
315.7
6.9
2
3.1
0.63
Miscellaneous
138.8
3.0
7
10.8
5.04
Total
4604.0
100.0
65
100.0
1.41
Note. SIR only reported for cells with at least 100 trip kilometres. An overview of the SCE conflict partners and the infrastructure used when the SCE occurred (N = 31) is given in Table 7. The most frequent conflict partners were cars, followed by pedestrians and other cyclists. This pattern was more or less identical for all three age groups (see Appendix Table A1). As could be expected, the majority of car-bicycle conflicts occurred when the participants were using the road for cycling. Likewise, most bicycle-bicycle conflicts were observed on cycling infrastructure. The pattern was less clear for conflicts involving pedestrians and multiple road users (mostly pedestrians with dogs).
Citation: Schleinitz, K., Petzoldt, T., Franke-Bartholdt, L., Krems, J. F., & Gehlert, T. (2015). Conflict partners and infrastructure use in safety critical events in cycling - Results from a naturalistic cycling study. Transportation Research Part F: Psychology and Behaviour,35, 99-111. doi:10.1016/j.trf.2015.04.002
Table 7: Number of SCEs per type of infrastructure and conflict partner (N = 31). Infrastructure Road
Bicycle infrastructure
Pavement
Car
20
4
3
0
0
3
30
Bicycle
3
9
2
2
0
0
16
Pedestrian
3
5
8
0
2
4
22
Lorry
1
0
0
0
0
0
1
Bus
0
1
0
0
0
0
1
0
1
0
0
0
0
1
0
5
0
0
0
1
6
27
25
13
2
2
8
77
Conflict partner
Other motorised vehicle Multiple conflict partners Total
Pedestrian Unpaved Miscellaneous area
Total
Note. Only categories with at least one SCE are reported in this table. There were substantial differences in the type of situations observed in conflicts with motorised road users, other cyclists and pedestrians (N = 31, see Table 8). SCEs with motorised vehicles were frequently caused by drivers failing to yield the right of way to the cyclist. A typical situation was a motorised vehicle turning right and crossing the bike path (apparently) without checking for cyclists. Another common error was observed at intersections, at which the motorised vehicle failed to yield to the cyclist who was approaching from the right. In addition, several SCEs were caused by parking and turning manoeuvres. In interactions with other cyclists, many situations were characterised by sudden and presumably unexpected manoeuvres of the other cyclist. Conflicts also arose as a result of passing or being passed closely either in the same (overtaking) or opposite direction. Similar situations occurred with pedestrians, although the event category that occurred most frequently was the crossing situation, e.g. a pedestrian on the pavement that crossed the road or the cycle path in order to get to the other side of the road. Citation: Schleinitz, K., Petzoldt, T., Franke-Bartholdt, L., Krems, J. F., & Gehlert, T. (2015). Conflict partners and infrastructure use in safety critical events in cycling - Results from a naturalistic cycling study. Transportation Research Part F: Psychology and Behaviour,35, 99-111. doi:10.1016/j.trf.2015.04.002
Table 8 further breaks down the situation classification by the three different age groups. While descriptively, some peaks for certain groups and situations (e.g. conflicts with parking and turning vehicles mostly for younger cyclists) are visually indentifiable, the cell sizes are too small to justify a detailed comparison. Table 8: SCEs in detail (N = 31). Description of the SCE
Number of SCE ≤ 40 years
41-64 years
≥ 65 years
2
4
3
9
2
1
1
4
5
1
1
7
1
2
1
4
2
0
0
2
1
0
1
2
0
2
1
3
1
1
1
3
1
5
2
8
3
1
2
6
Total
Conflict with motorised vehicle Trajectories of motorised vehicle and participant crossed Motorised vehicle failed to yield to participant Participant failed to yield to motorised vehicle Parking or turning manoeuvre of motorised vehicle. entering path of participant Motorised vehicle and participant travelled in the same direction Motorised vehicle closely passed participant Participant tried to pass stopped/slow motorised vehicle too closely (passing attempt aborted) Motorised vehicle swerved or suddenly stopped in front of participant Motorised vehicle and participant travelled in opposite directions Motorised vehicle passed another vehicle using path of oncoming participant Conflict with cyclist(s) Trajectories of cyclist(s) and participant crossed, other cyclist(s) unexpectedly crossed path of participant Cyclist(s) and participant travelled in the same direction, sudden braking or swerving by other cyclist(s) in front of participant Cyclist(s) and participant travelled in opposite directions, irritation about how to go about passing each other
Citation: Schleinitz, K., Petzoldt, T., Franke-Bartholdt, L., Krems, J. F., & Gehlert, T. (2015). Conflict partners and infrastructure use in safety critical events in cycling - Results from a naturalistic cycling study. Transportation Research Part F: Psychology and Behaviour,35, 99-111. doi:10.1016/j.trf.2015.04.002
Conflict with pedestrian(s) Trajectories of pedestrian(s) and participant crossed, pedestrian(s) crossed path of participant (e.g. jaywalking) Pedestrian(s) and participant travelled in the same direction, pedestrian(s) suddenly stopped or moved into path in front of participant Pedestrian(s) and participant travelled opposite directions, oncoming pedestrian(s) entered path of participant unexpectedly Conflicts with dogs (unexpectedly entering path of participant)
4
2
6
12
2
2
0
4
1
5
2
8
0
2
3
5
We also investigated obvious traffic violations in SCEs (see Table 9). In more than half of the SCEs, no obvious violation by our participant or the conflict partner was observed. In seven cases, neither of the two conflict partners fully complied with the road rules. The number of participant violations were similar for each age group (n ≤ 40 = 8, n 41-64 = 7, n ≥ 65 = 7). A detailed description of the nature of the violations is displayed in Table 10. The most common participant violation in observed SCEs was the use of the wrong infrastructure, e.g. pavement instead of road. Consequently, such SCEs mostly involved pedestrians. We also observed several SCEs in which our participants cycled against the direction of traffic (on cycling infrastructure). The most common violation of conflict partners in SCEs was the failure to yield, usually by motorised vehicles.
Citation: Schleinitz, K., Petzoldt, T., Franke-Bartholdt, L., Krems, J. F., & Gehlert, T. (2015). Conflict partners and infrastructure use in safety critical events in cycling - Results from a naturalistic cycling study. Transportation Research Part F: Psychology and Behaviour,35, 99-111. doi:10.1016/j.trf.2015.04.002
Table 9: Participant and conflict partner violations immediately before the SCE (N = 31).
No violation Participant behaviour
Behaviour of conflict partner No violation Violation Total 42 13 55
Violation
15
7
22
Total
57
20
77
Table 10: Participant and conflict partner violations immediately before the SCE in detail (N = 31).
Participant
Conflict Partner
Wrong type of infrastructure
13
3
Failure to yield
4
9
Cycling against direction of traffic
6
2
Overtaking on the wrong side
2
0
Moving out of parking space without signal
0
4
Opening the door Changing into a participant’s lane in a way that forces the participant to take evasive action (e.g., brake, dodge) [referred to as Nötigung in Germany] Note. Multiple violations could occur at the same time.
0
1
0
2
Violations in detail
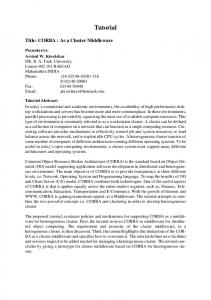
While the relatively low logging frequency (2Hz) did not allow for the creation of meaningful speed profiles in the SCEs, we used speed data to describe the conditions that preceded the event (N = 28). We calculated mean speed over a period of 10s directly preceding the SCE. This was compared to the distance travelled at this speed (Figure 2). It is important to note the difference between the two distributions. While there is a clear peak between 15 and 20 km/h for the distance cycled (with an apparently normal distribution around this peak), a visual assessment of the SCE distribution indicates a shift towards lower speeds. This appears to be true (with minor variations) for all three age groups.
Citation: Schleinitz, K., Petzoldt, T., Franke-Bartholdt, L., Krems, J. F., & Gehlert, T. (2015). Conflict partners and infrastructure use in safety critical events in cycling - Results from a naturalistic cycling study. Transportation Research Part F: Psychology and Behaviour,35, 99-111. doi:10.1016/j.trf.2015.04.002
Figure 2: Proportion of SCEs and distance cycled at different speeds (N = 28). 4. DISCUSSION AND CONCLUSIONS The aim of the study was to investigate SCEs in cycling using a naturalistic cycling methodology. We were able to identify 77 events in about 400 hours of cycling. We found no differences between our different age groups with regard to the relative frequency of SCEs, which suggests that older cyclists are not more at risk than younger cyclists are. However, it has to be acknowledged that the consequences of a crash are usually more severe for older cyclists (e.g. Boufous et al., 2012; Rodgers, 1997; Statistisches Bundesamt [Destatis], 2013). Kaplan, Vavatsoulas, and Prato (2014) claim that compared to younger people, cyclists over 60 years old are at a much greater risk of sustaining severe injuries. Citation: Schleinitz, K., Petzoldt, T., Franke-Bartholdt, L., Krems, J. F., & Gehlert, T. (2015). Conflict partners and infrastructure use in safety critical events in cycling - Results from a naturalistic cycling study. Transportation Research Part F: Psychology and Behaviour,35, 99-111. doi:10.1016/j.trf.2015.04.002
Clear differences were observed between data on conflict partners in our dataset and analogous data found in accident statistics (Statistisches Bundesamt, 2011). Although cars were still the most frequent conflict partner, the proportion of incidents involving motorised vehicles was only slightly above 40%, while SCEs with pedestrians and other cyclists combined accounted for 57% of all incidents. This finding is in line with the results of the NCS of Dozza and Werneke (2014). Proportions found in travel diary data (de Geus et al., 2012) differ slightly, however not fundamentally, as collisions with cars were reported as causes of a crash about as often (11.4% of all cases) as collisions with pedestrians (5.7%) or cyclists (4.3%) combined. The proportions found in hospital data strongly depend on the level of severity that is analysed. When looking into hospitalisations only, the proportion of crashes involving motorised vehicles is much higher (Short & Caulfield, 2014). Data from patients who were admitted to an emergency care unit indicate a proportion of 4:1 between crashes involving motorised vehicles and crashes involving other cyclists (Juhra et al., 2012). Ellwein (2011) reported a proportion of about 2.5:1 between cars and cyclists. When examining SCEs across different types of infrastructure, it became apparent that the risk of SCEs on designated cycling infrastructure per distance travelled was relatively high. In contrast, the risk of an SCE on the road per distance travelled was rather low. It has to be noted that in travel diaries (de Geus et al., 2012) and data collected at crash scenes (Richter et al., 2007), the proportion of crashes that occurred on the road was close to 70%. However, these studies were not able to control for exposure, so it is unclear how this relatively high number relates to actual risk. Still, the fact that the conflict partner in our road incidents was most often a motorised vehicle implies that the consequences of a crash on the road would also be more severe (Kaplan et al., 2014; Walter, Achermann Stürmer, Scaramuzza, Niemann, & Cavegn, 2012). In general, it is important to note that less than a half of the identified events involved other motorised vehicles or occurred on-road. This clearly indicates that the sole focus on on-road, bicyclemotor vehicle conflicts found in official statistics, as well as a considerable part of the available research, is not justified. It also cannot be argued that such incidents are negligible. Twisk and Reurings (2013) point out that under daylight conditions, cycling collisions that do not involve Citation: Schleinitz, K., Petzoldt, T., Franke-Bartholdt, L., Krems, J. F., & Gehlert, T. (2015). Conflict partners and infrastructure use in safety critical events in cycling - Results from a naturalistic cycling study. Transportation Research Part F: Psychology and Behaviour,35, 99-111. doi:10.1016/j.trf.2015.04.002
motorised vehicles (mostly single vehicle incidents) account for twice as many injuries as collisions with motorised vehicles. Others have reported similar results (de Geus et al., 2012; Tin Tin, Woodward, & Ameratunga, 2010). The high proportion of hospital admissions as a result of collisions not involving motorised vehicles (Stutts, Williamson, Whitley, & Sheldon, 1990) provides evidence that such crashes are a significant health issue and an economic burden (Veisten et al., 2007). The results of Juhra et al., (2012) also showed that there are differences in the types of injuries that are caused by bicycle-motor vehicle collisions and other crashes involving bicycles. Whereas traumatic brain injury was the most frequent type of injury resulting from a collision with a motorised vehicle, fractures of the upper extremities were the most common injury in all other types of crashes. This is further evidence that an approach, which includes not only motorised vehicles as conflict partners, but also non-motorised road users and single vehicle crashes, is required. It has to be acknowledged that the overall number of incidents in our dataset was rather small. With only a few events observed in certain event categories (e.g. conflicts with lorries), the conclusions that can be drawn are somewhat limited in their validity. It is therefore advisable to collect naturalistic cycling data on a larger scale, in order to observe a larger number of crashes and incidents. Similar to how the 100 car study (Dingus et al., 2006) can be seen as the precursor to the much larger SHRP2 (Campbell, 2013), the study presented in this paper might be considered an important, but not final step in the application of the naturalistic driving methodology to cycling. Given this function, the study has provided evidence that NCS are a feasible, albeit laborious, approach to investigating cycling collisions and safety critical incidents. In order to conduct NCS on a larger scale, further methodological and technical improvements are necessary. On the technical side, the need for participants to manually start and stop recording interferes to some degree with naturalistic data collection, as participants are frequently reminded that they are being observed. The development of an automatic start/stop mechanism that can be installed on participants’ bicycles (see Dozza and Werneke (2014) for an example of such a mechanism on a test bike) appears to be an important step. While battery life has improved considerably relative to previous studies, battery life must improve further in order to deploy data acquisition systems on a Citation: Schleinitz, K., Petzoldt, T., Franke-Bartholdt, L., Krems, J. F., & Gehlert, T. (2015). Conflict partners and infrastructure use in safety critical events in cycling - Results from a naturalistic cycling study. Transportation Research Part F: Psychology and Behaviour,35, 99-111. doi:10.1016/j.trf.2015.04.002
large scale, as the close care that we were able to provide for our participants is not feasible in larger samples. Additional improvements of the system that might contribute to a richer dataset include better night vision cameras, a wider view of the scenery and the cyclist, as well as an accelerometer. Additional developments in terms of methodology are also required in order to advance understanding of cycling safety. In particular, the definitions of SCE and criticality are problematic aspects of NCS, as they are even less straightforward than in NDS. The fact that cyclists use a variety of different infrastructures and subsequently encounter potential conflict partners in situations very different from on-road driving makes the development of clear definitions very difficult. For example, situations that would be considered dangerous in (motor-)vehicle-pedestrian interactions (e.g. passing closely) are, intuitively, somewhat more difficult to characterise as SCEs in bicycle-pedestrian interactions. However, with due acknowledgment of methodological and technological limitations, a major strength of our study is that it allowed for the identification of various SCEs in cycling and advanced understanding of the circumstances under which such events occur. NCS as a method can provide insight into a variety of aspects of cyclist behaviour, including not only accidents and SCEs, but also infrastructure usage and mobility behaviour. Future NCS are expected to help answer a wide range of theoretical and practical questions concerning traffic psychology, urban planning and traffic engineering.
Citation: Schleinitz, K., Petzoldt, T., Franke-Bartholdt, L., Krems, J. F., & Gehlert, T. (2015). Conflict partners and infrastructure use in safety critical events in cycling - Results from a naturalistic cycling study. Transportation Research Part F: Psychology and Behaviour,35, 99-111. doi:10.1016/j.trf.2015.04.002
REFERENCES Alrutz, D., Bohle, W., Müller, H., Prahlow, H., Planungsgemeinschaft Verkehr Hannover, Hacke, U., … Institut für Wohnen und Umwelt GmbH. (2009). Unfallrisiko und Regelakzeptanz von Fahrradfahrern. Bergisch Gladbach. Atkinson, J. E., & Hurst, P. M. (1982). Collisions between cyclists and motorists in New Zealand. Accident Analysis and Prevention, 15(2), 137–151. Bacchieri, G., Barros, A. J. D., Dos Santos, J. V, & Gigante, D. P. (2010). Cycling to work in Brazil: Users profile, risk behaviors, and traffic accident occurrence. Accident Analysis and Prevention, 42(4), 1025–1030. doi:10.1016/j.aap.2009.12.009 Bagdadi, O. (2013). Assessing safety critical braking events in naturalistic driving studies. Transportation Research Part F: Traffic Psychology and Behaviour, 16, 117–126. doi:10.1016/j.trf.2012.08.006 Bai, L., Liu, P., Chen, Y., Zhang, X., & Wang, W. (2013). Comparative analysis of the safety effects of electric bikes at signalized intersections. Transportation Research Part D: Transport and Environment, 20, 48–54. doi:10.1016/j.trd.2013.02.001 Bjørnskau, T., Fyhri, A., & Sørensen, M. W. J. (2012). Sykling mot enveiskjøring. Effekter av å tillate toveis sykling i enveisregulerte. Oslo. Boufous, S., de Rome, L., Senserrick, T., & Ivers, R. (2012). Risk factors for severe injury in cyclists involved in traffic crashes in Victoria, Australia. Accident Analysis and Prevention, 49, 404–409. doi:10.1016/j.aap.2012.03.011 Campbell, K. (2013). SHRP 2 Safety-NDS Analysis. [PowerPoint slides]. Retrieved from http://www.fotnet.eu/download/stakeholder_meetings/10thstakeholdersmeeting/k_campbell_shrp_2_safety_fotnet_11-26-2013.pdf Candappa, N., Christoph, M., van Duivenvoorde, K., Vis, M., Thomas, P., Kirk, A., … Amoros, E. (2012). Basic Fact Sheet “Cyclists”, Deliverable D3.9 of the EC FP7 project DaCoTA. Chaurand, N., & Delhomme, P. (2013). Cyclists and drivers in road interactions: A comparison of perceived crash risk. Accident Analysis and Prevention, 50, 1176–1184. doi:10.1016/j.aap.2012.09.005 Cryer, P. C., Westrup, S., Cook, C., Ashwell, V., Bridger, P., & Clarke, C. (2001). Investigation of bias after data linkage of hospital admissions data to police road traffic crash reports. Injury Prevention, 7(3), 234–241. Daniels, S., Nuyts, E., & Wets, G. (2006). Effects of roundabouts on traffic safety for bicyclists: An observational study, [mansucript]. De Geus, B., Vandenbulcke, G., Int Panis, L., Thomas, I., Degraeuwe, B., Cumps, E., … Meeusen, R. (2012). A prospective cohort study on minor accidents involving commuter cyclists in Belgium. Accident Analysis and Prevention, 45, 683–693. doi:10.1016/j.aap.2011.09.045 De Mol, J., & Lammar, P. (2006). Helft verkeersslachstoffers komt niet in statistieken. Verkeersspecialist, 130, 15–18. Citation: Schleinitz, K., Petzoldt, T., Franke-Bartholdt, L., Krems, J. F., & Gehlert, T. (2015). Conflict partners and infrastructure use in safety critical events in cycling - Results from a naturalistic cycling study. Transportation Research Part F: Psychology and Behaviour,35, 99-111. doi:10.1016/j.trf.2015.04.002
Dennis, J., Ramsay, T., Turgeon, A. F., & Zarychanski, R. (2013). Helmet legislation and admissions to hospital for cycling related head injuries in Canadian provinces and territories: interrupted time series analysis. BMJ, 346, 1–10. doi:10.1136/bmj.f2674 Dill, J., & Carr, T. (2003). Bicycle commuting and facilities in major U.S. cities. Transportation Research Record, 1828, 116–123. Dingus, T. A., Klauer, S. G., Neale, V. L., Petersen, A., Lee, S. E., Sudweeks, J., … Knipling, R. R. (2006). The 100-Car naturalistic driving study phase II – Results of the 100-Car field experiment DOT HS 810 593. National Highway Traffic Safety Administration, USDOT. Dozza, M., & Werneke, J. (2014). Introducing naturalistic cycling data: What factors influence bicyclists’ safety in the real world? Transportation Research Part F: Traffic Psychology and Behaviour, 24, 83–91. doi:10.1016/j.trf.2014.04.001 Eenink, R., Barnard, Y., Baumann, M., Augros, X., & Utesch, F. (2014). UDRIVE the European naturalistic driving study. In Transportation Research Arena. Paris. Ellwein, A. (2011). Verletzungsmuster und Verletzungsschwere bei Fahrradunfällen im Großraum Göttingen. Georg-August-Universität Göttingen. Elvik, R., & Mysen, A. B. (1999). Meta-analysis of studies made in 13 countries. Transportation Research Record, 1665(99), 133–140. European Commission. (2014). Road Safety Vademecum. Brüssel. Guo, F., Klauer, S. G., McGill, M. T., & Dingus, T. A. (2010). Evaluating the Relationship Between Near-Crashes and Crashes : Can Near-Crashes Serve as a Surrogate Safety Metric for Crashes ? National Highway Traffic Safety Administration, USDOT. Gustafsson, L., & Archer, J. (2013). A naturalistic study of commuter cyclists in the greater Stockholm area. Accident Analysis and Prevention, 58, 286–298. doi:10.1016/j.aap.2012.06.004 Hagemeister, C., & Tegen-Klebingat, A. (2012). Cycling habits and accident risk of older cyclists in Germany. In Proceedings of the International Cycling Safety Conference. Helmond, Netherlands. Haileyesus, T., Annest, J. L., & Dellinger, A. M. (2007). Cyclists injured while sharing the road with motor vehicles. Injury Prevention, 13(3), 202–206. doi:10.1136/ip.2006.014019 Heinrich, H. W., Petersen, D., & Roos, N. (1980). Industrial Accident Prevention (Fifth Edit.). New York, USA: McGraw-Hill Book Company. Johnson, M., Charlton, J., Oxley, J., & Newstead, S. (2010). Naturalistic cycling study: Identifying risk factors for on-road commuter cyclists. Annals of Advances in Automotive Medicine / Annual Scientific Conference, 54, 275–283. Johnson, M., Newstead, S., Charlton, J., & Oxley, J. (2011). Riding through red lights: the rate, characteristics and risk factors of non-compliant urban commuter cyclists. Accident Analysis and Prevention, 43(1), 323–328. doi:10.1016/j.aap.2010.08.030 Juhra, C., Wieskötter, B., Chu, K., Trost, L., Weiss, U., Messerschmidt, M., … Raschke, M. (2012). Bicycle accidents - do we only see the tip of the iceberg? A prospective multi-centre study in a large German city combining medical and police data. Injury, 43(12), 2026–2034. doi:10.1016/j.injury.2011.10.016 Citation: Schleinitz, K., Petzoldt, T., Franke-Bartholdt, L., Krems, J. F., & Gehlert, T. (2015). Conflict partners and infrastructure use in safety critical events in cycling - Results from a naturalistic cycling study. Transportation Research Part F: Psychology and Behaviour,35, 99-111. doi:10.1016/j.trf.2015.04.002
Kaplan, S., Vavatsoulas, K., & Prato, C. G. (2014). Aggravating and mitigating factors associated with cyclist injury severity in Denmark. Journal of Safety Research, 50, 75–82. doi:10.1016/j.jsr.2014.03.012 Klauer, S. G., Perez, M., & McClafferty, J. (2011). Naturalistic driving studies and data coding and analysis techniques. In B. E. Porter (Ed.), Handbook of Traffic Psychology (pp. 73–85). San Diego: Academic Press. doi:10.1016/B978-0-12-381984-0.10006-2 Knowles, D., Aigner-Breuss, E., Strohmayer, F., & Orlet, P. (2012). Naturalistic Cycling. Ablenkung beim Radfahren. Wien. Kolrep-Rometsch, H., Leitner, R., Platho, C., Richter, T., Schreiber, A., & Schreiber, M. (2012). Abbiegeunfälle Pkw/Lkw und Fahrrad. Forschungsbericht Nr. 21. Unfallforschung der Versicherer. Gesamtverband der Deutschen Versicherungswirtschaft e.V., Berlin. Kubitzki, J., & Janitzek, T. (2009). Sicherheit und Mobilität älterer Verkehrsteilnehmer. AZT Automotive GmbH, European Transport Safety Council. Ismaning and Brüssel. Lopez, D. S., Sunjaya, D., Chan, S., Dobbins, S., & Dicker, R. (2012). Using trauma center data to identify missed bicycle injuries and their associated costs. Journal of Trauma and Acute Care Surgery, 73(6), 1602–1606. Martínez-Ruiz, V., Lardelli-Claret, P., Jiménez-Mejías, E., Amezcua-Prieto, C., Jiménez-Moleón, J. J., & Luna del Castillo, J. D. D. (2013). Risk factors for causing road crashes involving cyclists: An application of a quasi-induced exposure method. Accident Analysis and Prevention, 51, 228–237. doi:10.1016/j.aap.2012.11.023 Møller, M., & Hels, T. (2008). Cyclists’ perception of risk in roundabouts. Accident Analysis and Prevention, 40(3), 1055–1062. doi:10.1016/j.aap.2007.10.013 Monsere, C. M., Mcneil, N., & Dill, J. (2012). Multi-user perspectives on separated on-street bicycle infrastructure. In 91th Annual Meeting of Transportation Research Board. Washington D.C. Moudon, A. V., Lee, C., Cheadle, A. D., Collier, C. W., Johnson, D., Schmid, T. L., & Weather, R. D. (2005). Cycling and the built environment, a US perspective. Transportation Research Part D: Transport and Environment, 10(3), 245–261. doi:10.1016/j.trd.2005.04.001 Neale, V. L., Dingus, T. A., Klauer, S. G., Sudweeks, J., & Goodman, M. (2005). An overview of the 100-car naturalistic study and findings. In Proceedings - 19th International Technical Conference on the Enhanced Safety of Vehicles, Washington, D.C., June 6-9, 2005 Niska, A., Gustafsson, S., Nyberg, J., & Erikson, J. (2013). Cyklisters singelolyckor. Linköping, Sweden. OECD/International Transport Forum. (2012). Cycling Safety : Key Messages International Transport Forum Working Group on Cycling Safety. Copenhagen. OECD/International Transport Forum. Cycling, Health and Safety, (2013). OECD Publishing ITF. doi:http://dx.doi.org/10.1787/9789282105955-en Orsi, C., Ferraro, O. E., Montomoli, C., Otte, D., & Morandi, A. (2014). Alcohol consumption, helmet use and head trauma in cycling collisions in Germany. Accident Analysis and Prevention, 65, 97– 104. doi:10.1016/j.aap.2013.12.019 Citation: Schleinitz, K., Petzoldt, T., Franke-Bartholdt, L., Krems, J. F., & Gehlert, T. (2015). Conflict partners and infrastructure use in safety critical events in cycling - Results from a naturalistic cycling study. Transportation Research Part F: Psychology and Behaviour,35, 99-111. doi:10.1016/j.trf.2015.04.002
Otte, D., Jänsch, M., & Haasper, C. (2012). Injury protection and accident causation parameters for vulnerable road users based on German In-Depth Accident Study GIDAS. Accident Analysis and Prevention, 44(1), 149–153. doi:10.1016/j.aap.2010.12.006 Pfaffenbichler, P. (2011). BikeRisk Risiken des Radfahrens im Alltag. Wien. Räsänen, M., & Summala, H. (1998). Attention and expectation problems in bicycle-car collisions: an in-depth study. Accident Analysis and Prevention, 30(5), 657–666. Reynolds, C. C. O., Harris, M. A., Teschke, K., Cripton, P. A., & Winters, M. (2009). The impact of transportation infrastructure on bicycling injuries and crashes: a review of the literature. Environmental Health, 8, 47. doi:10.1186/1476-069X-8-47 Richter, M. (2005). Verletzungen von Fahrradfahrern. Zeitschrift für Orthopädie und ihre Grenzgebiete, 143(06), 604–605. doi:10.1055/s-2005-923493 Richter, M., Otte, C., Haasper, C., Sommer, K., Knobloch, K., Probst, C., … Krettek, C. (2007). The Current Injury Situation of Bicyclists – A Medical and Technical Accident Analysis. Journal of Trauma-Injury Infection & Critical Care, 62(5), 256–262. Rodgers, G. B. (1997). Factors associated with the crash risk of adult bicyclists. Journal of Safety Research, 28(4), 233–241. SafetyNet. (2009). Pedestrians & Cyclists. Short, J., & Caulfield, B. (2014). The safety challenge of increased cycling. Transport Policy, 33, 154–165. doi:10.1016/j.tranpol.2014.03.003 Statistisches Bundesamt. (2011). Verkehrsunfälle: Zweiradunfälle im Straßenverkehr. Wiesbaden. Statistisches Bundesamt [Destatis]. (2012a). Beteiligte an Unfällen mit Personenschaden nach Art der Verkehrsbeteiligung. Beteiligte und Verunglückte. Retrieved from https://www.destatis.de/DE/ZahlenFakten/Wirtschaftsbereiche/TransportVerkehr/Verkehrsunfael le/Tabellen/UnfallbeteiligungPersonenschaden.html. Statistisches Bundesamt [Destatis]. (2012b). Verletzte bei Verkehrsunfällen nach Art der Verkehrsbeteiligung. Beteiligte und Verunglückte. Retrieved from https://www.destatis.de/DE/ZahlenFakten/Wirtschaftsbereiche/TransportVerkehr/Verkehrsunfael le/Tabellen/VerletzteFahrzeugart.html. Statistisches Bundesamt [Destatis]. (2013). Unfallentwicklung auf deutschen Straßen 2012. Wiesbaden. Steffens, U., Pfeiffer, K., & Schreiber, N. (1999). Ältere Menschen als Radfahrer. 1999. Bundesanstalt für Straßenwesen, Bergisch-Gladbach. Stutts, J. C., Williamson, J. E., Whitley, T., & Sheldon, F. C. (1990). Bicycle accidents and injuries: A pilot study comparing hospital- and police-reported data. Accident Analysis and Prevention, 22(1), 67–78. doi:10.1016/0001-4575(90)90008-9 Summala, H., Pasanen, E., Räsänen, M., & Sievänen, J. (1996). Bicycle accidents and drivers’ visual search at left and right turns. Accident Analysis and Prevention, 28(2), 147–53. Citation: Schleinitz, K., Petzoldt, T., Franke-Bartholdt, L., Krems, J. F., & Gehlert, T. (2015). Conflict partners and infrastructure use in safety critical events in cycling - Results from a naturalistic cycling study. Transportation Research Part F: Psychology and Behaviour,35, 99-111. doi:10.1016/j.trf.2015.04.002
Teschke, K., Harris, M. A., Reynolds, C. C. O., Winters, M., Babul, S., Chipman, M., … Cripton, P. A. (2012). Route infrastructure and the risk of injuries to bicyclists: a case-crossover study. American Journal of Public Health, 102(12), 2336–2343. doi:10.2105/AJPH.2012.300762 Tin Tin, S., Woodward, A., & Ameratunga, S. (2010). Injuries to pedal cyclists on New Zealand roads, 1988-2007. BMC Public Health, 10(1), 655. doi:10.1186/1471-2458-10-655 Tin Tin, S., Woodward, A., & Ameratunga, S. (2013). Completeness and accuracy of crash outcome data in a cohort of cyclists: a validation study. BMC Public Health, 13, 420. doi:10.1186/14712458-13-420 Twisk, D. a M., & Reurings, M. (2013). An epidemiological study of the risk of cycling in the dark: The role of visual perception, conspicuity and alcohol use. Accident Analysis and Prevention, 60, 134–140. doi:10.1016/j.aap.2013.08.015 Van der Horst, A. R. A., de Goede, M., de Hair-Buijssen, S., & Methorst, R. (2014). Traffic conflicts on bicycle paths: A systematic observation of behaviour from video. Accident Analysis and Prevention, 62, 358–368. doi:10.1016/j.aap.2013.04.005 Veisten, K., Saelensminde, K., Alvaer, K., Bjørnskau, T., Elvik, R., Schistad, T., & Ytterstad, B. (2007). Total costs of bicycle injuries in Norway: Correcting injury figures and indicating data needs. Accident Analysis and Prevention, 39(6), 1162–1169. doi:10.1016/j.aap.2007.03.002 Walker, I. (2011). Bicyclists. In B. E. Porter (Ed.), Handbook of Traffic Psychology (pp. 367–373). San Diego: Academic Press. doi:10.1016/B978-0-12-381984-0.10026-8 Walter, E., Achermann Stürmer, Y., Scaramuzza, G., Niemann, S., & Cavegn, M. (2012). Fahrradverkehr. Bern. Washington, S., Haworth, N., & Schramm, A. (2012). On the relationships between self-reported bicycling injuries and perceived risk among cyclists in Queensland, Australia. In TRB 91st Annual Meeting Compendium of Papers DVD. Washington D.C. Wittenburg, P., Brugman, H., Russel, A., Klassmann, A., & Sloetjes, H. (2006). ELAN. a Professional Framework for Multimodality Research. In Proceedings of LREC 2006, Fifth International Conference on Language Resources and Evaluation. Zweirad-Industrie-Verband. (2013). Zahlen – Daten – Fakten zum Fahrradmarkt in Deutschland. Berlin.
Citation: Schleinitz, K., Petzoldt, T., Franke-Bartholdt, L., Krems, J. F., & Gehlert, T. (2015). Conflict partners and infrastructure use in safety critical events in cycling - Results from a naturalistic cycling study. Transportation Research Part F: Psychology and Behaviour,35, 99-111. doi:10.1016/j.trf.2015.04.002
APPENDIX Table A1: Number of SCEs per type of infrastructure and conflict partner per age group (N = 31).
≤ 40 years
Infrastructure Road
Bicycle infrastructure
Pavement
Pedestrian area
Unpaved
Miscellaneous
Total
Car
6
1
3
0
0
1
11
Bicycle
2
0
1
1
0
0
4
Pedestrian
3
1
1
0
2
0
7
Lorry
1
0
0
0
0
0
1
Bus
0
1
0
0
0
0
1
0
0
0
0
0
0
0
0
1
0
0
0
0
1
12
4
5
1
2
1
25
Road
Bicycle infrastructure
Pavement
Pedestrian area
Unpaved
Miscellaneous
Total
Car
7
2
0
0
0
1
10
Bicycle
0
7
0
1
0
0
8
Pedestrian
0
3
3
0
0
1
7
Lorry
0
0
0
0
0
0
0
Bus
0
0
0
0
0
0
0
0
1
0
0
0
0
1
0
1
1
0
0
0
2
7
14
4
1
0
2
28
Conflict partner
Other motorised vehicle Multiple conflict partners Total
41 – 64 years Conflict partner
Other motorised vehicle Multiple conflict partners Total
Infrastructure
Citation: Schleinitz, K., Petzoldt, T., Franke-Bartholdt, L., Krems, J. F., & Gehlert, T. (2015). Conflict partners and infrastructure use in safety critical events in cycling - Results from a naturalistic cycling study. Transportation Research Part F: Psychology and Behaviour,35, 99-111. doi:10.1016/j.trf.2015.04.002
≥ 65 years
Infrastructure Road
Bicycle infrastructure
Pavement
Pedestrian area
Unpaved
Miscellaneous
Total
Car
6
1
0
0
0
1
8
Bicycle
1
2
1
0
0
0
4
Pedestrian
0
1
3
0
0
3
7
Lorry
0
0
0
0
0
0
0
Bus
0
0
0
0
0
0
0
0
0
0
0
0
0
0
1
3
0
0
0
1
5
8
7
4
0
0
5
24
Conflict partner
Other motorised vehicle Multiple conflict partners Total
Citation: Schleinitz, K., Petzoldt, T., Franke-Bartholdt, L., Krems, J. F., & Gehlert, T. (2015). Conflict partners and infrastructure use in safety critical events in cycling - Results from a naturalistic cycling study. Transportation Research Part F: Psychology and Behaviour,35, 99-111. doi:10.1016/j.trf.2015.04.002