Conical scan polarization-sensitive optical ... - OSA Publishing
Recommend Documents
Nov 16, 2017 - Thorlabs, Newton, New Jersey) were used for the fabrication of a diffusing ... spatial resolution, a pinhole tube (1-mm inner diameter and 3-mm ...
Mar 7, 2005 - Peter John Rodrigo and Jesper Glückstad. Optics and Plasma Research Department, Risø National Laboratory, DK-4000 Roskilde, Denmark.
1Department of Physics and Photon Science/School of Information and ... Science and Technology (GIST), 123 Cheomdan-gwagiro, Buk-gu, Gwangju, South Korea ... liquid to the inner air surface during the surgical operations, resulting in the .... F. L.
2Aston Institute of Photonic Technologies, School of Engineering and Applied Science Aston University, Birmingham B4 7ET, UK. 3Conerefringent Optics SL ...
The introduction of the antenna concept into the optical frequency regime will ..... p2 antenna. Illustration of reciprocity between two point emitters. The excitation ...
2Department of Physics, University of Tehran, Kargar Shomally, Tehran 14394-547, Iran. 3Physics Department, Bu-Ali Sina University, Hamedan 65178, Iran.
Thermally managed eclipse Z-scan. A. S. L. Gomes, E. L. Falcão Filho and Cid B. de Araújo. Departamento de FÃsica, Universidade Federal de Pernambuco, ...
Apr 10, 2014 - Kelsey M. Kennedy,1,* Shaghayegh Es'haghian,1 Lixin Chin,1 Robert A. McLaughlin,1. David D. Sampson,1,2 and Brendan F. Kennedy1.
4Electrical and Computer Engineering, University of California-Los Angeles, Los ..... In order to evaluate the degree of single crystallinity of the silicon core, the ...
equalization and finally the carrier and data recovery. To develop these .... can be used for a hardware-efficient implementation of (2). The weighting proportional ...
Abstract: In this paper the concept of a microspectrometer based on a. Linear Variable Optical Filter (LVOF) for operation in the visible spectrum is presented and ...
6 -rad region have been induced and detected in a single-mode all-fiber Mach-. Zehnder interferometer by stretching the fiber with a piezoelectric cylinder driven ...
Color versions of Figs. 2â5 are available online at http://ieeexplore.ieee.org. ... At the network edge, traffic is mapped onto the network services via an edge inter-.
Mar 22, 2012 - the recent advances in cryogenic cooling of an ytterbium-doped ... all-solid-state cooling approach for cryogenic temperatures. c 2012 Optical.
is compensated by two algorithms. Axial motion between adjacent A-lines within one OCT image is compensated by the Doppler shift due to bulk sample motion.
... âThird supplement to an essay on the theory of systems of rays,â Trans. Roy. ... A. Abdolvand, K. G. Wilcox, T. K. Kalkandjiev, and E. U. Rafailov, âConical .... the normalized distance and a(P) is the Fourier transform of the incident beam
Abstract: We present an innovative grating design based on conical diffraction which acts as an almost perfect and low-loss beamsplitter for ex- treme ultraviolet ...
School of Engineering, Physics and Mathematics, University of Dundee, Dundee DD1 4HN, UK. *Corresponding author: [email protected]. Received ...
on which a doughnut-shaped thin-disk active medium is set, and an output coupler. Unlike the ordinary thin-disk lasers, the optical ray of the proposed resonator ...
Aug 15, 2002 - Department of Quantum Electronics, Vilnius University, Sauletekio Avenue 9, Bldg. 3, LT-2040 Vilnius, Lithuania. Gaetano Bellanca.
Abstract: Optical coherence tomography (OCT) in the spectral domain is demonstrated ..... resulting in a theoretical free-space axial resolution of 3.2 µm and 5.2 µm, respectively. Each ... These system parameters were chosen in order to find a.
1Laser Physics, KTHâRoyal Institute of Technology, 106 91 Stockholm, Sweden. 2Optigrate, 3267 Progress Drive, Orlando, Florida 32826, USA.
M. V. Collados, D. Chemisana, and J. Atencia, âHolographic solar energy systems: the ... crystalline silicon solar cell with cell temperature,â Energy Reports 1, ...
Conical scan polarization-sensitive optical ... - OSA Publishing
M. Yamanari, M. Miura, S. Makita, T. Yatagai, and Y. Yasuno, âPhase retardation ... spectral-domain optical coherence tomography and scanning laser.
Conical scan polarization-sensitive optical coherence tomography Zenghai Lu,1,2 Deepa Kasaragod,1,3 and Stephen J Matcher1,* 1
Department of Materials Science and Engineering, the Kroto Research Institute, University of Sheffield, North Campus, Broad Lane, Sheffield, S3 7HQ, UK 2 Department of Electronic and Electrical Engineering, University of Sheffield, Mappin Street, Sheffield, S1 3JD, UK 3 Currently with the Computational Optics Group, University of Tsukuba, Tsukuba, Japan * [email protected]
D. Huang, E. A. Swanson, C. P. Lin, J. S. Schuman, W. G. Stinson, W. Chang, M. R. Hee, T. Flotte, K. Gregory, C. A. Puliafito, and J. G. Fujimoto, “Optical coherence tomography,” Science 254(5035), 1178–1181 (1991). 2. M. R. Hee, D. Huang, E. A. Swanson, and J. G. Fujimoto, “Polarization-sensitive low-coherence reflectometer for birefringence characterization and ranging,” J. Opt. Soc. Am. B 9(6), 903–908 (1992). 3. J. F. de Boer, T. E. Milner, M. J. C. van Gemert, and J. S. Nelson, “Two-dimensional birefringence imaging in biological tissue by polarization-sensitive optical coherence tomography,” Opt. Lett. 22(12), 934–936 (1997). 4. N. Ugryumova, S. V. Gangnus, and S. J. Matcher, “Three-dimensional optic axis determination using variableincidence-angle polarization-optical coherence tomography,” Opt. Lett. 31(15), 2305–2307 (2006). 5. J. F. de Boer, T. E. Milner, and J. S. Nelson, “Determination of the depth-resolved Stokes parameters of light backscattered from turbid media by use of polarization-sensitive optical coherence tomography,” Opt. Lett. 24(5), 300–302 (1999). 6. S. J. Matcher, C. P. Winlove, and S. V. Gangnus, “The collagen structure of bovine intervertebral disc studied using polarization-sensitive optical coherence tomography,” Phys. Med. Biol. 49(7), 1295–1306 (2004). 7. B. Cense, T. C. Chen, B. H. Park, M. C. Pierce, and J. F. de Boer, “Thickness and birefringence of healthy retinal nerve fiber layer tissue measured with polarization-sensitive optical coherence tomography,” Invest. Ophthalmol. Vis. Sci. 45(8), 2606–2612 (2004). 8. M. Yamanari, M. Miura, S. Makita, T. Yatagai, and Y. Yasuno, “Phase retardation measurement of retinal nerve fiber layer by polarization-sensitive spectral-domain optical coherence tomography and scanning laser polarimetry,” J. Biomed. Opt. 13(1), 014013 (2008). 9. E. Götzinger, M. Pircher, B. Baumann, C. Hirn, C. Vass, and C. K. Hitzenberger, “Analysis of the Origin of Atypical Scanning Laser Polarimetry Patterns by Polarization-Sensitive Optical Coherence Tomography,” Invest. Ophthalmol. Vis. Sci. 49(12), 5366–5372 (2008). 10. Y. Lim, M. Yamanari, S. Fukuda, Y. Kaji, T. Kiuchi, M. Miura, T. Oshika, and Y. Yasuno, “Birefringence measurement of cornea and anterior segment by office-based polarization-sensitive optical coherence tomography,” Biomed. Opt. Express 2(8), 2392–2402 (2011). 11. N. Ugryumova, J. Jacobs, M. Bonesi, and S. J. Matcher, “Novel optical imaging technique to determine the 3-D orientation of collagen fibers in cartilage: variable-incidence angle polarization-sensitive optical coherence tomography,” Osteoarthritis Cartilage 17(1), 33–42 (2009). 12. S. J. Matcher, “A review of some recent developments in polarization-sensitive optical imaging techniques for the study of articular cartilage,” J. Appl. Phys. 105(10), 102041 (2009).
#199326 - $15.00 USD Received 11 Oct 2013; revised 29 Nov 2013; accepted 20 Dec 2013; published 28 Mar 2014 (C) 2014 OSA1 March 2014 | Vol. 5, No. 3 | DOI:10.1364/BOE.5.000752 | BIOMEDICAL OPTICS EXPRESS 752
13. N. A. Patel, J. Zoeller, D. L. Stamper, J. G. Fujimoto, and M. E. Brezinski, “Monitoring osteoarthritis in the rat model using optical coherence tomography,” IEEE Trans. Med. Imaging 24(2), 155–159 (2005). 14. T. Xie, S. Guo, J. Zhang, Z. Chen, and G. M. Peavy, “Determination of characteristics of degenerative joint disease using optical coherence tomography and polarization sensitive optical coherence tomography,” Lasers Surg. Med. 38(9), 852–865 (2006). 15. A. K. Jeffery, G. W. Blunn, C. W. Archer, and G. Bentley, “Three-dimensional collagen architecture in bovine articular cartilage,” J. Bone Joint Surg. 73, 795–801 (1991). 16. S. Kamalanathan and N. D. Broom, “The biomechanical ambiguity of the articular surface,” J. Anat. 183(Pt 3), 567–578 (1993). 17. Y. Sasazaki, R. Shore, and B. B. Seedhom, “Deformation and failure of cartilage in the tensile mode,” J. Anat. 208(6), 681–694 (2006). 18. M. A. Wallenburg, M. F. G. Wood, N. Ghosh, and I. A. Vitkin, “Polarimetry-based method to extract geometryindependent metrics of tissue anisotropy,” Opt. Lett. 35(15), 2570–2572 (2010). 19. Z. H. Lu, D. K. Kasaragod, and S. J. Matcher, “Optic axis determination by fibre-based polarization-sensitive swept-source optical coherence tomography,” Phys. Med. Biol. 56(4), 1105–1122 (2011). 20. D. K. Kasaragod, Z. Lu, J. Jacobs, and S. J. Matcher, “Experimental validation of an extended Jones matrix calculus model to study the 3D structural orientation of the collagen fibers in articular cartilage using polarization-sensitive optical coherence tomography,” Biomed. Opt. Express 3(3), 378–387 (2012). 21. M. K. Al-Qaisi and T. Akkin, “Swept-source polarization-sensitive optical coherence tomography based on polarization-maintaining fiber,” Opt. Express 18(4), 3392–3403 (2010). 22. E. Götzinger, B. Baumann, M. Pircher, and C. K. Hitzenberger, “Polarization maintaining fiber based ultra-high resolution spectral domain polarization sensitive optical coherence tomography,” Opt. Express 17(25), 22704– 22717 (2009). 23. G. Anzolin, A. Gardelein, M. Jofre, G. Molina-Terriza, and M. W. Mitchell, “Polarization change induced by a galvanometric optical scanner,” J. Opt. Soc. Am. A 27(9), 1946–1952 (2010). 24. D. K. Kasaragod, Z. Lu, and S. J. Matcher, “Comparative study of the angle-resolved backscattering properties of collagen fibers in bovine tendon and cartilage,” J. Biomed. Opt. 16(8), 080501 (2011). 25. K. Schoenenberger, B. W. Colston, D. J. Maitland, L. B. Da Silva, and M. J. Everett, “Mapping of Birefringence and Thermal Damage in Tissue by use of Polarization-Sensitive Optical Coherence Tomography,” Appl. Opt. 37(25), 6026–6036 (1998). 26. J. M. Clark, “The organisation of collagen fibrils in the superficial zones of articular cartilage,” J. Anat. 171, 117–130 (1990). 27. P. Yeh, Optical Waves in Layered Media (New York: Wiley, 1988). 28. T. Serra, J. A. Planell, and M. Navarro, “High-resolution PLA-based composite scaffolds via 3-D printing technology,” Acta Biomater. 9(3), 5521–5530 (2013). 29. W. Wilson, C. C. van Donkelaar, B. van Rietbergen, and R. Huiskes, “A fibril-reinforced poroviscoelastic swelling model for articular cartilage,” J. Biomech. 38(6), 1195–1204 (2005).
1. Introduction Optical coherence tomography (OCT) noninvasively generates a depth-resolved crosssectional image of biological tissue with micrometer resolution [1] and without requiring physical contact. As a functional extension of OCT, polarization-sensitive optical coherence tomography (PS-OCT) provides both depth-resolved reflectivity and birefringence images of biological tissues [2, 3]. PS-OCT has been used extensively to image birefringent biological tissues such as tendon [4], skin and muscle [5], interverteral disk [6], retinal nerve fiber [7–9], cornea and anterior segment [10] and articular cartilage [11–14]. It is well known that articular cartilage has complicated three-dimensional (3-D) collagen fiber architecture with zonal divisions conventionally referred to as the superficial, transitional and radial layers. This structure has been extensively studied since the earliest days of polarized light microscopy (PLM), due to the strong intrinsic birefringence of collagen. A very early model of collagen organization is Benninghoff’s “arcade” model, the arrangement of collagen fibers is believed to be perpendicular to the bone cartilage interface, arching over in the transitional zone, continuing parallel to surface in the superficial zone before arching back over into the transitional zone and continuing down to reattach to the bone, again oriented perpendicular to the bone surface. Other schematic diagrams can be found in the literature in which the fibers in the transitional zone are in a more disordered state than in the superficial and radial zones. Scanning electron microscopy (SEM) data suggests a somewhat different picture, whereby the collagen fibers are organized into a stack of sheets or lamellae [15]. The surface normal of these lamellae lies parallel to the bone/cartilage surface and then slowly rotates to be perpendicular to the bone/cartilage
#199326 - $15.00 USD Received 11 Oct 2013; revised 29 Nov 2013; accepted 20 Dec 2013; published 28 Mar 2014 (C) 2014 OSA1 March 2014 | Vol. 5, No. 3 | DOI:10.1364/BOE.5.000752 | BIOMEDICAL OPTICS EXPRESS 753
surface at the joint surface. This model describes the lamellae as effectively terminating at the joint surface. In addition to PLM and SEM, mechanical fracturing of the cartilage surface has also been widely used to study the collagen alignment in an en-face plane i.e. looking down on the cartilage surface. The osmotic swelling pressure generated by the interaction of water and proteoglycans means that if the surface is pricked with a needle dipped in India ink, the tissue then fractures or splits in a highly anisotropic way. The “split-line” orientations are highlighted by the ink and can then be mapped across the joint surface. The patterns are highly reproducible and have been suggested to play a role in modulating tensile mechanical properties, with a general consensus being that cartilage samples show greater tensile stiffness when strained parallel to the split-line direction than orthogonal to it [16, 17]. The SEM and split-line data have been synthesized by Jeffrey et al. [15], who propose that the split-lines are oriented perpendicular to the plane that contains the lamella surface normal at the various depths. Studies of complicated 3-D structures using “sectioning” techniques such as SEM or PLM are difficult because the structure is projected onto a 2-D plane of arbitrary orientation. Also these techniques are destructive, making spatial mapping very laborious. Conventional PSOCT has proved to be an excellent tool with which to qualitatively study collagen structure in cartilage. However, quantitative information is difficult to obtain because PS-OCT measures ‘apparent’ birefringence, which is determined both by the intrinsic optical anisotropy of the material and also by the orientation of the optic axis (also known as the ‘c-axis’) relative to the k-vector of the incident light beam. To separate out effects due to the 3-D orientation of the fibers from effects due to changes in the underlying birefringence itself, we introduced a novel variant of PS-OCT, which we termed variable-incidence angle (VIA) PS-OCT [4, 11, 12, 18]. The technique can determine both the polar and azimuthal angles of the collagen fibers using measurements of the ‘apparent’ birefringence at a series of incidence angles in two orthogonal planes of illumination. Previously the technique has been demonstrated using both bulk-optic time-domain (TD) [4] and fiber-based swept-source PS-OCT systems [19] at 1.3µm on equine tendon and cartilage. However, the existing VIA technique strictly requires multi-angle measurements in two orthogonal planes, which is very difficult to implement in a confined situation such as arthroscopic examination. In order to address this issue and eventually facilitate translation of the VIA-PS-OCT technique to the clinic, we introduce a more convenient imaging procedure: conical scan PS-OCT (CS-PS-OCT). In CS-PS-OCT the beam is scanned such that the k-vector sweeps out a conical surface whose apex is chosen, for convenience, to lie at the tissue surface. In the implementation reported here we achieve this by mounting the sample on a motorized rotation stage with the sample surface roughly parallel to the stage rotating plane (i.e. normal to the stage rotation axis). The stage is mounted and tilted at a certain angle typically 45° with respect to the laser illumination beam direction. CS-PS-OCT imaging is then obtained by acquiring successive Ascans over rotation spans of 0-360° at an interval of 1°. During imaging the illumination beam is fixed and intersects the stage rotation axis at the measurement point on the sample surface. Therefore, the azimuthal angle between the beam and the tissue normal varies continuously and a polar B-scan of depth-resolved retardance is plotted. CS-PS-OCT was applied to measurements of birefringent tissue samples with homogenous local optic axis orientation (i.e. bovine tendon) as well as bovine articular cartilage. A PS-OCT system based on polarization-maintaining fiber-based (PMF-PS-OCT), thereby illuminating with a single circularly polarized incident light, was used. Polar plots of retardance are compared qualitatively and quantitatively for tendon and cartilage. Quantitative comparisons are made using a model we have developed based on the Extended Jones Matrix Calculus [20] and shown to agree with the lamellar model previously proposed based on destructive SEM cryofracture imaging for the cartilage microstructure based on scanning electron microscopy data. We find that CS-PS-OCT has the capability to non-invasively map the lamellar “brushing direction” in articular cartilage: a morphological parameter which has been little studied both in its spatial variation and anatomical role.
#199326 - $15.00 USD Received 11 Oct 2013; revised 29 Nov 2013; accepted 20 Dec 2013; published 28 Mar 2014 (C) 2014 OSA1 March 2014 | Vol. 5, No. 3 | DOI:10.1364/BOE.5.000752 | BIOMEDICAL OPTICS EXPRESS 754
2. System and theory 2.1 System configuration The PMF-SS-OCT system follows the scheme reported by Al-Qaisi et al. [21] and is shown schematically in Fig. 1. The system consists of a Panda PMF-fiber Mach-Zehnder interferometer rather than a Michelson interferometer as reported previously [21, 22]. The use of a Mach–Zehnder interferometer provides two complementary outputs, simplifying balanced detection without the need for auxiliary optical components. It also benefits from reducing the mismatch of the optical dispersion between the reference and the sample arms and optimizing the power efficiency of the interferometer.
Fig. 1. Schematic diagram of the system. SS: wavelength-swept source, PC: polarization controller, IL-LP: in-line linear polarizer, PMC: polarization-maintaining coupler, QWP: quarter waveplate, PBS: polarization beamsplitter, H and V: balanced photo-detectors for horizontally and vertically polarized optical signals, respectively.
The light source is a commercially available wavelength-swept laser (HSL-2000-10-MDL, Santec, Japan). The light source has a centre wavelength of 1315nm, a wavelength range of 157nm, a full width at half maximum (FWHM) of 128nm, a wavelength scanning rate of 10 kHz, a duty cycle of about 60%, an average output power of 10mW and peak power of around 23mW. This leads to an axial resolution of ~10μm in air which was measured by using an optical mirror. The light is polarized by an in-line optical linear polarizer (IL-LP) whose transmission axis is aligned to one input port of a 2 × 2 polarization-maintaining coupler (PMC1, OLCPLP-22-131-10-90-FA, Opto-link Corp., China) so that the vertically polarized light couples into the slow axis of the PMF only. 10% of the laser light is coupled to the reference arm through the PMC1. The remaining 90% of the light is directed to the sample arm. In the reference arm, the light is reflected from a stationary mirror and redirected to a PMF circulator (OLCIR-P-3131-300-90-FA, Opto-link Corp., China) after passing through a bulk optics linear polarizer (LP) with axis aligned at 45° with respect to the slow axis of the PMF. The LP ensures that the reference light couples equally in the slow and fast axes of the PMF. The output of the circulator is coupled to a second 2 × 2 PM coupler with a splitting ratio of 50:50 (PMC2, OLCPL-P-22-131-50-90-FA, Opto-link Corp., China). In the sample arm, a quarter waveplate (QWP, NT55-547, Edmund Optics, US) is rotated by 45° relative to the input polarization state to provide circularly polarized light. The beam is relayed to the sample via a two-axis galvanometer scanner (6215, Cambridge Technology, US) and a Thorlabs LSM03 OCT scanning lens (f = 36mm), yielding a mean spot size in the focal plane of 25μm. The galvanometer scanners are disabled during conical beam scanning protocol. Since they form a matched pair, with interchanged s and p polarization direction, they introduce no overall
#199326 - $15.00 USD Received 11 Oct 2013; revised 29 Nov 2013; accepted 20 Dec 2013; published 28 Mar 2014 (C) 2014 OSA1 March 2014 | Vol. 5, No. 3 | DOI:10.1364/BOE.5.000752 | BIOMEDICAL OPTICS EXPRESS 755
change in the incident polarization state, which is still circular on the sample. The sample arm collects the backscattered light from the sample. The collected light interferes with the light returning from the reference arm at PMC2. In-line PM fiber-optic polarization beamsplitters (PBS-31-P-2-L-3-Q, NovaWave Techno., US) are connected to the two output ports of PMC2. The horizontally and vertically polarized optical signals are detected by two balanced detectors (1817-FC, New Focus, US). The detected optical signals are sampled at 20MS/s with 14-bit resolution (M2i.4022, Spectrum GmbH, Germany).
Laser beam Sample Scan cone
z xyz stage Rotating axis
x Motorized rotation stage
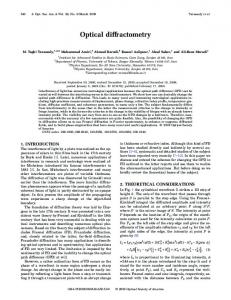
Fig. 2. Schematic diagram of conical scanning (left). Polar coordinate system (right).
2.2 Conical scan The sample is mounted on a manual XYZ stage which is further mounted on the rotation stage. It can be seen from Fig. 2 (left) that CS-PS-OCT imaging by sample rotation requires two essential alignment steps. The first step ensures the incident laser beam strikes the sample surface at a point through which the axis of rotation passes. This prevents movement of the surface imaging point during sample rotation. The second step is to ensure that the desired point on the sample surface intersects the beam. To facilitate these adjustments the rotation stage is mounted on an x-y stage and the rotation stage then carries a miniature x-y-z stage which itself carries the tissue sample. Careful iterative adjustments are used to ensure that a fixed spot on the sample is imaged during one revolution. This is judged roughly by eye and, since the cartilage surface is generally somewhat curved, by the extent to which the tissue surface appears to be horizontal and straight, rather than sinusoidal, on a B-scan. The A-scans are sequentially acquired over a rotation angle step of 1° in an entire range of 360° on the measurement point by synchronizing the A-scan data acquisition with the motorized rotation stage. This synchronization is achieved using the sweep trigger signal of the light source, which is utilized for triggering the data acquisition of the digitizer for a single sweep and utilized as an update clock for the step waveform generation to drive the stage.
#199326 - $15.00 USD Received 11 Oct 2013; revised 29 Nov 2013; accepted 20 Dec 2013; published 28 Mar 2014 (C) 2014 OSA1 March 2014 | Vol. 5, No. 3 | DOI:10.1364/BOE.5.000752 | BIOMEDICAL OPTICS EXPRESS 756
360 A-scans are used to form an image frame. The frame can be plotted as a conventional OCT B-scan, Fig. 2 (right top) or converted to a polar format Fig. 2 (right bottom), in which the radial distance is the axial imaging depth. 3. Experimental results 3.1 PS-OCT system characterization To validate the birefringence measurements of the system, a Soleil-Babinet compensator (SBC-IR, Thorlabs, US) was used as a test target and an optical mirror as the sample reflector. The compensator is placed in the sample arm between the QWP and the galvo scanners because the device with a thickness of ~50mm in the laser illumination direction could not be fitted into the optical path after the scanners which were turned off during the measurements. In the two-axis scanner mirror arrangement, p and s polarization direction interchanges on both mirrors, hence the polarization change induced by each mirror should cancel if the mirrors match [23]. The compensator allows an arbitrary and independent setting of phase retardance over a broad wavelength range. The compensator was first calibrated at 1.3um wavelength by using the crossed polarizer configuration. The phase retardance of the compensator was varied from 0° to 180° in steps of 10°, and 128 depth scans were averaged for each measurement. It should be noted that the compensator itself was rotated and that the fibers in the system was left untouched. Therefore, the length mismatch of the PMFs between the reference and sample arms could be compensated numerically by data post processing from a calibration measurement only once [22]. Figure 3 (left) shows the measured phase retardance of the compensator against the retardance values set at the compensator (optic axis orientation was set at 45°). The measured phase retardance was generally in good agreement with the expected values with a linear fitted slope of 1.02 and standard deviation of the fitting residual 2°.
Fig. 3. Measured phase retardance of the compensator as a function of set retardance values (left). (right) Measured phase retardance and optic axis orientation of the compensator as a function of set orientation values.
The measured optic axis orientation of the compensator as a function of set values was shown in Fig. 3 (right). The retardance was set at a fixed value of 40° while the optic axis was varied from 0° to 180° in steps of 10°. The slope of the linear fit of measured orientation versus set orientation was 0.98 and the standard deviation of the fitting residual was ~1.5°. Figure 3 (right) also shows the measured phase retardance at these set orientation values is 38.5° with standard deviation of ~3°, indicating that the retardance measurement is insensitive to the optic axis orientation of the sample. These measurements confirm the correct functioning of the PMF-PS-OCT system. 3.2 Validation measurements on a bovine tendon sample by CS-PS-OCT The first test target used to validate the concept of CS-PS-OCT was a bovine tendon sample with homogeneous optic axis orientation over the measurement depth. The sample was cut,
#199326 - $15.00 USD Received 11 Oct 2013; revised 29 Nov 2013; accepted 20 Dec 2013; published 28 Mar 2014 (C) 2014 OSA1 March 2014 | Vol. 5, No. 3 | DOI:10.1364/BOE.5.000752 | BIOMEDICAL OPTICS EXPRESS 757
whilst frozen, such that the c-axis was oriented at a polar angle of approximately 0° (i.e. the orientation of collagen fibers are parallel to the surface of the cut). The sample was then mounted on the XYZ stage as shown in Fig. 2 (left) so that the surface of the cut was illuminated at 45° incidence in respect with the laser beam direction. The intensity and phase retardance images obtained experimentally and theoretically as a function of rotation angle are shown in Fig. 4, in which images were drawn by using conventional OCT image display processing (left column) and converting polar-coordinate based data to x-y Cartesian based ones (right column).
(rad.) Fig. 4. Intensity (top) and phase retardance images (middle) obtained by CS-PS-OCT from a bovine tendon sample as a function of rotation angle with entire span of 360° and a 1° interval. (bottom): simulated results by using an EJMC model [20]. Image size is 1.4mm (axial) × 360° (transversal) in left column; polar radius is 1.4mm in right column.
In addition to retardance images, our conical-scan system can also measure intensity (i.e. backscatter) images. The intensity images in Fig. 4 (top) show that the backscattered signal obtained from the tendon tissue close to the azimuth angles of 90° and 270° is considerably lower than that obtained at 0° and 180°. This illustrates the anisotropic backscatter behavior shown by the Type I collagen fibers in tendon tissue as reported in our previous study [24]. It is worth comparing this plot with that obtained for cartilage (Fig. 6 top), which is essentially isotropic. We previously ascribed this to the difference in scatterer size between tendon (large diameter, type-I collagen fibers) and cartilage (finer, type-II fibers). Figure 4 (middle) shows the conical scan retardance image revealing an increase in the band spacing over azimuth angle changed from 0° to 90° in the x-y-z lab coordinates which falls back to the original band spacing pattern at azimuth angle of 180°. This sequence is repeated over the 360° rotation. This could be explained by the unidirectional arrangement of collagen fibers in the tendon tissue. From the conical scan retardance image, we can obtain
#199326 - $15.00 USD Received 11 Oct 2013; revised 29 Nov 2013; accepted 20 Dec 2013; published 28 Mar 2014 (C) 2014 OSA1 March 2014 | Vol. 5, No. 3 | DOI:10.1364/BOE.5.000752 | BIOMEDICAL OPTICS EXPRESS 758
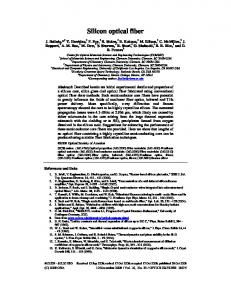
the collagen fiber orientation angle as shown in Fig. 4, which is in general agreement with the set angle in the experiment. In order to theoretically explain the obtained retardance images, a layered model based on the extended Jones Matrix calculus (EJMC), as previously developed by our group [20], is applied to conical-scan data from the tendon sample. The parameters upon which the model is bases is the true birefringence value 4.5 × 10⁻³ and the ordinary refractive index of the tissue 1.37, polar angle of 90° and azimuthal angle of 0-360° which are constant over the depth of the tissue, and the noise model that inputs the attenuation coefficient 2.5 × 10⁻³μm−1 and the noise bias term σ2 = 8.3 × 10⁻². For better demonstration, attenuation is applied to the simulated results in lateral direction i.e. different azimuthal angles, which is realized by modulating the noise bias term σ2 as sin2 function versus the azimuthal angle. The simulated results are plotted in Fig. 4 (bottom), which is generally in good agreement with the experimental results. The fall in birefringence contrast versus depth (and azimuthal angle, for tendon) is included in our model by exponentially attenuating both OCT signals towards a fixed noise floor [25]. The azimuthal change in birefringence contrast is modeled by making the backscatter coefficient for tendon, azimuthally varying [24]. The red-dotted line represents the direction in which the type-I collagen fibers are aligned. Note how the SNR of the retardance image falls dramatically to the direction parallel to the red-dotted line, which corresponds to the long axis of the collagen fiber. This is because of the back-scatter signal falling towards the system noise floor at these angles. 3.3 Measurements on a bovine cartilage sample by CS-PS-OCT Fresh tissue samples of bovine articular cartilage were extracted from the fetlock joint of the hindlimb of the animal obtained from the local abattoir (Fig. 5(a)). The samples were stored frozen at −20°C prior to imaging and then sectioned along the anterior side of the apex for imaging. For articular cartilage, Clark [26] and Jeffery et al. [15] proposed a leaf-like model for the 3D collagen fiber network structure based on cryofracture scanning electron microscopy data, as shown in Fig. 5(b). The surface ‘tangential’ layer comprises typically 10% of the total thickness of the articular cartilage and consists of collagen fibers oriented parallel to the surface. This layer is followed by the ‘transitional’ zone, which as per the lamellar model of Clark et al. has collagen fibers organized into parallel sheets which arch downwards leading to the radial zone, in which the collagen fibers are oriented perpendicular to the surface. The transitional zone comprises 40-60% of the total thickness of the cartilage with the rest of the thickness consisting of the radial zone, which ultimately anchors to the subchondral bone. The model has a very organized arching of the collagen fibers in the transitional zone: it further implies that there is a ‘brushing’ direction in the cartilage i.e. the direction in which the lamellae curve is uniquely defined over the full angular range ± π. It is a well-known [27] but important feature of birefringence that its magnitude depends not only on the degree of optical anisotropy of a fiber/long-chain-molecule but also on how this fiber is oriented relative to the k-vector of the propagating light wave. Specifically, if θ c is the angle between the k-vector and the c-axis of the fiber, whose ordinary and extraordinary refractive indices are no and ne respectively, then the apparent birefringence Δn is n – no where 1 sin 2 θ c cos2 θ c = + n2 ne2 no2
(1)
Hence for normal incidence, the observed birefringence from the radial zone would be almost zero and the only significant signal would come from the thin superficial layer. The conical scan beam protocol is thus more suited to the specific architecture of normal cartilage collagen, providing strong signals from all layers.
#199326 - $15.00 USD Received 11 Oct 2013; revised 29 Nov 2013; accepted 20 Dec 2013; published 28 Mar 2014 (C) 2014 OSA1 March 2014 | Vol. 5, No. 3 | DOI:10.1364/BOE.5.000752 | BIOMEDICAL OPTICS EXPRESS 759
‘brushing direction’
Surface layer
Axis of split line
(a)
Collagen leaves
Calcified cartilage Bone
(b)
superficial 100 μm
transitional 500 μm
(c)
radial 400 μm
Fig. 5. (a) Photo of the intact bovine cartilage samples used in this study. (b): Schematic presentation of proposed leaf-like mode of collagen architecture by Jeffery et al [15]. (c): A schematic of the cartilage zonal layered structure and the layer thickness used for the EJMC study. Also shown are the orientations of the polar angle of the collagen fast axis varying from 90° in the superficial zone to gradually becoming 0° in the radial zone.
Figure 6 is directly equivalent to Fig. 4, with the theoretical birefringence map now being calculated using the fiber architecture shown in Fig. 5(c). Figure 4 (top) shows that the dramatic change in the backscattering signal versus azimuthal angle that characterizes tendon is not shown by the articular cartilage sample in Fig. 6 (top). As discussed earlier, we attribute this to differences in the dominant scatterer type within the two types of tissues. The retardance image in Fig. 6 (middle) shows a pattern that is right/left symmetric about an axis shown by the red dashed line (arrowed). In one direction along this axis is an extended tail signifying low birefringence whereas in the opposite direction we see a distinct birefringence “band” i.e. a fluctuation in color-coded birefringence from low (blue) to high (red) and back. We have observed this pattern numerous times on the cartilage surface and have labeled it the “comet-crescent” pattern.
#199326 - $15.00 USD Received 11 Oct 2013; revised 29 Nov 2013; accepted 20 Dec 2013; published 28 Mar 2014 (C) 2014 OSA1 March 2014 | Vol. 5, No. 3 | DOI:10.1364/BOE.5.000752 | BIOMEDICAL OPTICS EXPRESS 760
‘brushing direction’
(rad.) Fig. 6. Intensity (top) and phase retardance images (middle) obtained by CS-PS-OCT from a bovine cartilage sample as a function of rotation angle with entire span of 360° and a 1° interval. (bottom): simulated results by using EJMC model [20]. Image size is 1.4mm (axial) × 360° (transversal) in left column; polar radius is 1.4mm in right column.
The simulated results as shown in Fig. 6 (bottom) generally validate the experimental results. We base our theoretical model of the articular cartilage on this leaf-like lamellar model of Jeffery et al. [15], starting with a simple model with the assumption of constant azimuth angle orientation of the collagen fibers throughout the depth of the tissue [20] as shown in Fig. 5(c). In Fig. 5(c) the polar angle in superficial layer of the tissue is 90° and 0° in the radial layer, while the depth dependent change of the polar angle is modeled as a quadratic profile a·z2 + b·z + c in the transitional layer with the used a = 1.5 × 10⁻⁵, b = −0.1625, c = 90° and z is the depth in μm in the transitional zone. The other parameters upon which the model is based is the true birefringence value 2.0 × 10⁻³ and the ordinary refractive index of the tissue 1.37, the azimuthal angle of 0-360° which are constant over the depth of the tissue, and the noise model that inputs the attenuation coefficient 2.5 × 10⁻³μm−1 and the noise bias term σ2 = 6.0 × 10⁻². On the basis of this model fit we identify the low birefringence angular direction (arrowed) as representing the aforementioned “brushing direction” of collagen fibers in the lamellae. 4. Conclusions In conclusion, we have demonstrated a new imaging technique with potential for in-vivo use that involves supplementing the variable-incidence-angle PS-OCT method reported by us previously with a conical beam scan protocol. The technique could facilitate the translation of the VIA-PS-OCT technique to the clinic by simplifying the requirements for the beam delivery probe, e.g. launching a low numerical aperture (NA) beam into a high NA objective lens.
#199326 - $15.00 USD Received 11 Oct 2013; revised 29 Nov 2013; accepted 20 Dec 2013; published 28 Mar 2014 (C) 2014 OSA1 March 2014 | Vol. 5, No. 3 | DOI:10.1364/BOE.5.000752 | BIOMEDICAL OPTICS EXPRESS 761
We present the theoretical model of bovine cartilage and compared with experimental data on bovine tendon and cartilage. Our simulation results are in good agreement with the experimental data. Hence we can conclude that our CS-PS-OCT data is consistent with Clark/Jeffery’s model of cartilage collagen organization. This provides support for the idea that collagen fibers in cartilage possess an anisotropic ‘brushed’ structure. We have shown that this new optical technique uniquely can locate the “brushing direction” of collagen fibers in articular cartilage, which is structural information that extends beyond established methods such as split-line photography or birefringent fast-axis measurement in that it is uniquely defined over the full azimuthal-angle range of (–π, + π). The brushing direction in Fig. 5(b) and also Fig. 6 is represented by a directed arrow to illustrate the forward/backward anisotropy that is revealed by CS-PS-OCT but not by birefringent fast-axis or split-line measurements. There are restrictions and assumptions underlying the method. Perhaps the most important is the assumption that the tissue is locally homogeneous over the conical volume swept out by the optical beam. In practice we are assuming homogeneity over ~1mm3 of tissue. Of course the modeling procedure does not strictly require this assumption; however the chance of unambiguously and quantitatively relating the polar birefringence plot to the underlying collagen structure depends strongly on this condition being met. The appearance of a simple morphological feature such as the “comet-crescent” is an effective way of visually determining this. However, even when the condition is not met, conical-scan PS-OCT still retains an advantage over conventional PS-OCT in that the beam is more optimally inclined relative to the fibers the various zones in order to produce strong retardance signals. It is interesting to speculate on whether there is any significant anatomical role for the observed fiber brushing direction. If so, then the mapping of this direction over the cartilage surface may offer insights into the optimal design of tissue-engineering scaffolds for cartilage repair, which are growing in sophistication through the use of additive manufacturing techniques [28]. There is also an increasing interest in determining the regional structure of collagen fibers in cartilage in order to improve the accuracy of mechanical models of the tissue [29]. New insights from conical-scan PS-OCT may then be of use in such studies. Acknowledgments The authors would like to thank Dr. M. Bonesi at Medizinische University Vien (Austria) for helpful advice in building and developing the PMF based PS-OCT system and Mr. Leon Edney for help with mechanical construction. This study was funded by EPSRC grants EP/F020422/1 and EP/1018328/1.
#199326 - $15.00 USD Received 11 Oct 2013; revised 29 Nov 2013; accepted 20 Dec 2013; published 28 Mar 2014 (C) 2014 OSA1 March 2014 | Vol. 5, No. 3 | DOI:10.1364/BOE.5.000752 | BIOMEDICAL OPTICS EXPRESS 762