Jul 30, 1997 - not yet in the database, a "learning" mechanism and a GUI is being developed to construct the .... Each node contains a key for sorting and a pointer to the actual object. Overlapped ..... Other output formats (JS-. PACE) have ...
Con~puterInterpretation of Process and Instrumentation Diagrams
T. Binford, T. Chen,
J. Kunz, and K. H. Law
CIPE Technical Report #I12 August, 1997
STANFORD UNIVERSITY
Copyright O 1997 by Center for Integrated Facility Engineering
If you would like to contact the authors please write to:
C/OCZFE, Civil and Environmental Engineering Dept., Stanford University, Terman Engineering Center Mail Code: 4020 Stanford, CA 94305-4020
SUMMARY CIFE TECHNICAL REPORT #I12 Header: CIPID Title: Computer Interpretation of Process and Instrument at ion Diagrams Authors: T. Binford, T . Chen, J. Kunz, and K.H. Law Publication Date: July, 1997 Funding Sources: Name of Agency: CIFE Title of Research Project: Seed Research Project
1
Abstract:
This report describes a prototype system that interprets Process and Instrumentation Diagrams (P&IDs). The system takes a P&ID in a vector CAD file in DXF format and produces an intelligent P&ID model that has symbolic interpretations for system components (e.g., check valve, pumps, etc.) and symbolic attributions (cold water, propane, etc.). The system finds structure among vectors, recognizes graphic symbols as physical components from a database of components (e.g., valves), interprets annotations that assign text t o graphic symbols. Representation of diagrams is a hierarchy of classes based on cellular topology and geometry (the Area-Curve-Vertex graph (ACV)) at the symbol level. Presently, there are about 100 graphic symbols in the database. The system has recognized 95% of covered graphic symbol instances for a full page of an industrial drawing, with 89% of graphic symbol instances covered (in the database). A drawing with 5,000 vectors required 20 minutes on an SGI Indy 4400SC (approximately 10% faster than a P 5 100MHz on SPECint92). For symbols that are not yet in the database, a "learning" mechanism and a GUI is being developed t o construct the ACV data structure of the unknown symbol.
2
Subject: What is the report about in laymen's terms? Turning vector CAD P&IDs into symbolic models. What are the key ideas or concepts investigated? Representation of symbol geometry, effective symbol recognition, computational complexity feasible for industrial applications.
What is the essential message? A theoretical-based scalable interpretation system has been developed. The system is effective, feasible, and promising for short-term exploitation.
Why did CIFE fund this research? IAB mentioned this as one important problem. What benefits does the research have t o CIFE members? Possible near-term applications of the prototype for drawing interpretation, demonstration of success in automated P&ID interpretation, dealing with legacy drawings, compliance with as-built, retrofitting, interpretation of vectorized drawing with symbolic models. What is the motivation for pursuing the research? Value of applications, technical interest and challenge. What did the research attempt t o prove/disprove or explore? The problem was originally thought t o be too difficult; there had been expensive failures by the industry. Our research demonstrates effective geometric computation for a broad class of diagrams.
4
Methodology: How was the research conducted? Phase I: feasibility demonstration - on the order of 10 symbols. Phase 11: a prototype system - on the order of 100 symbols (including the development of a "learning" mechanism for the identification of unknown symbols). Phase 111: scale-up. Did the investigation involve case studies, computer models, or some other method? An industrial, typical, single-sheet P&ID was used for the investigation. A theoretical class hierarchy based on previous work was developed for the representation of graphic symbols.
5
Results: What are the major findings of the investigation? The approach is wellfounded, very successful, and extensible. What outputs were generated? A conference paper, a journal article (accepted), and a software prototype.
6
Research Status: What is the status of the research? Seeking funding t o continue development and t o link with other applications.
What is the logical next step? Develop industrial prototype, add further capabilities (i.e., learning new and unusual symbols).
Are the results ready to be applied or do they need further development? The results so far are ready for initial productizing. What additional efforts are required before this research could be applied? Build a product and develop a pilot project to exploit and aid in productizing.
Computer Interpretation of Process and Instrument at ion Diagrams T. Binford, T. Chen, J. Kunz, and K.H. Law Stanford University, Stanford, CA 94305, USA July 30, 1997
1
Introduction
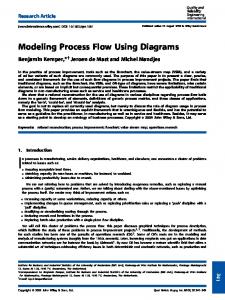
Process and Instrumentation diagrams (P&IDs) describe the components of a plant and their logical connectivity. Figure 1 shows one sheet of a representative P&ID. Some lines represent pipes. Clusters of vectors indicate components, e.g., valves and pumps. Some of the graphic symbols are annotated with text and symbols, e.g., to indicate sizes of pipes and valves or functions of elements. A P&ID for a large process plant may include 100-1000 sheets. A small fraction of new designs are made in intelligent P&ID design systems (said to be I%), but the bulk of new and existing designs may be made with non-intelligent CAD format. There is also a legacy of P&ID designs on paper only. The motivation for interpretation of P&IDs is to build intelligent, symbolic P&IDs for automated analysis, in support of retrofitting, for maintenance, for as-built specification, and for compliance with regulations. Across the spectrum of P&IDs, we expect there are typically a few hundred symbols that occur frequently, a similar number that occur infrequently in many P&IDs, and a few special symbols that are non-standard and may occur only in an individual drawing. We have implemented and tested a powerful mechanism to accommodate most of these symbols: generic representation of symbols, generation of generic symbol hypotheses, and a structured symbol database. We have made an effective implementation that was supported by a hierarchical class representation based on cellular topology. Figure 2 shows the plant composition model that represents structures throughout a process plant multi-sheet drawing. Each arc in the figure represents an interpretation step. Thus, for example, given a set of vectors, Step 2 of the interpretation process identifies the geometric structure and annotation text. The hierarchy of levels in the plant model covers symbolic, functional levels and geometric, graphic levels. Levels up through identification of components and assignment of annotation are more or less local and graphic in that they deal with information that is local in the diagram or implicit in conventions. Levels from circuits and up are non-local in that they deal with interpretations that are transmitted along connected components and pipes, potentially
Figure 1: One sheet of a Representative Industrial Process and Instrumentation Diagram (P&ID). Most lines on the drawing represent symbols for plant components or pipes connecting components; some lines are part of text annotations, and others divide the drawing visually into logical sections. over large parts of the diagram. These levels deal with constructs that are functional, e.g., chilled water subsystem. The P&ID interpretation system accepts a vector-based representation of a P&ID. The system has a generic database that represents defined components in terms of areas, curves and vertices (ACV). The system analysis methods first create an ACV data structure for a set of input vectors; then hypothesize components that may fit the data; and finally, match the input ACV with the hypothesized ACV's to find the component definitions that best fit the data. The resulting symbolic plant model represents the identified components (i .e., pipes, valves, pumps), their connectivity (i.e., pipe connections) and their identifiable attributes (e.g., dimensions, constituent fluids) that can be identified as annotations in the original P&ID drawing.
Plant Composition Model Examples:
-
I
Symbolic Model
cooling
+0I
4 Geometric Model
@
2
ACV
-b4-1XI-
Figure 2: Plant Composition Model and Examples. The plant composition model is used to represent a process plant. The different levels in the model are conceptually part of the geometric model or symbolic model. The geometric model is used to facilitate graphic interpretation (vector-to-symbol recognition). The symbolic model enables functional interpretation of P&IDs.
2
Status
The system now analyzes full, single sheets of P&IDs. A user defines connections between sheets interactively using a GUI. An input parser reads DXF files to extract entities and blocks. A display utility renders entities and blocks with pan and zoom. A module determines colinear relations among vectors that determine redundant, overlapping vectors that are very common; the module also determines colinear relations across gaps. A cellular topology structure is constructed after determining intersections between vectors, i.e. , L, T, and X vertices. From intersections, areas, curves, and vertices are linked in an ACV graph that defines the cellular topology of hypotheses. A generic hypothesis generation mechanism determines clusters of vectors that are hypotheses for components. The database of component symbols is structured in a hierarchy based on the ACV. Recognition is done by comparing the ACV of the component hypothesis to the component model. Joints are added for later use.
Annotations are analyzed in a similar way. Annotation graphic symbols are structured in an ACV graph for recognition. Annotation graphic symbols and bounding box of text strings are used to assign text to component symbols, i.e., pipes, valves, etc. Parsing and interpretation of text is underway for instruments and components. Two phases of development efforts have been demonstrated. A Phase 1 demonstration (feasibility) was done with a handful of components on a small part of a diagram. A Phase 2 demo was done with a full sheet from an industrial P&ID to demonstrate scaling up of the algorithms. The test was realistic in that it was a real P&ID. The graphic symbol database has about 100 symbols including component symbols and annotation symbols. Some statistical analysis of drafting in the test P&ID were used to make decisions about hypotheses and about computational complexity. The test diagram has about 5,000 vectors, with 356 symbol instances in 41 symbol classes. Of those symbol classes, 30 are covered in the symbol database and 318 (i.e., about 89%) symbols are covered instances. Of those covered symbol instances, 302 were recognized, i.e., 95% recognition of covered symbol instances. Overall recognition was 85% of all symbol instances. The system is developed in Allegro Common Lisp (with no declarations) on an SGI Indy R4400SC (150MHz) with performance about 92 SPECint92. The interpretation takes about 20 minutes. The efficiency can certainly be improved dramatically as we are continuing development of new algorithms and improving the implementation. For symbols that are not yet in the database, a "learning" mechanism is being developed to construct the ACV data structure of the unknown symbol.
Establishing Geometric Structure A P&ID diagram contains a large number of vectors. The first task is to find relations among vectors such as colinearity and intersection. For computational complexity reasons, it is useful to find colinear relations among vectors. At vector level (see Figure 2), colinear relations establish redundant, overlapping vectors (2-vertices) (see Figure 3) which occur frequently with input and output pipes in a block overlapping pipes connecting components, and with the same vector occurring in multiple layers. At component level, a pair of colinear opposed T-vertices often corresponds to the 110 ports (see Figure6(a) for example) of a component and is used as a strong evidence for generic component hypothesis generation. At circuit level, cascading components are often connected by colinear pipes. In the next step, colinear sets of vectors are used to build a cellular structure, which allows us to find L-vertices, T-vertices, and X-vertices efficiently.
3.1
Colinear Relations
P&IDs have predominantly horizontal and vertical vectors, but there are also vectors at various other angles. In some diagrams, a part of the drawing is set at an angle to give intuition about the setting in the plant. For computational efficiency, it is valuable to give preferential treatment to horizontal and vertical vectors, but the mechanism must
Figure 3: L-vertex, T-vertex and X-vertex. These are the four categories of connections commonly found in P&IDs. treat relations among vectors at all angles. We map vectors into colinear sets of horizontal, vertical, and other orientations. Colinear sets are stored as RB trees which are balanced binary trees with color on each node to ensure tree balancing[2]. Figure 4 (a) shows a horizontal colinear set of four line segments. The coordinates of the left endpoints are used as keys for sorting. Note that L1 and L2 are overlapped. Figure 4 (b) shows the binary tree for the colinear set. Each node contains a key for sorting and a pointer to the actual object. Overlapped lines (Z-vertices) can be found easily by performing tests within binary trees.
Pointe
Kl