Chapter 8
Consensus Algorithms: A Matter of Complexity? ACCEPTED VERSION Renato P. dos Santos Associate professor and Blockchain Researcher The Lutheran University of Brazil
[email protected]
Abstract This chapter discusses whether PoW, PoS, and hybrid consensus-based blockchains could be considered complex systems and, if so, whether chaotic ones. A positive response would raise concerns about their likelihood of entering a chaotic regime, with catastrophic consequences for financial systems as a potential result. This study was accomplished with the help of Information Theory of Complex Systems, in general, and Crutchfield’s Statistical Complexity measure, in particular. Contrasting to PoW consensus algorithms that were shown to be highly non-complex, the PoS consensus methods studied show an outstandingly higher measure of complexity, what is undesirable for what should be a simple computational system. This chapter is a work-in-progress and undoubtedly prone to incorrectness as consensus algorithms continue to evolve. As a final thought, however, considering that the presence of 3
4
Book Title
capital gains-seekers in cryptocurrency markets may introduce nonlinearity and, consequently, cause the emergence of chaotic regimes, one may wonder whether the recent surge of blockchain technology-based start-ups and use-based trading volume, even discounting all the scam ICO cases, could help to reduce non-linearity and prevent chaos. 1.1
Introduction
1.1.1. Consensus Algorithms Consensus algorithms are the essential operating feature of distributed ledgers. In computer science, consensus algorithms are protocols used to achieve agreement on a single data value or state among distributed processes or systems. In distributed ledgers, similarly, consensus algorithms are the process of the distributed peer-to-peer nodes in the network coming to agreement upon updates states of the ledger per executed transactions. Consensus algorithms are mechanistic and automated. As such, they provide the trustless software mechanism for the automatic execution of blockchain transactions between parties that do not need to know or trust each other. While the concept of decentralised digital currency has been around for decades (see, e.g. Wei Dai's b-money, 1998a), Satoshi Nakamoto's consensus algorithm [2008], known as “proof of work” (PoW), was a breakthrough because it simultaneously provided: 1. A simple and moderately effective consensus algorithm for collective agreement on a set of updates to the state of the Bitcoin ledger. 2. A mechanism that allowed free entry into the consensus process while preventing Sybil attacksb [Buterin, 2014].
a
http://www.weidai.com/bmoney.txt.
b
In a Sybil attack, the attacker attempts to take control of a network by filling it with clients that they control through forged identities. The name comes after a case study of a woman diagnosed with dissociative identity disorder.
ACCEPTED VERSION
5
1.1.2. Problem Context: Systemic Risk Systemic risk (the risk of large-scale failure in financial systems) is a problem in global financial markets that is challenging to classify, measure, and predict. It is unclear whether markets are more or less risky since the 2008 financial crisis and as a result of flash crashes (rapid price declines due to programmatic trading). The impact of blockchain technology implementations on financial market risk is also unknown. A general problem is a lack of methods for assessing financial risk in global markets. A specific problem is the need for assessment tools to evaluate the financial market risk of distributed ledger consensus algorithms. Economics and financial markets are a domain of complexity [Kirman, 2010], and therefore complexity methods are methodologically appropriate for their study. The novel contribution of this chapter is a demonstration case that applies mathematical complexity methods to the study of economics, in particular, to distributed ledger consensus algorithms. 1.1.3. Complexity Before proceeding with our analysis, it must be understood that some authors merely assume that the whole blockchain code possesses a high degree of complexity; they apparently confuse the high complication (of the code) with an eventual complexity of the resulting blockchain and Bitcoin ecosystem. To obscure things further, there is no concise definition of a complex system, which has been associated with properties such as non-linearity, chaotic behaviour, and emergent order, as well as oft identified with complicated or random (stochastic) systems. Besides, the term “complexity” has been so much used by so many authors, both scientific and non-scientific, that the word has, unfortunately, almost lost its meaning [Feldman and Crutchfield, 1998]. Complex systems are often quite loosely defined as those constituted by many different components in strong interaction and showing some selforganisation and emergent structured collective behaviour. One should then notice that this pseudo-definition finds an echo in the characterisation of the blockchain as the result of “the asynchronous
6
Book Title
interaction of a resilient network of thousands of uncomplicated, independent nodes, all following straightforward, algorithmic rules to accomplish a myriad of financial processes” [Antonopoulos, 2014, p. 177]. Consequently, blockchain seems to worth an analysis through the lenses of Information Theory of Complex Systems to clarify this issue. 1.1.4. Volatility Another observation that should be made is on attempts of understanding chaotic regimes in terms of high volatile ones. Volatility is habitually defined as a statistical measure of dispersion around the average of any random variable such as market parameters [Belev and Todorov, 2015], assuming that price follows a Gaussian random walk or a similar distribution and that some regression toward the mean always happens. Majdandzic et al. [2013] studied real-world dynamical networks and observed that, in their model, nodes always display a recovery process after events such as the 6 May 2010 “flash crash” of the US stock markets, irrespective of the failure of the nodes being due to internal or external causes. Mt Gox, the DAO, and hacking scandals in general, might be seen as unpredictable but post-facto explainable, massively impactful, high-volatility events, usually called “black swans” [Taleb, 2007]. It should be noticed, however, that Mandelbrot has already shown that financial markets are characterised by “wild randomness,” in which the price changes do not follow a Gaussian distribution, but rather Lévy stable distributions having infinite variance [Mandelbrot, 1963]. Therefore, a small shift in structural parameters of some markets may suffice to generate chaotic time paths of volatility, in which prices become highly unpredictable, which can be related back, e.g. to the 1987 stock market crash [Shaffer, 1991]. Vuorenmaa & Wang [2004] modelled that same 2010 flash crash as a “hot-potato effect,” derived from a fast feedback loop system collectively created by a network of high-frequency automatic traders and triggered by a massive institutional sell. Considering that we now live in a multi-species [Swan, 2015] trading world in which at least half of market volumes come from
ACCEPTED VERSION
7
algorithmic trading programs, the presence of chaos in those networks may lead to catastrophic market crashes without such a desirable recovery process. In other words, ordinary volatility is expected and even desirable to some degree as it provides profitable opportunities; chaotic regimes are a menace to any market. In Econophysics research, chaos theory has been applied to monetary, power, labour, international exchange rate, crude oil, gold, electricity, stock exchange, equity, currency, commodity, and sovereign marketsc. As an example, Tsionas and Michaelides [2017] studied the stock markets from USA, UK, Switzerland, Netherlands, Germany, and France, from 2003 to 2014, and identified chaos both before and after the 2008 financial crisis. Closer to this work, a recent study of Lahmiri and Bekiros [2018] focused on investigating the presence of chaos, randomness, and multi-scale temporal correlation structure in prices and returns data from the Bitcoin market using the largest Lyapunov exponent, Shannon entropy, and the multi-fractal detrended fluctuation analysis, respectively. Siddiqi [2014] studied the presence of chaos in the Bitcoin market, as characterized not only by positive feedback mechanisms, in the sense that the greater the number of users that accepts it as a currency the stronger is the incentive for outsiders to join in, but also by negative feedback ones, as the sole objective of capital gain seekers is to realize capital gains before the bubble bursts. Siddiqi’s result [2014] is that the price dynamics are modelled by 𝐶𝑡 = 𝑎𝐶𝑡−1 (1 − 𝑏⁄𝑎 𝐶𝑡−1 ) + 𝑎𝑞𝐶𝑡−2 where 𝐶𝑡 is the total number of capital gain seekers at any time t and 𝑎, 𝑏, and 𝑞, are constants of proportionality, which is a delay logistic model equivalent to the Hénon mapd. Consequently, in Siddiqi’s modelling, depending on the values of those constants, the Bitcoin market might enter a chaotic regime in which the number of participants in the market c
See, e.g. (Lahmiri & Bekiros, 2018), for references.
d
See (H. Skiadas & Skiadas, 2008, p. 91) for details of the associated chaotic attractor.
8
Book Title
oscillates dramatically, as their expectations become irrational and unpredictable. In this work, instead of focusing on market returns, we will study the presence of complexity on the underlying blockchain structures themselves. 1.2
Information Theory of Complex Systems
Due to the difficulties mentioned above in defining complexity in a consistent form, the systems’ complexity is analysed here, as in the previous paper [dos Santos, 2017], using the Crutchfield’s Statistical measure of complexity [Feldman and Crutchfield, 1998]. This choice is justified as Ladyman et al. [2013] showed that it was the measure of complexity available in the scientific literature that best captures the qualitative notion of the complexity of systems. 1.2.1 Measures of complexity According to Shannon’s significant contribution to the modern theory of communication [Shannon, 1948], the amount of information 𝐼𝑘 a process encodes in some event 𝑘 can be calculated (in bit units) as the negative base-2 logarithm of its probability 𝑝𝑘 𝐼𝑘 = − ln2 𝑝𝑘 Furthermore, Shannon also showed that the averaged uncertainty over the set of possible events 𝑘, the source entropy rate, − ∑ 𝑝𝑘 ln2 𝑝𝑘 𝑘
is a fundamental property that determines how compressible the outcomes of an information source are. Nevertheless, Shannon’s entropy can only express the notions of randomness, order, or complexity of a complete set of objects under
ACCEPTED VERSION
9
some distribution rather than of a single object. Combining notions of computability and statistics, Solomonoff, Kolmogorov, and Chaitin formulated independently in the mid-sixties what became known as the Kolmogorov–Chaitin complexity [Kolmogorov, 1959] or algorithmic complexity. In terms of Universal Turing Machines, for an object, such as a binary string of text, its algorithmic complexity equates the length of the shortest computer program (in a predetermined programming language) that produces that object as output. Unfortunately, however, Kolmogorov–Chaitin complexity requires the exact replication of the target string and, therefore, is being dominated by its eventual randomness. In other words, it is not a measure of structure but rather a measure of its randomness [Crutchfield, 2012]. To account for that, the usual solution is to discount for randomness by again describing the complexity in ensembles of behaviours [Crutchfield, 2012]. Besides, Chaitin [1969] demonstrated that, for most objects, it is not possible to compute even a lower bound for its Kolmogorov complexity let alone its exact value. In other words, as it happens with many other complexity measures, Kolmogorov complexity is not computable. 1.2.2 Crutchfield’s Statistical Complexity Crutchfield’s alternative approach to complexity stems from Computational Mechanics, an extension of Statistical Mechanics that describes not only a system's statistical properties but also how it stores and processes information – how it computes [Crutchfield, 2012]. This approach consists then of encoding the structures of the discrete process under study in reconstructed computational models, referred to as єmachines, Turing Machines that can guess, in Crutchfield’ words [Crutchfield, 1994]. All one must do is to uncover the system’s initial physical configuration, the computation whose performing corresponds to the temporal sequence of changes in the system’s internal state, and the state to which the system relaxes [Crutchfield, 1994]. Once the reconstruction is complete, one can discuss the structure of the original process from the statistical complexity of the corresponding є-machine,
10
Book Title
which measures the structure of the minimal є-machine [Crutchfield, 1994]. Three optimality theorems ensure that the є-machine representation of a process captures all the process’s properties, including its randomness and organisation from the available, indirect measurements that some instrument provides [Crutchfield, 2012]. These measurements may be arranged in histories from which predictions about everything that is predictable about the system can be defined. Two histories are said to be equivalent if they lead to the same prediction and, from them, classes 𝜎 of equivalent histories may be then constructed. These equivalence classes 𝜎 are called the “causal states” of the process, as they themselves retain all the relevant information for predicting the future of the system [Crutchfield, 2012]. Given this framework, the statistical complexity 𝐶𝜇 can be calculated as 𝐶𝜇 = − ∑ 𝑃(𝜎)𝑙𝑜𝑔2 𝑃(𝜎) 𝜎∈𝑆
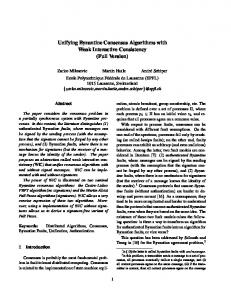
where 𝑆 is the set of all the causal states and 𝑃(𝜎) is the probability distribution over them [Crutchfield, 2012]. For a system with only two (complementary) causal states σ1 and σ2 , Figure 1 shows how the Crutchfield’s Statistical Complexity measure Cμ varies as a function of the ratio between their probabilities P(σ1 ) and P(σ2 ) = 1 − P(σ1 ).
ACCEPTED VERSION
11
Figure 1. Crutchfield’s Statistical Complexity measure 𝐶𝜇 as a function of the ratio between the probability 𝑃(𝜎1 ) of some causal state 𝜎1 and of its complementary state 𝜎2 , 𝑃(𝜎2 ) = 1 − 𝑃(𝜎1 ).
The maximum value of this complexity measure occurs when both causal states have the same probability, and the measure is minimal when one causal state is much less probable than the other, a conclusion that can be generalised for systems with more than two causal states. Nevertheless, this dependence on causal states should not be confused with one on traditional system states, e.g. of the fair-coin flip. Rather this system is unpredictable: all different histories of measurements are equivalent in their inability to predict this system’s future behaviour. There is only one class 𝜎 of equivalent histories, whose probability is consequently 𝑃(𝜎) = 1, and its statistical complexity, from the formula above, is 𝐶𝜇 = 0.
12
Book Title
1.3
Analysis
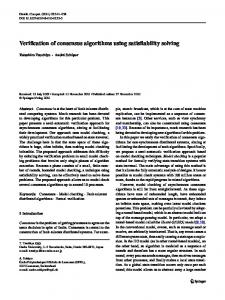
In this section, we will proceed to calculate the Statistical Complexity of the stream of blocks provided by a few different consensus protocols to infer whether the resulting blockchains can be considered complex systems. 1.3.1 PoW complexities To proceed with our analysis, it is worth quoting Charles Moore, author of the original “Block Chain Ledger” and “Inter Ledger Protocol” patent [AU2000030225, 2005], that the Bitcoin blockchain “is a sequential time machine.” “Within Bitcoin, the difficulty in finding a conforming hash acts as a clock. A universal clock, if you will, because there is only one such clock in the universe. It does not matter that this clock is imprecise. What matters is that the this is the same clock for everyone and that the state of the chain can be tied unambiguously to the ticks of this clock” [Moore, personal communication, May 23, 2018]. Moore’s understanding supports our previous paper’s [dos Santos, 2017] assumption, following Crutchfield and Young [1989], that the Bitcoin blockchain can be reconstructed (modelled) as a semi-infinite-stringproduction є-machine (Figure 2), one block per tick.
Figure 2. Bitcoin blockchain as seen as a semi-infinite-string-production є-machine.
This machine oscillates about every 10 minutes between two states (Figure 3), like a clock’s tick and tock:
ACCEPTED VERSION
13
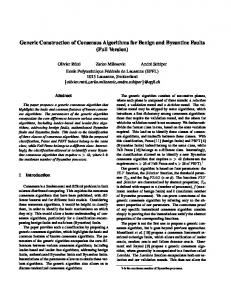
1. 𝜎𝑚 (mining state): A new block was just incorporated into the blockchain, and the machine starts mining a new block that includes most of the pending transactions collected from around the world into the transaction pool. Hashes are generated and tested against the network's difficulty target. 2. 𝜎𝑏 (broadcasting state): A nonce that results in a hash smaller than the target is found, the validated block is broadcast to the P2P network for inclusion into the blockchain.
Figure 3. Bitcoin blockchain as seen as a semi-infinite-string-production є-machine. After the start-state corresponding to the generation of the origin block, indicated by the inscribed circle, it oscillates between the two states 𝝈𝒎 and 𝝈𝒃 .
To calculate the Crutchfield’s Statistical Complexity measure of Bitcoin’s blockchain, consider that new blocks are created about every 10 minutes [Antonopoulos, 2014, p. 2], or 600 seconds, and that, for a network production rate value of 27.8 exa (1018) hashes per second, it takes on average (2.78 × 10¹⁹ ) × 600 ≅ 1.66 × 10²² hashes to find one that is lower than the target. Therefore, the probability of the broadcasting state is
14
Book Title
𝑃(𝜎𝑏 ) = 1⁄(1.66 × 10²² ) ≅ 6.0 × 10⁻²³ , the probability of the complementary mining state 𝜎𝑚 is 𝑃(𝜎𝑚 ) = 1 − 𝑃(𝜎𝑏 ) ≅ 1 − 6.0 × 10⁻²³ and the statistical complexity 𝐶𝜇 , with only these two causal states 𝑆 = {𝜎𝑚 , 𝜎𝑏 }, resultse 𝐶𝜇 = −[𝑃(𝜎𝑚 )𝑙𝑜𝑔2 𝑃(𝜎𝑚 ) + 𝑃(𝜎𝑏 )𝑙𝑜𝑔2 𝑃(𝜎𝑏 )] 𝐶𝜇 = −[(1 − 6.0 × 10⁻²³ )log2 (1 − 6.0 × 10⁻²³ ) + (6.0 × 10⁻²³ )log2 (6.0 × 10⁻²³ )] 𝐶𝜇 ≅ 4.51 × 10⁻²¹f. Now, applying this procedure to a few PoW cryptocurrencies, using their respective network production rate values on May 12, 2018, we obtain the results shown in Table 1. Table 1. Crutchfield’s Statistical Complexity measure 𝑪𝝁 calculated for a few PoW cryptocurrencies. Currency
Bitcoin
Block time†
Ether
Bit. Cash
BTC Gold
Litecoin
Dash
Monero
Eth. Classic
10 min
0.25 min
10 min
10 min
2.5 min
2.5 min
2 min
0.25 min
2.78×10¹⁹
2.77×10+14
4.62×10+18
3.50×10+07
2.98×10+14
1.80×10+15
4.32×10+08
7.70×10+12
𝐶𝜇
4.51×10⁻²¹
1.28×10⁻¹⁴
2.62×10⁻²⁰
1.70×10-09
1.27×10⁻¹⁵
2.19×10⁻¹⁶
7.15×10⁻¹⁰
4.17×10⁻¹³
Currency
Zcash
Hashrate (hash/s)†
Block time†
2.5 min
Vertcoin 2.5 min
Dogecoin 1 min
Feathercoin 1 min
BlackCoin 1 min
Namecoin 10 min
Auroracoin 1 min
e
Due to 𝑃(𝜎𝑏 ) being much smaller than 1, we used Padé Approximation log e (1 − 𝑥) ≅ −𝑥 (6 − 𝑥)⁄(6 − 4𝑥) to increase the precision of calculation of the (1 − 𝑃(𝜎𝑏 ))log 2 (1 − 𝑃(𝜎𝑏 )) term.
f
The complexity measure of Bitcoin’s blockchain was previously estimated (dos Santos,
2017), for the then current network production rate of 4.27 exahashes per second, as approximately 𝐶𝜇 ≅ 1.56 × 10⁻²⁰ , a higher but still extremely low value.
ACCEPTED VERSION Hashrate (hash/s)† 𝐶𝜇 †
15
4.23×10+08
1.02×10+12
2.21×10+14
5.45×10+09
9.61×10+13
2.20×10+19
1.37×10+15
5.88×10⁻¹⁰
3.18×10⁻¹³
4.14×10⁻¹⁵
1.21×10⁻¹⁰
9.33×10⁻¹⁵
5.68×10⁻²¹
7.00×10⁻¹⁶
Obtained on May 12, 2018, from https://bitinfocharts.com
These extremely low statistical complexity 𝐶𝜇 results (see Figure 1) lead us to the conclusion that PoW-based blockchains, in general, can hardly be considered complex. What confirms and extends to all these cryptocurrencies is the statement about Bitcoin from Charles Moore: “Block Chain Ledgers are very simple, they are just ledgers with a hash chain applied to them. [...] I build these things and I can only build simple systems. Complex ones will always fail and cannot be secured. [sic]” [Moore, personal communication, April 20, 2017]. The functioning of these blockchains may indeed be regarded as algorithmically complicated, but not complex. 1.3.2 PoS complexities PoW was undoubtedly crucial to give birth to Nakamoto’s breakthrough. However, its computing power-intensive nature implies that PoW cryptocurrencies are dependent on energy consumption, as is demonstrated in practice. That introduces significant costs in the operation of those networks that are compensated via a combination of inflation and transaction fees. As the mint rate slows in the Bitcoin network, reducing the block reward that the successful miner takes, it is putting pressure on raising transaction fees to sustain a preferred level of security, as predicted by King and Nadal [2012]. Due to the likely increasing energy consumption of the PoW algorithm, and consequent pressure on rising transaction fees, there has been a burst of popularity in favor of the cryptocurrencies that use the alternative algorithm known as “Proof-of-Stake” (PoS) for choosing the block creators. In the PoS protocol structure, the forger of the next block is chosen in a deterministic, pseudo-random way, and the chance of being selected depends on its wealth (the stake). PoS calculates the weight of a node according to its currency holdings and not its computational resources [Buterin, 2014]. That is why, in PoS cryptocurrencies, the
16
Book Title
blocks are usually said to be forged (in the blacksmith sense of this word) or minted [Popov, 2016]. For example, the Nxtg consensus algorithm chooses the account to generate the next block according to the number of coins it has. The wealthier the account is, the higher the chance that it will be selected to generate the next block and receive the corresponding transaction fees. Habitually, one assumes that this probability should be precisely proportional to the account’s balance, although this is not entirely accurate for Nxt [Popov, 2016]. In Nxt, to obtain the right to forge (generate) a block, each active Nxt account “competes” by waiting for a new round, with each passing second that no block is generated, until its particular target value surpasses its own random ‘hit’ value. This is calculated by applying a SHA256 hashing function to its account public key and the generating signature of the current block. The bigger the account stake is, the higher and faster-growing will be its target, making it easier to surpass its hit [Nxt community, 2016; Nxt Wiki contributors, 2017]. In other words, in Nxt, the “chance” of an account to forge a block hinges only on its current ‘stake’ (which is a property of each account), the time passed since the last block was forged (which is shared by all forging accounts) and the base target value (which is also shared by all accounts). The process is smoothed such that the generation block time between blocks is ensured to be of 60 seconds in average [Nxt community, 2016]. Instead of a global target against which nodes keep generating their hashes until the target is hit, in Nxt, the individual hits are calculated beforehand, and new, increased target values are generated each second until one that satisfies the ℎ𝑖𝑡 < 𝑡𝑎𝑟𝑔𝑒𝑡 condition is found [Andruiman, 2014]. Consequently, PoS-based blockchains can also be modelled as semiinfinite-string-production machines that oscillate between two states about every minute: 1. 𝜎𝑡 (targeting state): A new block was just incorporated into the blockchain. Each active forging account 𝑘 generates its own
g
http://nxtplatform.org/
ACCEPTED VERSION
17
random hit value 𝐻𝑘 and starts generating new, increasing individual target value 𝑇𝑘 each second that no block is generated, until some of them surpass their own hit values. 2. 𝜎𝑏 (broadcasting state): One or more accounts hit their own target and win the right to forge candidate blocks. Each one of them bundles up to 255 unconfirmed transactions into a new block along with all its required parameters and broadcasts it to the network as a candidate for the blockchain. Consequently, we apply the same procedure above to Nxt to evaluate its statistical complexity 𝐶𝜇 . In Nxt, a block is forged about every 60 seconds and new targets are generated each second. It takes on average 60 targets to find one that is bigger than its own hit. Therefore, the probability of the broadcasting state (𝜎𝑏 ) is 𝑃(𝜎𝑏 ) = 1⁄60 ≅ 1.67 × 10⁻² , the probability of the complementary targeting state (𝜎𝑡 ) is 𝑃(𝜎𝑡 ) = 1 − 𝑃(𝜎𝑏 ), and the statistical complexity 𝐶𝜇 , with only these two causal states 𝑆 = {𝜎𝑡 , 𝜎𝑏 }, resultsh 𝐶𝜇 = −[𝑃(𝜎𝑡 )𝑙𝑜𝑔2 𝑃(𝜎𝑡 ) + 𝑃(𝜎𝑏 )𝑙𝑜𝑔2 𝑃(𝜎𝑏 )] 𝐶𝜇 = −[(1 − 1.67 × 10⁻² )log 2 (1 − 1.67 × 10⁻² ) + (1.67 × 10⁻² )log 2 (1.67 × 10⁻² )] 𝐶𝜇 ≅ 0.122,
h
Due to 𝑃(𝜎𝑏 ) being much smaller than 1, we used Padé Approximation log e (1 − 𝑥) ≅ −𝑥 (6 − 𝑥)⁄(6 − 4𝑥) to increase the precision of calculation of the (1 − 𝑃(𝜎𝑏 ))log 2 (1 − 𝑃(𝜎𝑏 )) term.
18
Book Title
a value of Crutchfield’s Statistical Complexity measure that is 10 to 20 orders of magnitude bigger than those of Table 1. Consequently, serious concerns are raised about the possibility of Nxt entering a chaotic regime at any time without notice. Differently from above Siddiqi’s modelling [2014] of the presence of chaos in a cryptocurrency market, however, the emergence of a chaotic regime in a blockchain itself could mean disruption of the network communication, due extreme flutuaction of the number of connected nodes, bursts of excessive number of transactions in the pool, high number of rejected blocks and/or unconfirmed transactions, all of which could be exploited by a 51% attacker. The PoS protocol has since been improved and implemented in many conceptually different versions and blockchain projects. Notable examples include “Proof of Stake Version 2” by Pavel Vasin (2014) and “Proof of Stake Version 3” (PoS 3, or SPoS) by Patrick Dai et al. (2017), implemented in Qtumi, as well as lesser-known projects. In Qtumj, as the blocks are forged about every 2 minutes (120 s), and new targets are generated every 16 seconds, it takes on average 120⁄16 = 7.5 targets to find one that is bigger than its own hit, and the probability of the broadcasting state (𝜎𝑏 ) is 𝑃(𝜎𝑏 ) = 1⁄7.5 ≅ 0.133, and the statistical complexity 𝐶𝜇 , with only these two causal states 𝑆 = {𝜎𝑡 , 𝜎𝑏 }, results 𝐶𝜇 = −[(1 − 0.133)log 2 (1 − 0.133) + (0.133)log 2 (0.133)] 𝐶𝜇 ≅ 0.566, Table 2 exhibits these results for NxT and Qtum (PoS)
i
http://qtum.org
j
http://qtum.org
ACCEPTED VERSION
19
Table 2. Crutchfield’s Statistical Complexity measure 𝑪𝝁 calculated for Nxt and Qtum (PoS) cryptocurrencies. Currency
NXT
Block time‡ Hashrate (hash/s) 𝐶𝜇 ‡
‡
Qtum
60 s
2 min
1.0
0.0625
0.122
0.556
Obtained from their respective whitepapers.
1.3.3 Other PoS protocols There are also other PoS protocols with conceptually different implementations. For example, the probability of being selected may also depend on the time the coins stay in the account without being spent or transferred (the so-called coin age) [Popov, 2016]. Coin age can be defined merely as currency amount times holding period [King and Nadal, 2012]. The concept of coin age was known to Nakamoto at least as early as 2010 and used in Bitcoin to help prioritise transactions, but it did not play much of a critical role in Bitcoin’s present security model. Scott Nadal and Sunny King independently rediscovered the concepts of PoS and coin age in October 2011, whereby realising that PoS could indeed replace most PoW’s functions with a careful redesign of Bitcoin’s minting and security model [King and Nadal, 2012]. Another PoS variation is Proof of Stake Velocity (PoSV), implemented in Reddcoink, which intends “to encourage both ownership (Stake) and activity (Velocity), which directly correspond to the two main functions of Reddcoin as a real currency: a store of value and a medium of exchange” [Ren, 2014]. The anonymity of wallet addresses, however, implies the inability to obtain an accurate measure of the velocity since it is impossible to know which coins were spend on goods or merely transferred back to their owner. Reddcoin takes Velocity into account by changing the form of the coin-ageing function from a linear to an k
http://reddcoin.com/
20
Book Title
exponential decay one, with a definite half-life of say one month [Ren, 2014]. This decaying coin-ageing makes new coins accumulating coin age at a much higher rate than old ones and is assumed to incentive PoSV stakeholders to be active in moving their holding, either by mining or transacting with counterparties, as well as staying online and contributing to verifying transactions on the PoSV network [Ren, 2014]. This feature is considered to incentivise money velocity, improve Reddcoin economy’s health, and increase the difficulty for 51% attacks [Ren, 2014]. 1.3.4 Hybrid protocols There are also hybrid PoW+PoS implementations, in which PoW mining works as both a steady distribution channel for the cryptocurrency and a fall-back network security mechanism. As PoW block rewards decrease over time, the PoS protocol has enough time to migrate into use in a complementary fashion [Ren, 2014]. For example, in King and Nadal’s Peercoinl design, a new minting process is introduced for PoS blocks in addition to the existing Bitcoin PoW minting, and blocks are separated into two distinct types: PoW blocks and PoS blocks. However, a crucial difference is that the hashing operation is executed over a limited search space (more specifically one hash per unspent wallet-output per second) instead of an unlimited search space as in PoW. Thus, no significant consumption of energy is involved [King and Nadal, 2012]. In Peercoin design, both PoW hash target and PoS hash target are adjusted continuously rather than Bitcoin’s two-week adjustment interval, to avoid a sudden jump in the network generation rate [King and Nadal, 2012]. Table 3 exhibits the results of applying this procedure to Reddcoin (PoSV), and a few hybrid cryptocurrencies, using their respective network production rate values on May 12, 2018.
l
http://peercoin.net/
ACCEPTED VERSION
21
Table 3. Crutchfield’s Statistical Complexity measure 𝑪𝝁 calculated for Reddcoin (PoSV), and a few hybrid cryptocurrencies. Currency
Reddcoin
Block time† Hashrate (hash/s) 𝐶𝜇 †
†
Peercoin
BlackCoin
NovaCoin
1 min
10 min
60 s
10 min
+10
+16
3.32×10
+14
1.06×10
4.42×10+11
3.29×10⁻¹⁸
8.52×10⁻¹⁵
1.86×10⁻¹³
1.30×10
5.26×10⁻¹¹
Obtained on May 12, 2018, from https://bitinfocharts.com
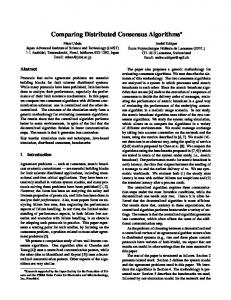
1.3.5 Final comparison Figure 4 exhibits a comparison of the calculated complexities according to the consensus protocols. One observes a dramatically higher value of the complexity measure of the Nxt and Qtum PoS protocols in comparison to the other ones.
Figure 4. A comparison of the calculated complexities according to the consensus protocols.
The higher difficulty of the other protocols to be selected to mine/forge a block, and consequently the higher required hashrate, leads to their lower complexity value. In contrast, since the time interval between block
22
Book Title
forging in Nxt is kept around 60 seconds and 2 minutes in Qtum, the probability of any node being selected is substantially higher than in other currencies. According to Moore, the results above indicate that alternatives to PoW “misunderstand the actual problem and provide a solution to a different problem space” [personal communication, May 23, 2018]. It is not yet clear, however, whether this is a feature of the PoS protocol itself or a characteristic of the Nxt and Qtum implementations. It is conceivable, therefore, that some different implementation of the basic PoS protocol could have a higher competition among ‘forgers’ and, consequently, a lower complexity. 1.4
Discussion and Future Work
The results obtained here suggest that Crutchfield’s Statistical Complexity may be used as an effective analysis tool to evaluate the viability of proposed high-performance network cryptographic methods from the available quantitative data. 1.4.1 Practical consequences A nuance regarding complexity should be distinguished. On the one hand, this chapter argues that economics, financial markets, and systemic risk are domains of complexity, and thus warrant study with complexity methods. On the other hand, the research finding of this analysis is that low complexity is better for blockchains and financial markets. This study examined various kinds of blockchain consensus algorithms and found that PoW consensus algorithms were generally shown to be remarkably less complex, as measured by Crutchfield’s Statistical Complexity, and, therefore, are probably safer. Recapitulating simplistically, for blockchains and financial markets, complexity methods are a useful and relevant analysis tool; complexity itself is bad. The much higher complexity of Nxt and Qtum PoS consensus protocols is undesirable for what should be a simple computational system. Therefore, the proposed PoS methods seem to be too convoluted and
ACCEPTED VERSION
23
complicated to be globally scalable, applicable, and sustainable as a model of decentralised network computing. Nonetheless, this high complexity does not seem to come from the PoS concept per se but from the implementation. In this case, from the smaller degree of competition among forgers, derived from the tremendously smaller number of trials per second that are made in Nxt and Qtum to select the next forger. 1.4.2 Future Work: Application to Next-generation Consensus Algorithms The same principles of Crutchfield’s Statistical Complexity could likewise be applied to the assessment of next-generation consensus algorithms as data become available. These include Practical Byzantine Fault Tolerance (PBFT) proposals from projects such as DFINITY, Mimblewimble, HashGraph, and IOTA Tangle, and innovative architectures in the form of directed acyclic graphs (DAGs) and blockless blocks. 1.4.3 Preventing chaos As a final thought, returning to the discussion at the end of previous paper [dos Santos, 2017], while the above results indicate that most blockchain infrastructures present extremely low statistical complexity measures, and in general, would hardly be expected to enter a chaotic regime, unfortunately, the same cannot be said of the ecosystems built upon them. Siddiqi [2014] attributes a likeliness of the emergence of chaos in the Bitcoin market to the non-linearity introduced in it by the presence of capital gains-seekers, hoping to buy tokens cheap and sell them high. Likewise DApps (distributed applications) and cryptoeconomy communities built on top of blockchain platforms such as Ethereum (low complexity) might themselves be subject to higher complexity. Contrary to the appeal for regulatory policies, Shaffer’s study [1991] concluded that regulations alone cannot guarantee freedom from chaos.
24
Book Title
Perhaps market volume in well-designed cryptocurrencies with low complexity consensus algorithms can accomplish what regulation cannot. One considers the overall financial market effect of the recent surge of blockchain technology-based start-ups, even discounting for ICO scam cases. By launching new venues for functional users (payers and payees) to use cryptocurrencies to save on transaction costs involving the buying and selling of goods and services [Siddiqi, 2014], a helpful side effect is also likely reducing non-linearity and preventing market chaos. 1.5
References
Andruiman. (2014). Nxt forging algorithm: simulating approach. Retrieved from https://pt.scribd.com/document/243341106/Nxt-forging-algorithm-simulatingapproach Antonopoulos, A. M. (2014). Mastering Bitcoin. Unlocking Digital Crypto-Currencies. Sebastopol, CA: O’Reilly Media. Belev, E., and Todorov, M. (2015). Volatility. In Financial Dictionary. FinancialDictionary.net. Retrieved from http://www.financialdictionary.net/define/Volatility/ Buterin, V. (2014). A Next-Generation Smart Contract and Decentralized Application Platform. Ethereum Whitepaper. Retrieved from www.fintech.academy/wpcontent/uploads/2016/06/EthereumWhitePaper.pdf Chaitin, G. J. (1969). On the Simplicity and Speed of Programs for Computing Infinite Sets of Natural Numbers. Journal of the ACM, 16(3), 407–422. https://doi.org/10.1145/321526.321530 Crutchfield, J. P. (1994). The calculi of emergence: computation, dynamics and induction. Physica D: Nonlinear Phenomena, 75(1-3), 11–54. https://doi.org/10.1016/0167-2789(94)90273-9 Crutchfield, J. P. (2012). Between order and chaos. Nature Physics, 8(1), 17–24. https://doi.org/10.1038/nphys2190 Dai, P., Mahi, N., Earls, J., and Norta, A. (2017). Smart-Contract Value-Transfer Protocols on a Distributed Mobile Application Platform. Singapore: Qtum Foundation. https://doi.org/10.13140/RG.2.2.35140.63365 dos Santos, R. P. (2017). On the Philosophy of Bitcoin/Blockchain Technology: Is it a Chaotic, Complex System? Metaphilosophy, 48(5), 620–633. https://doi.org/10.1111/meta.12266 Feldman, D. P., and Crutchfield, J. P. (1998). Measures of statistical complexity: Why? Physics Letters A, 238(4-5), 244–252. https://doi.org/10.1016/S03759601(97)00855-4
ACCEPTED VERSION
25
King, S., and Nadal, S. (2012). PPCoin: Peer-to-Peer Crypto-Currency with Proof-ofStake. Peercoin Whitepaper. Retrieved from https://peercoin.net/assets/paper/peercoin-paper.pdf Kirman, A. (2010). Complex Economics: Individual and Collective Rationality. London UK: Routledge. Kolmogorov, A. N. (1959). Entropy per unit time as a metric invariant of automorphisms. Doklady Akademii Nauk SSSR (Proceedings of the USSR Academy of Sciences), 124(4), 754_755. Ladyman, J., Lambert, J., and Wiesner, K. (2013). What is a complex system? European Journal for Philosophy of Science, 3(1), 33–67. https://doi.org/10.1007/s13194012-0056-8 Lahmiri, S., and Bekiros, S. (2018). Chaos, randomness and multi-fractality in Bitcoin market. Chaos, Solitons & Fractals, 106, 28–34. https://doi.org/10.1016/j.chaos.2017.11.005 Majdandzic, A., Podobnik, B., Buldyrev, S. V., Kenett, D. Y., Havlin, S., and Eugene Stanley, H. (2013). Spontaneous recovery in dynamical networks. Nature Physics, 10(1), 34–38. https://doi.org/10.1038/nphys2819 Mandelbrot, B. (1963). The Variation of Certain Speculative Prices. The Journal of Business, 36(4), 394–419. https://doi.org/10.1086/294632 Moore, C. R. J. (2005). AU2000030225. Australia: IP Australia. Retrieved from http://www.ipaustralia.com.au/applicant/moore-charles-rj/patents/AU2000030225/ Nakamoto, S. (2008). Bitcoin: A Peer-to-Peer Electronic Cash System. Bitcoin.org. Retrieved from https://bitcoin.org/bitcoin.pdf Nxt community. (2016, February 7). Nxt Whitepaper. Retrieved November 27, 2017, from http://nxtwiki.org/wiki/Whitepaper:Nxt Nxt Wiki contributors. (2017, July 24). Forging. In Nxt Wiki. Nxt Wiki. Retrieved from https://nxtwiki.org/wiki/Forging Popov, S. (2016). A Probabilistic Analysis of the Nxt Forging Algorithm. Ledger, 1(1), 69–83. https://doi.org/10.5195/LEDGER.2016.46 Ren, L. (2014). Proof of Stake Velocity: Building the Social Currency of the Digital Age. Reddcoin. Retrieved from http://reddcoin.com/papers/PoSV.pdf Shaffer, S. (1991). Structural shifts and the volatility of chaotic markets. Journal of Economic Behavior & Organization, 15(2), 201–214. https://doi.org/10.1016/0167-2681(91)90029-W Shannon, C. E. (1948). A Mathematical Theory of Communication. Bell System Technical Journal, 27(3), 379–423. https://doi.org/10.1002/j.15387305.1948.tb01338.x Siddiqi, H. (2014). The Routes to Chaos in the Bitcoins Market. SSRN Electronic Journal. https://doi.org/10.2139/ssrn.2396997 H. Skiadas, C., and Skiadas, C. (2008). Chaotic Modelling and Simulation: Analysis of Chaotic Models, Attractors and Forms. Boca Raton, FL: Chapman and Hall/CRC. https://doi.org/10.1201/9781420079012
26
Book Title
Swan, M. (2015). Digital Simondon: The collective individuation of man and machine. Platform: Journal of Media and Communication, 6(1 – Special Issue: Gilbert Simondon: Media and technics), 46–58. Retrieved from https://platformjmc.files.wordpress.com/2015/04/v6_swan.pdf Taleb, N. N. (2007). The Black Swan: The Impact of the Highly Improbable. New York: Random House. Tsionas, M. G., and Michaelides, P. G. (2017). Neglected chaos in international stock markets: Bayesian analysis of the joint return–volatility dynamical system. Physica A: Statistical Mechanics and Its Applications, 482, 95–107. https://doi.org/10.1016/j.physa.2017.04.060 Vasin, P. (2014). BlackCoin’s Proof-of-Stake Protocol v2. Retrieved from https://blackcoin.co/blackcoin-pos-protocol-v2-whitepaper.pdf Vuorenmaa, T. A., & Wang, L. (2014). An Agent-Based Model of the Flash Crash of May 6, 2010, with Policy Implications. SSRN Electronic Journal. https://doi.org/10.2139/ssrn.2336772