Consequential Validity of the Implicit Association Test Comment on Blanton and Jaccard (2006) Anthony G. Greenwald Brian A. Nosek N. Sriram
Numeric values of psychological measures often have an arbitrary character before research has grounded their meanings, thereby providing what S. J. Messick (1995) called consequential validity (part of which H. Blanton and J. Jaccard, 2006, this issue, now identify as metric meaningfulness). Some measures are predisposed by their design to acquire meanings easily, an example being the sensitivity measure of signal detection theory. Others are less well prepared, illustrated by most self-report measures of self-esteem. Counter to Blanton and Jaccard’s characterization, the Implicit Association Test (IAT) has properties that predispose it to acquire consequential validity rapidly. With the IAT as the subject of over 250 publications since 1998, there is now much evidence for its consequential validity. The IAT has attracted more scholarly criticism than have other measures designed for similar purposes. The authors speculate as to why the IAT is an attractive target. Keywords: Implicit Association Test, consequential validity, predictive validity, IAT
A
ny new psychological measure is under challenge to establish its validity. Validity may include theoretical value (construct validity), empirical value (predictive validity), or applied value (ecological and consequential validity). Blanton and Jaccard (2006, this issue) offered a new validity label, arbitrariness: “We define a metric as arbitrary when it is not known where a given score locates an individual on the underlying psychological dimension or how a oneunit change on the observed score reflects the magnitude of change on the underlying dimension” (p. 28). Like Blanton and Jaccard, we use meaningfulness as the opposite of arbitrariness, and we therefore take metric meaningfulness to be the appropriate label for their preferred alternative. Blanton and Jaccard’s (2006) conception of metric meaningfulness is similar to and is largely contained within the concept of consequential validity that was described in this journal by Messick (1995, also cited by Blanton & Jaccard). Messick defined consequential validity as the aspect of construct validity that “appraises the value implications of score 56
University of Washington University of Virginia University of Washington
interpretation as a basis for action as well as the actual and potential consequences of test use, especially in regard to sources of invalidity related to issues of bias, fairness, and distributive justice” (p. 745). Only one component of Blanton and Jaccard’s definition of metric meaningfulness is not subsumed within consequential validity, and that may be a problematic component: their stated requirement of establishing a mapping onto the “true score on the latent construct of interest” (p. 28). We return to that requirement shortly.1 This comment focuses on Blanton and Jaccard’s (2006) characterization of the metric meaningfulness of the Implicit Association Test (IAT; Greenwald, McGhee, & Schwartz, 1998). We find Blanton and Jaccard’s treatment of the IAT inappropriate in its discussion of “arbitrary zero points” (pp. 33–34) and “norming” (pp. 34 –35). To explain our disagreement, we first consider, as a preliminary, properties of a very well-known psychological measure: the Anthony G. Greenwald and N. Sriram, Department of Psychology, University of Washington; Brian A. Nosek, Department of Psychology, University of Virginia. The authors and the universities with which they are affiliated have partial ownership of intellectual property related to the Implicit Association Test (IAT) and its presentation on the World Wide Web. Anthony G. Greenwald owns stock in IAT Corp., which has copyright ownership of some procedures related to the IAT. Correspondence concerning this article should be addressed to Anthony G. Greenwald, Department of Psychology, University of Washington, Box 351525, Seattle, WA 98195-1525. E-mail:
[email protected] 1
To be clear about the analysis that we comment on, we note here two possible interpretations that we have set aside because we are confident they were not intended by Blanton and Jaccard (2006). Blanton and Jaccard sometimes referred to arbitrary metrics as properties intrinsic to psychological tests or to research procedures (e.g., “Many psychological tests have arbitrary metrics”; p. 27). However, they also make clear that they regard arbitrariness to be a property that is modifiable both as a result of research evidence and as a function of the researcher’s changing understanding of the evidence (pp. 28 –29). Another variant interpretation could result from their assertion that “Metric arbitrariness is a concern . . . when researchers wish to draw inferences about the true, absolute [italics added] standing of a group or individual on the latent psychological dimension being measured” (p. 27). Despite the implication of this remark, Blanton and Jaccard certainly do not intend to limit the property of metric meaningfulness to measures that have properties of absolute scales (cf. Luce & Suppes, 2001): Such scales are virtually nonexistent in psychology.
January 2006 ● American Psychologist Copyright 2006 by the American Psychological Association 0003-066X/06/$12.00 Vol. 61, No. 1, 56 – 61 DOI: 10.1037/0003-066X.61.1.56
Anthony G. Greenwald
sensitivity (d⬘) measure of signal detection theory (Green & Swets, 1966; Macmillan, 1993).
Metric Meaningfulness of Sensitivity (dⴕ) Measures in Signal Detection Tasks Signal detection theory’s d⬘ measure is derived from two proportions, a hit rate (the proportion of signal-present responses on trials that include a signal stimulus) and a false alarm rate (the proportion of signal-present responses on trials that contain no signal). An example of a performance situation that generates these data is the task of detecting the presence of a faint pure tone (signal) in a background of white noise. Signal-absent trials present only the background noise. An inverse normal transformation is applied to each of the hit and false alarm proportions to produce two z values. Sensitivity (d⬘) is the difference between those two z values, calculated to be numerically positive when the hit rate exceeds the false alarm rate. Necessarily, when the hit and false alarm rates are equal, d⬘ ⫽ 0. This zero value has an absence interpretation— absence of sensitivity to the signal’s presence. Validity of the d⬘ metric resulting from this computation depends on the assumed existence of an unobserved latent dimension of strength of evidence. It is additionally assumed that strength of evidence is normally distributed on both signal-present and signal-absent trials, with equal variance of the strength-ofevidence distributions characterizing these two types of trials. There is no available means of observing the hypothetical evidence-strength differences to which d⬘ corresponds. Nevertheless, appreciation of meanings of numeric values of d⬘ can derive from the computational relations between d⬘ and behavioral performance data. When hit and false alarm rates average 50%, d⬘ values of 0.0, 0.5, 1.0, 2.0, 3.0, and 4.0 correspond to correct performance figures January 2006 ● American Psychologist
of 50% (chance performance), 60%, 69%, 84%, 93%, and 98%, respectively. These percentages are maxima when signal-present and signal-absent trials are equally likely. Remarkably, Blanton and Jaccard’s (2006) account of metric arbitrariness suggests that the well-defined mapping of d⬘ scores onto performance accuracy does not suffice to make d⬘ a metrically meaningful measure. From Blanton and Jaccard’s perspective, the problem with d⬘ is that the mapping onto performance accuracy is uninformative about “standing . . . on the latent psychological dimension being measured” (p. 27). Although Blanton and Jaccard (2006) thus appear to deny d⬘ the possibility of being identified as a metrically meaningful measure in their terms, the mapping of d⬘ onto performance accuracy makes entirely clear that numerical values of d⬘ have consequential validity. For example, knowing that a test procedure to identify the presence of cancer has a d⬘ of 2.0 tells us that it can classify up to 84% of cases accurately, or knowing that a baseball umpire’s ball and strike decisions have a d⬘ of 3.0 tells us that the umpire can classify up to 93% of pitches accurately. In this fashion, d⬘ is certainly linked to “meaningful events that are of applied interest” (p. 30). Our conclusion is that in imposing the requirement of establishing a mapping onto the “true underlying dimension” (p. 28), Blanton and Jaccard (2006) specified a condition for metric meaningfulness (a) that is not required for consequential validity (as defined by Messick, 1995), (b) that relatively few psychological measures will achieve, and (c) that can often conflict (as it does for d⬘) with their own alternative definition in terms of linkage to events of applied interest. Blanton and Jaccard’s wavering between describing arbitrariness in terms of linkage to a latent dimension and linkage to natural phenomena brings conceptual difficulty.
Association Strengths (D) Measured by the IAT The IAT’s association strength measure was labeled with the letter D (Greenwald, Nosek, & Banaji, 2003) to acknowledge its relation both to signal detection theory’s d⬘ measure and to Cohen’s (1977) d measure of effect size for differences between means. Each is a variety of standardized difference measure, computed from transformations of two values derived from empirical data. For d⬘, the values are proportions. For D, the values are averages of latencies, with each mean latency being divided by the standard deviation of all latencies that enter into the two means.2 Similar to the absence interpretation of a zero value of d⬘ (i.e., no sensitivity to signal presence), D ⫽ 0 has an absence interpretation: no difference in strengths between the pairs of associations measured by the two tasks from which the mean latencies were obtained. 2 A consequence of using the standard deviation that combines observations in both conditions rather than a pooled within-condition standard deviation (which is used for Cohen’s d) is that D is bounded by ⫺2 and ⫹ 2 (Cohen’s d is unlimited).
57
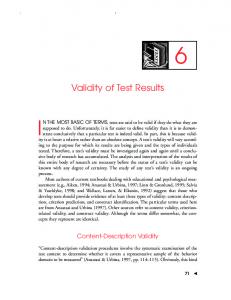
Figure 1 Evidence for a Meaningful Zero Point of a Presidential Preference Implicit Association Test (IAT) Measure, Provided by Previously Unpublished Web-Obtained Data
Note. The criterion is the IAT’s D measure of implicit attitudinal preference for George W. Bush relative to John F. Kerry. The predictor is a three-item self-report measure of candidate preference. Small dots are individual cases, which are arrayed in vertical lines because of the limited possible values of the self-report measure. Solid black diamonds display average IAT scores for these vertical arrays. Because of excessive variability, these average values have been suppressed for arrays of fewer than 100 cases.
Although we readily find consequential validity of d⬘ on the basis of its mapping onto performance accuracy, we do not similarly find consequential validity of D in its relations to measured performance latencies. The performance latencies from which D is computed are not conducive to intuitive interpretations of the sort that performance accuracy provides for d⬘. Therefore, establishing the consequential validity of D must depend on findings that link numeric values of D to effects on measures that support more intuitive interpretation. We describe such evidence below. Location of the Zero Point For Blanton and Jaccard (2006), a critical component of metric meaningfulness is the meaningfulness specifically of a measure’s zero value (pp. 33–34). We agree with Blanton and Jaccard (p. 34) that the use of a measure in difference form does not by itself guarantee that the measure has a meaningful zero value.3 Greenwald et al. (2002) provided 58
empirical evidence bearing on the location of the IAT’s zero value using tests of predicted effects involving multiplicative products of two IAT measures. These tests would have failed to support their theory-based predictions if the IAT’s zero values were dislocated relative to rational zero values. (See Blanton & Jaccard, in press, and Greenwald, Rudman, Nosek, & Zayas, in press, for further discussion of the relevance of these empirical tests to conclusions about rational zero values of IAT measures.) Figure 1 presents previously unpublished data that bear on the validity of the IAT’s zero-point location. These data were obtained from an IAT measure of presidential 3 Blanton and Jaccard’s (2006) discussion declared that IAT researchers assume a rational zero point “by fiat” (p. 33). We are unaware of any published statement that can support this assertion. Greenwald et al. (2002, p. 11) explicitly devised a method of testing theorized predictions that would fail when the zero-point location assumption was incorrect.
January 2006 ● American Psychologist
IAT measure and the self-report measure shown in Figure 1 have ratio scale properties. Interpretation of Units
Brian A. Nosek
Analyses of statistical power by Cohen (e.g., 1977), together with the widespread use of meta-analysis, have established very wide familiarity with the units of standardized measures of effect size. There are well-known conventional associations of values of effect size measures with labels such as small (or weak), medium (or moderate), and large (or strong). Since the first appearance of the IAT as a demonstration procedure on the World Wide Web in 1998, IAT measures have been reported using such labels, computed in a fashion based on conventions introduced by Cohen (1977). Published findings of research using IAT measures have often been reported in the form of effectsize measures such as r or d.5 Because such standardized measures are familiar from their frequent use, the IAT’s standardized D metric should more readily acquire meaning than would a measure that did not capitalize on such a well-known format. Consequently, we find it unfortunate that Blanton and Jaccard (2006, pp. 34 –35) chose to disparage the use of such standardized measures. Connection to Meaningful Events
candidate preference. This is an IAT that typically shows large correlations with self-report attitude measures.4 These data were all those obtained for this IAT measure between November 15, 2003, and November 19, 2004, from respondents at the IAT’s demonstration Web site (http://implicit.harvard.edu). The target concepts used in the IAT measure were George W. Bush and John F. Kerry (represented by face pictures) and the attribute concepts were pleasant and unpleasant valence (represented by easily classifiable words). Figure 1 shows that the zero value of the IAT’s D measure corresponded closely to the zero point of a selfreport measure of candidate preference. The self-report measure consisted of (a) the difference between two 10point thermometer ratings— one for each candidate—averaged with (b) a 5-point Likert-type item anchored at its extremes (scored ⫺2 and 2) by strong preference for Kerry and strong preference for Bush, respectively. The thermometer difference and the Likert measure were each divided by their standard deviations before averaging the two. Appropriateness of the location of the zero point for this self-report measure is indicated by both its obvious symmetric bimodality in Figure 1 and its additional mode at the zero point. Despite the extremely high power of the regression analysis of Figure 1’s data, the statistical test of the regression intercept’s deviation from 0 (intercept ⫽ – 0.004 on the D measure) was nonsignificant, t(8527) ⫽ ⫺1.08, p ⫽ .28. A regression analysis that included quadratic and cubic components yielded a multiple correlation of .73, with the linear trend component explaining 53.3% of the IAT’s variance and the two higher order components summing to only an additional 0.5%. This very small departure from linearity suggested that, to a close approximation, both the January 2006 ● American Psychologist
Blanton and Jaccard (2006) used the phrase “linking a scale metric to meaningful events that are of applied interest” (p. 30) to describe what they saw as a satisfactory means of establishing metric meaningfulness. In regard to the IAT, they unfortunately did not consider the large body of published correlational findings that provide such linkages for IAT measures. The growing body of predictive validity findings for the IAT (86 independent research samples as of May 2005) was recently summarized meta-analytically by Poehlman, Uhlmann, Greenwald, and Banaji (2005). The summarized findings provide highly reliable evidence for linkage of IAT attitude and stereotype measures to “meaningful events that are of applied interest.”
Why Focus on the IAT? IAT measures have two properties that predispose them to being metrically meaningful in Blanton and Jaccard’s (2006) sense. First, by being computed as a difference between measures derived from treatments that differ by a controlled experimental variation, the IAT measure (like the d⬘ measure of signal detection theory) has a head start in establishing association with a meaningful zero. Second, 4 Many data domains are characterized by weak correlations between parallel IAT and self-report measures. Nevertheless, these correlations are almost invariably positive and can be quite large in domains of consumer brand preferences and political candidate preferences (Poehlman, Uhlmann, Greenwald, & Banaji, 2005). 5 Although the IAT’s D measure is a standardized measure, its values are not interpretable in the same fashion as are values of Cohen’s d measure (of effect size of mean differences). Standard deviations of D measures are often approximately 0.5 (e.g., SD ⫽ 0.49 for the IAT D measure shown in Figure 1). Accordingly, translation to the d scale of effect size requires (approximately) doubling of values of D measures.
59
low in self-esteem might seem arbitrary because most of those so classified actually have positive self-regard. Furthermore, the very same scores that are classified as low (below median) in self-esteem in an American sample might be classified as high (above median) in self-esteem in a sample of East Asians (e.g., Yamaguchi et al., 2005). The Value of Criticism
N. Sriram
because computation of the IAT’s D measure includes a statistical standardization, interpretation of its numerical values can take advantage of the widespread understanding of standardized measures. This would seem to make the IAT relatively inappropriate as an example of a measure with an arbitrary metric. Comparison With a Widely Used Self-Report Measure Many measures have much greater potential than the IAT to illustrate what Blanton and Jaccard (2006) described as metric arbitrariness. Somewhat arbitrarily, but also because it is so widely known among personality, social, and developmental psychologists, we select the Rosenberg (1965) Self-Esteem Scale as an example of a measure for which metric meaningfulness may be difficult to demonstrate. Rosenberg’s measure has neither of the two just-noted characteristics that predispose a measure to rapid acquisition of consequential validity or metric meaningfulness. In particular, the Rosenberg Self-Esteem Scale measure (a) has no zero point and (b) has a maximum value that varies depending on the number of agreement-response options provided for each of its 10 items. A standard practice in reporting results from the Rosenberg (1965) Self-Esteem Scale measure is to characterize respondents with below-median scores as being low in self-esteem and those with above-median scores as being high in self-esteem. The great majority of Americans thus characterized as low in self-esteem are actually people who agree more with statements such as “On the whole, I am satisfied with myself” than with statements such as “At times I think I am no good at all” (these are the Rosenberg measure’s first two items). In Blanton and Jaccard’s (2006) terms, identification of below-median respondents as being 60
The IAT’s race attitude measure has been the subject of several critical articles (Blanton & Jaccard, in press; Brendl, Markman, & Messner, 2001; Karpinski, 2004; Karpinski & Hilton, 2001; McFarland & Crouch, 2002; Olson & Fazio, 2004; Rothermund & Wentura, 2004; Steffens & Plewe, 2001). Although one might assume that scholarly criticism is unwelcome, we—as researchers identified with the IAT—find it extremely valuable. This value is evident in several recent publications of method-focused IAT work (e.g., Cai, Sriram, Greenwald, & McFarland, 2004; Greenwald et al., 2003; Greenwald, Nosek, Banaji, & Klauer, 2005; Greenwald et al., in press; Mierke & Klauer, 2003; Nosek, Greenwald, & Banaji, 2005; Pinter & Greenwald, 2005). Without the instigation provided by scholarly criticism of the IAT, there would have been less motivation to pursue questions of method. Mindful of the aphoristic precaution against looking gift horses in the mouth, we nevertheless find ourselves unable to resist speculating as to why the IAT has attracted more critical attention than have other similar measures. We suspect that the explanation is in the IAT’s property of affording a “palpable” experience of implicit bias (Banaji, 2001, p. 136; Monteith, Ashburn-Nardo, Voils, & Czopp, 2002). The IAT’s property of producing a palpable and possibly unsettling reaction during performance may be its central asset. That quality may be responsible for motivating much of the scholarly attention from which development of the IAT method has benefited. These benefits have come not only from research directed at improving the IAT as a research method but also in the remarkably rapid pace of construct validation research. Fortunately, scholarly critique of the IAT does not appear to be in danger of ceasing immediately. On the basis of some of the most recent criticism, investigations of the contribution of cultural knowledge to IAT measures (Olson & Fazio, 2004) may lead to improved theoretical understanding of the IAT (Nosek & Hansen, 2005; Uhlmann & Poehlman, 2005). REFERENCES Banaji, M. R. (2001). Implicit attitudes can be measured. In H. L. Roediger, III, J. S. Nairne, I. Neath, & A. Surprenant (Eds.), The nature of remembering: Essays in honor of Robert G. Crowder (pp. 117–150). Washington, DC: American Psychological Association. Blanton, H., & Jaccard, J. (2006). Arbitrary metrics in psychology. American Psychologist, 61, 27– 41. Blanton, H., & Jaccard, J. (in press). Tests of multiplicative models in psychology: A case study using the unified theory of implicit attitudes, stereotypes, self-esteem, and self-concept. Psychological Review. Brendl, C. M., Markman, A. B., & Messner, C. (2001). How do indirect measures of evaluation work? Evaluating the inference of prejudice in
January 2006 ● American Psychologist
the Implicit Association Test. Journal of Personality and Social Psychology, 81, 760 –773. Cai, H., Sriram, N., Greenwald, A. G., & McFarland, S. G. (2004). The Implicit Association Test’s D measure can minimize a cognitive skill confound: Comment on McFarland and Crouch (2002). Social Cognition, 22, 673– 684. Cohen, J. (1977). Statistical power analysis for the behavioral sciences (Rev. ed.). Hillsdale, NJ: Erlbaum. Green, D. M., & Swets, J. A. (1966). Signal detection theory and psychophysics. New York: Wiley. Greenwald, A. G., Banaji, M. R., Rudman, L. A., Farnham, S. D., Nosek, B. A., & Mellott, D. S. (2002). A unified theory of implicit attitudes, stereotypes, self-esteem, and self-concept. Psychological Review, 109, 3–25. Greenwald, A. G., McGhee, D. E., & Schwartz, J. L. K. (1998). Measuring individual differences in implicit cognition: The Implicit Association Test. Journal of Personality and Social Psychology, 74, 1464 – 1480. Greenwald, A. G., Nosek, B. A., & Banaji, M. R. (2003). Understanding and using the Implicit Association Test: I. An improved scoring algorithm. Journal of Personality and Social Psychology, 85, 197–216. Greenwald, A. G., Nosek, B. A., Banaji, M. R., & Klauer, K. C. (2005). Validity of the salience asymmetry interpretation of the Implicit Association Test: Comment on Rothermund and Wentura (2004). Journal of Experimental Psychology: General, 134, 420 – 425. Greenwald, A. G., Rudman, L. A., Nosek, B. A., & Zayas, V. (in press). Why so little faith? A reply to Blanton and Jaccard’s (2006) skeptical view of testing pure multiplicative theories. Psychological Review. Karpinski, A. (2004). Measuring self-esteem using the Implicit Association Test: The role of the other. Personality and Social Psychology Bulletin, 30, 22–34. Karpinski, A., & Hilton, J. L. (2001). Attitudes and the Implicit Association Test. Journal of Personality and Social Psychology, 81, 774 –788. Luce, R. D., & Suppes, P. (2001). Representational measurement theory. In H. Pashler & J. Wixted (Eds.), Stevens’ handbook of experimental psychology (3rd ed., Vol. 4, pp. 1– 41). New York: Wiley. Macmillan, N. (1993). Signal detection theory as data analysis method and psychological decision model. In G. Keren & C. Lewis (Eds.), A handbook for data analysis in the behavioral sciences: Methodological issues (pp. 21–57). Hillsdale, NJ: Erlbaum. McFarland, S. G., & Crouch, Z. (2002). A cognitive skill confound on the Implicit Association Test. Social Cognition, 20, 483–510.
January 2006 ● American Psychologist
Messick, S. (1995). Validity of psychological assessment: Validation of inferences from persons’ responses and performances as scientific inquiry into score meaning. American Psychologist, 50, 741–749. Mierke, J., & Klauer, K. C. (2003). Method-specific variance in the Implicit Association Test. Journal of Personality and Social Psychology, 85, 1180 –1192. Monteith, M. J., Ashburn-Nardo, L., Voils, C. I., & Czopp, A. M. (2002). Putting the brakes on prejudice: On the development and operation of cues for control. Journal of Personality and Social Psychology, 83, 1029 –1050. Nosek, B. A., Greenwald, A. G., & Banaji, M. R. (2005). Understanding and using the Implicit Association Test: II. Method variables and construct validity. Personality and Social Psychology Bulletin, 31, 166 –180. Nosek, B. A., & Hansen, J. J. (2005). The associations in our heads belong to us: Searching for attitudes and knowledge in implicit evaluation. Unpublished manuscript, University of Virginia, Charlottesville. Olson, M. A., & Fazio, R. H. (2004). Reducing the influence of extrapersonal associations on the Implicit Association Test: Personalizing the IAT. Journal of Personality and Social Psychology, 86, 653– 667. Pinter, B., & Greenwald, A. G. (2005). Clarifying the role of the “other” category in the self-esteem IAT. Experimental Psychology, 52, 74 –79. Poehlman, T. A., Uhlmann, E., Greenwald, A. G., & Banaji, M. R. (2005). Understanding and using the Implicit Association Test: III. Metaanalysis of predictive validity. Manuscript submitted for publication. Rosenberg, M. (1965). Society and the adolescent self-image. Princeton, NJ: Princeton University Press. Rothermund, K., & Wentura, D. (2004). Underlying processes in the Implicit Association Test (IAT): Dissociating salience from associations. Journal of Experimental Psychology: General, 133, 139 –165. Steffens, M. C., & Plewe, I. (2001). Items’ cross-category associations as a confounding factor in the Implicit Association Test. Zeitschrift fu¨r Experimentelle Psychologie, 48, 123–134. Uhlmann, E. L., & Poehlman, T. A. (2005). Automatic associations: Personal attitudes or cultural knowledge? Unpublished manuscript, Yale University, New Haven, CT. Yamaguchi, S., Greenwald, A. G., Banaji, M. R., Murakami, F., Chen, D., Shiomura, K., et al. (2005). Comparisons of implicit and explicit self-esteem among Chinese, Japanese, and North American university students. Unpublished manuscript.
61