Northwestern University Medical School. Chicago, Illinois 60611 ... Automotive Engineers, NUMIFORM, and NUMISHEET conferences. Springback can be ...
Consistent and Minimal Springback Using a Stepped Binder Force Trajectory and Neural Network Control
Jian Cao and Brad Kinsey
Department of Mechanical Engineering Northwestern University Evanston, Illinois 60208
Sara A. Solla
Department of Physics and Astronomy Northwestern University Evanston, Illinois 60208
Department of Physiology Northwestern University Medical School Chicago, Illinois 60611
Abstract
One of the greatest challenges of manufacturing sheet metal parts is to obtain consistent part dimensions. Springback, the elastic material recovery when the tooling is removed, is the major cause of variations and inconsistencies in the final part geometry. Obtaining a consistent and desirable amount of springback is extremely difficult due to the non-linear effects and interactions between process and material parameters. In this paper, the exceptional ability of a neural network along with a stepped binder force trajectory to control springback angle and maximum principal strain in a simulated channel forming process is demonstrated. When faced with even large variations in material properties, sheet thickness, and friction condition, our control system produces a robust final part shape.
Introduction
Obtaining consistent and accurate part dimensions is crucial in today’s competitive manufacturing industry.
Inconsistencies in part dimensions slow new
product launches, increase changeover times, create difficulties in downstream processes, require extra quality assurance efforts, and decrease customer satisfaction and loyalty for the final product. In the sheet metal forming process, a major factor preventing accurate final part dimensions is springback in the material.
Springback is the geometric
difference between the part in its fully loaded condition, i.e. conforming to the tooling geometry, and when the part is in its unloaded, free state. For a complicated 3-D part, undesirable twist is another form of springback.
The uneven distribution of stress
through the sheet thickness direction and across the stamping in the loaded condition relaxes during unloading, thus producing springback. Factors that affect the amount of springback include variations in both process and material parameters, such as friction condition, tooling geometry, material properties, sheet thickness, and die temperature. Because controlling all of these variables in the manufacturing process is nearly impossible, springback, in turn, cannot be readily controlled. Adding to the difficulty is the fact that springback is a highly non-linear effect; therefore, simulations and correcting
1
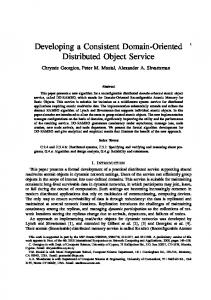
methods are complicated. There has been a tremendous amount of research interest related to springback in recent years as is evident in proceedings of Society of Automotive Engineers, NUMIFORM, and NUMISHEET conferences. Springback can be reduced through modifications to the forming process. Several researchers have proposed to use a stepped binder force trajectory to accomplish this objective (Ayres, 1984, Hishida and Wagoner, 1993, Sunseri et al., 1996). A stepped binder force trajectory is an instantaneous jump from a low binder force (LBF) value to a high binder force (HBF) at a specified percentage of the total punch displacement (PD%) (see Fig. 1). Sunseri et al. (1996) investigated springback in the Aluminum channel forming process shown in Fig. 2. Their work was conducted through experiments and simulations at specific values for process and material parameters.
In a production
environment, however, the amount of springback will deviate from the desired level due to variations in the process. Therefore, a control system that accommodates variations in process parameters is required. In recent years, many research groups have investigated the use of artificial neural networks to control sheet metal forming processes. Metal forming is an ideal candidate for neural network control due to the non-linear effects and interactions of the process parameters. Cho et al. (1997) used a neural network to predict the force in cold rolling, and Di and Thomson (1997) predicted the wrinkling limit in square metal sheets under diagonal tension. Among others (Elkins, 1994 and Yang et al., 1992), Forcellese et al. (1997) used a neural network to control springback in a 60ο aluminum V-punch air bending process.
Their system was trained using five, experimentally obtained
parameters from the punch force trajectory, an off-line measurement of sheet thickness, and the target bend angle as the inputs into the neural network and the punch displacement as the output. In another research project, Ruffini and Cao (1998) proposed to use a neural network to control springback angle in a channel forming process with punch force trajectory as the sole source for identifying the process variations and adjusting the HBF used in Sunseri et al. (1996).
Preliminary results showed this
approach to be promising. In this paper, the springback of an Aluminum channel is controlled via a stepped binder force trajectory and neural network control. The neural network determines the
2
HBF and PD% of the stepped binder force trajectory.
Punch force trajectory was
identified as the key parameter that reflects variations in material properties, sheet thickness, and friction coefficient. Therefore, four polynomial coefficients from curve fitting the punch force trajectory were used as inputs into the neural network. Figure 3 shows a flowchart of our proposed control system for this application. Despite large variations in material properties, sheet thickness (t), and friction coefficient (µ), the springback angle (θ) was maintained between 0.2ο and 0.6ο and the maximum strain (ε) was limited to between 8% and 10%. Finally, a comparison with the closed-loop control method proposed by Sunseri et al. (1996) is included to show the benefits of our control method. While only numerical simulation results are presented here, the control system will be physically implementation in the future to verify improvement claims.
Channel Forming Process
A simple geometry to investigate springback is a channel forming process. Therefore, the same Aluminum channel forming process used by Sunseri et al. (1996) is employed here (see Fig. 2). First, the effect of constant binder force (CBF) on springback was evaluated.
As the CBF was increased while all other process and material
parameters were held constant in our simulations, the springback angle, θ, was reduced as shown graphically in Fig. 4 and physically in Fig. 5. However, the increased binder force caused a subsequent increase in the maximum strain1 in the material, solid line in Fig. 4, to levels that exceed the maximum stretchability of Aluminum (Graf and Hosford, 1993). By utilizing a stepped binder force trajectory, moderate maximum strain levels in the sidewall were obtained while reducing springback in the process as demonstrated in the table of Fig. 1. To produce a robust process when faced with deviations in the friction coefficient, Sunseri et al. (1996) implemented closed-loop variable binder force control to follow the punch force trajectory obtained from the stepped binder force case with nominal process conditions. This control method was able to produce consistent springback levels when the friction coefficient was varied from a value of 0.1, for the nominal case, to 0.25.
1. In this work, maximum strain refers to the maximum principal logarithmic strain in the channel. 3
However, whether this methodology could withstand variations of other parameters such as material properties and sheet thickness was not determined.
Finite Element Model.
A commercial Finite Element Analysis package
(ABAQUS, 1997) was used for our numerical simulations of the channel forming process. Since the problem is close to a plane-strain condition and is symmetric, only one sixteenth of the width and half of the length of the entire blank (220mm x 46mm) was modelled. The binder, the die, and the punch were modelled as three separate rigid surfaces. Each surface was modelled using four-node interface elements (ABAQUS type IRS4), and a Coulomb friction law was assumed.
Our blank mesh had an uneven
distribution of 40 four-node, reduced integration shell elements (ABAQUS type S4R) with a more dense concentration of elements where the blank contacted the punch and binder corner radii.
Boundary conditions were specified to create a plane-strain
condition. The material was modelled to be isotropic, elasto-plastic following the von Mises yield criterion and isotropic strain hardening. The elastic properties were the Young’s Modulus, E, of 70 GPa and Poisson’s ratio, ν, of 0.3. The plastic behaviour of the sheet material was modelled using a power law relation (σ=Kεn). Our nominal material, denoted Material 1, had a material strength coefficient, K, of 528 MPa and a strain hardening exponent, n, of 0.265.
Proposed Control System
In a channel forming process, springback in general is extremely sensitive to variations in material and forming parameters. In this work, we develop a methodology for controlling springback while producing an acceptable amount of maximum strain in the material through a combination of a stepped binder force trajectory and neural network control. In a stepped binder force trajectory, two critical values need to be determined, the magnitude of the HBF and the PD% of the total punch displacement. These two parameters are the outputs from our neural network. From our previous research experience in sheet metal forming process control (Ruffini and Cao, 1998, Kinsey and Cao, 1997, and Sunseri et al, 1996), the punch force trajectory was selected
4
as the parameter that provides information about the current process.
Therefore,
polynomial coefficients from curve fitting the punch force trajectory are used as inputs into the neural network. A flowchart of our proposed control system is shown in Fig. 3. The forming process would proceed normally at a constant initial binder force, 16 kN, to a depth of 10 mm. While the punch displacement continues, the polynomial coefficients from curve fitting of the punch force trajectory are calculated and fed into a neural network. The outputs from the neural network, the HBF and PD% for the stepped binder force trajectory, would be obtained in time to make the appropriate HBF adjustment at the specified punch location, 19 mm multiplied by the PD%. The value of 10 mm, where the coefficients from the punch force trajectory are calculated, was chosen for two reasons. At this distance, the punch force trajectory is well defined and enough data points are available for accurate curve fitting to occur. Figure 6 shows the effect variations in t and µ have on the punch force trajectory from 0 to 10 mm. Secondly, the distance of 10 mm allows adequate CPU time for calculations to be conducted. Assuming a punch speed of 50 mm/sec and setting the minimum PD% as 57.5% of the total punch displacement, 10.925 mm, approximately 18.5 msec are available to compute inputs into the neural network and predict the HBF and PD% of the stepped binder force trajectory.
Curve fitting and neural network programs on our
Pentium II, 233 MHz computer required approximately 10 msec to compute values. How close to a true step function is produced will depend on the speed of the binder force varying mechanism. The punch force trajectory was broken up into three regions, Region A, a transition region, and Region B (see Fig. 6). The groups of lines in Region A correspond to varying values of sheet thickness, and a second-degree polynomial was used to fit the data in this region. Despite the fact that it was a second degree polynomial, only two input coefficients were used to characterize this region since the punch force trajectory nearly passed through the origin. In Region B, the dissimilar slopes are mainly caused by changes in the friction coefficient. A linear interpolation provided two additional inputs for the network. Thus, a total of four polynomial coefficients were used as inputs into our neural network.
5
Note that the punch force trajectories are obtained from numerical simulations; therefore, they are smooth and have consistent patterns due to variations in t and µ. In an actual forming process, noise in the data acquisition equipment would produce disparities in these curves. By using polynomial coefficients from curve fitting the punch force trajectory, the inputs into the neural network are in essence filtered to account for these practical considerations. To implement this control system in an actual forming operation, training data would need to be produced. This information could be derived from actual production of stampings during die try out by varying process parameters. For instance, to account for batch to batch variation in the material, material could be obtained and formed which represents the full range of potential sheet thicknesses and material properties. Also, the lubrication state could be varied.
Using various combinations of these process
parameters, the HBF and PD% values, which produce the desired amount of springback, could be determined.
In addition, numerical simulations, calibrated to experimental
results to assure accuracy, could be used to expeditiously increase the amount of training data. Once the neural network is well trained with the entire range of potential process parameter values, actual values of the material properties, sheet thickness, and friction state are not required since the inputs into the neural network are polynomial coefficients from punch force trajectory curve fitting. Any increasing binder force trajectory could be implemented to reduce springback. However, the simplicity of the stepped binder force trajectory requires only two input parameters, HBF and PD%. In addition, existing presses in industry have the ability to produce a stepped binder force trajectory. Therefore, a stepped binder force trajectory is an ideal choice.
Neural Networks. Artificial neural networks have been studied for many years in the hope of mimicking the human brain’s ability to solve problems that are ambiguous and require a large amount of processing. Human brains accomplish this data processing by utilizing massive parallelism, with millions of neurons working together to solve complicated problems.
Similarly, artificial neural network models consist of many
computational elements, called “neurons” to correspond to their biological counterparts,
6
operating in parallel and connected by links with variable weights. These weights are adapted during the training process, most commonly through the backpropagation algorithm (Rumelhart and McClelland, 1986), by presenting the neural network with examples of input-output pairs exhibiting the relationship the network is attempting to learn. The goal is for the neural network to generalize, or extract, the pattern given in the input-output examples. Further details on neural networks in general can be found in Widrow and Lehr (1990). For our particular application, the structure of the neural network was determined to be four input parameters, five hidden neurons, and two outputs. A sigmoidal activation function was used for the hidden neurons while the outputs utilized a linear one. A more detailed discussion on how this optimal structure was determined is given in Kinsey (1998). To initially determine the feasibility of using a neural network to control and minimize springback, the ability of the neural network to handle large variations in the t and µ was investigated. Sheet thickness values from 0.8 to 1.4 mm (in increments of 0.1 mm between 0.8 and 1.2 mm) and friction coefficient levels from 0.04 to 0.20 (in increments of 0.01 between 0.04 and 0.12 and afterwards in increments of 0.02) were considered. These variations in t and µ values are obviously larger than what would be seen in an actual mass production forming process but are used here for demonstration purposes to show the capability of neural networks to control even considerable changes in variables. Training data was generated through trial and error simulations for 104 combinations of these two process parameters to determine the HBF and PD% values which produced a springback angle, θ, in the range of 0.4ο to 0.5ο and a maximum strain, ε, in the range of 8% to 10%. This extremely narrow springback range was intentionally chosen with the realization that the predicted values for the HBF and PD% from the trained network may not result in the springback amount in the same tight range. A given HBF and PD% combination was not necessarily the only one that would have provided the values for θ and ε in the specified ranges. However, by choosing the θ and ε ranges intentionally small, we guaranteed that the network would receive training data that was within a narrow window of possible HBF and PD% values. These 104 simulation runs provided the input-output pairs for the training data with four curve fitting polynomial
7
coefficients from the punch force trajectories serving as the inputs and the HBF and PD% representing the desired outputs.
Results Once the neural network was well trained, four t and µ combinations left out of the training set as well as four additional t and µ combinations not included in the previous range of t and µ values were “fedforward” in the network to predict HBF and PD% values for the stepped binder force trajectory following the procedure outlined in Fig. 3 and the previous section. The resulting springback angle, θ, and maximum strain, ε, from the process were then calculated. Table 1 shows the excellent results that were obtained for these eight cases. All of the springback angles and maximum strain values are within a range of 0.3°to 0.6°and 8% to 10% respectively. The ability of the neural network to provide HBF and PD% values to use when faced with large variations in t and µ demonstrates the potential of neural networks in this application. However, there are other parameters that vary during the process, which have a similar effect on final part shape. Material properties, for instance, have been shown to cause severe dimensional variations in sheet metal stampings (Kinsey and Cao, 1997). When the original trained network for was used to predict HBF and PD% values with different material properties, unacceptable levels of springback and maximum strain were produced. This is not surprising since the network was not trained to accommodate discrepancies in material properties. Therefore, additional training data incorporating material variations was required.
Deviations on the true stress-strain curve for the
nominal material, Material 1, were created by varying the strength coefficient, K, by ±10% (Materials 2 and 3) and ±20% (Materials 6 and 7) and the strain hardening component, n, by approximately ±16% (Materials 4 and 5). Seven combinations of t and µ (t = 0.9/µ = 0.04, t = 1.1/µ = 0.06, t = 1.4/µ = 0.08, t = 1.0/µ = 0.10, t = 0.8/µ = 0.12, t = 1.0/µ = 0.16, and t = 1.2/µ = 0.20) were chosen from which training examples with the new materials were created. Again through trial and error, 36 training examples with a given material, t, and µ combination were produced
8
that had the same ranges for θ and ε as were previously used, 0.4ο to 0.5ο and 8% to 10% respectively. One of the six new materials at each of the t and µ combinations, was left out of the training set to be used as a check to see if the neural network was able to predict accurate values of HBF and PD%. After these additional training examples with variations in material properties were added to the original training set, the network was retrained with the same neural network structure used previously. Table 2 shows the results when the cases from the six combinations that were left out of the training set and four new material thickness, t, and friction coefficient, µ, combinations were fedforward in the newly trained network. Once again, the neural network was able to provide values of HBF and PD% that produced acceptable levels of θ, 0.2°to 0.6°, and ε, 8% to 10%. However, these simulation outputs were not always within the narrow springback angle range of 0.3°to 0.6°as was obtained in the t and µ results. This indicates that the neural network has more difficulty generalizing over variations in material. As previously stated, the narrow range on θ during training was intentionally created to allow for reasonable discrepancies in the feedforward process. Furthermore, additional training sets or a more clever neural network structure, such as giving “hints” to the network about the material properties, could improve the ability of the neural network to handle variations in material properties.
Comparison of Results to Closed-loop Control
The control system proposed by Sunseri et al. (1996) utilized closed-loop control of the binder force to follow the punch force trajectory in order to control springback in the same channel forming process. Regarding the friction coefficient as possibly the most significant process parameter, the robustness of their control system was tested against variations in the friction coefficient, and excellent results were obtained. However, variations in the material properties and sheet thickness were not investigated in their work. Therefore, further closed-loop control simulations with these variations were conducted here in order to form a comparison with the neural network control system.
9
First, the punch force trajectory from our nominal case, Material 1, t of 1.0 mm, and µ of 0.10, was created. A Proportional plus Integral (PI) controller was used to adjust the binder force to allow for following of the nominal punch force trajectory, as was done in Sunseri et al. (1996).
The maximum punch displacement between
adjustments of the binder force was 0.02 mm. Listed in Table 3 are the proportional gains, kp, and the integral gains, ki, used by the controller for the three cases investigated. Figure 7 shows how well the punch force trajectory for these three cases (ki = 0.8 for Material 4) tracked the nominal punch force trajectory. Figure 8 shows how the binder force varied over the punch displacement to allow for following the nominal punch force trajectory (ki = 0.8 for Material 4). Note that the binder force trajectories level off at the end of the forming process similar to a stepped binder force trajectory. The θ and ε values from these closed-loop control experiments are also shown in Table 3 along with the results from the neural network control system. This table clearly indicates that the springback angle for the neural network control system was considerably less and closer to the original range of 0.4ο to 0.5ο for all three cases. Even for the case where the nominal t and µ values, 1.0 mm and 0.10 respectively, were used with Material 5, the neural network control system outperformed the closed-loop control system. Though a neural network system requires more up front work producing a sufficient number of examples to train the network, the benefits for controlling springback and maximum strain are undeniable. Also, there are additional benefits to the neural network control system over this closed-loop control strategy for this application. Note that the value of ki had to be adjusted for the Material 4 case in Table 3, compared to the cases for Materials 3 and 5, in order for the punch force trajectory to be followed accurately. That is, as the material and process parameters change, the gains necessary to follow a punch force trajectory closely may also change. Figure 7 also shows what would have been the actual punch force trajectory for the Material 4 case if the ki from the cases for Materials 3 and 5, 2.0, was used. Therefore, this closed-loop control system with pre-selected fixed gains is not robust when faced with large variations in process and material parameters. Furthermore, presses currently found in industry are capable of readily producing a stepped binder force trajectory, as is used in the neural network
10
control system, while following a continuously varying punch force trajectory would require a more vigorous control system.
Conclusions
In this paper, a neural network system, along with a stepped binder force trajectory, was proposed to control springback and maximum strain in a simulated Aluminum channel forming process. A neural network was chosen due to its ability to handle the highly non-linear coupled effects that are found in metal forming processes when variations in the material and process parameters occur. The punch force trajectory was identified as the process parameter that provides the greatest insight into deviations of various material and process variables. Therefore, polynomial coefficients from curve fitting of the punch force trajectory were used as inputs into the neural network. The results show that the neural network was successful at providing the high binder force (HBF) and punch location (PD%) values for the stepped binder force trajectory which produced acceptable values of springback (θ), 0.2°to 0.6°, and maximum strain (ε), 8% to 10%, in the final product when faced with variations in the material strength coefficient (K) of ±20%, the strain hardening exponent (n) of ±16%, the sheet thickness (t) of ±25%, and the friction coefficient (µ) of ±65%. Also when compared with the closed-loop control strategy proposed by Sunseri et al. (1996) for the same process, the neural network system was shown to be superior at minimizing springback in the presence of variations in material properties, as well as being a more robust system to implement if adequate training data is available. While this work was conducted using simulations, the methodology developed could be easily extended to an actual forming process or experiments, which will be conduct in the future to validate our claims. The only hardware requirements would be a CPU, the ability to measure punch force trajectory, and the ability to vary the binder force once during the process cycle. With this neural network control system in place, a sheet metal forming process would be robust to inevitable variations in material and process parameters; thus, creating consistent final part dimensions that are critical to downstream processes and customer satisfaction.
11
Acknowledgment
This research was funded in part by NSF grants #CMS-9622271 and #DMI9703249.
References
ABAQUS, 1997, User’s Manual, Theory Manual, Version 5.6, Hibbit, Karlsson, and Sorensen, Providence, Rhode Island. Ayres, R. A., 1984, “SHAPESET: A Process to Reduce Sidewall Curl Springback in High-Strength Steel Rails”, Journal of Applied Metalworking, Vol. 3, No. 2, pp. 127-34. Cho, S., Cho, Y., and Yoon, S., 1997, “Reliable Roll Force Prediction in Cold Mill Using Multiple Neural Networks”, IEEE Transactions on Neural Networks, Vol. 8, No. 4, pp. 874-82. Di, S. and Thomson, P. F., 1997, “Neural Network Approach for Prediction of Wrinkling Limit in Square Metal Sheet Under Diagonal Tension”, Journal of Testing and Evaluation, Vol. 25, pp. 74-81. Elkins, K. L., 1994, “On-Line Angle Control for Small Radius Air Bending”, Carnegie Mellon University, UMI Dissertation Services, Ph.D. Thesis. Forcellese, A., Gabrielli F., and Ruffini, R., 1997, “Springback Control in a Air Bending Process by Neural Network”, Submitted to Proc. III Convegno AITEM. Graf, A. and Hosford, W., 1993, “Plane-strain Tension Test of AL 2008-T4 Sheets”, Proceedings SAE Congress Symposium on Sheet Forming, Detroit, MI. Hishida, Y. and Wagoner, R., 1993, “Experimental Analysis of Blank Holding Force Control in Sheet Forming”, Journal of Materials and Manufacturing, Vol. 2, pp. 409-15. Hornik, K., Stinchcombe, M., and White, H., 1989, “Multilayer Feedforward Networks are Universal Approximators”, Neural Networks, Vol. 2, pp. 359-66. Kinsey, B., 1998, “Process Control in Sheet Metal Forming”, Master’s Thesis, Department of Mechanical Engineering, Northwestern University. Kinsey, B. and Cao, J., 1997, “An Experimental Study to Determine the Feasibility of
12
Implementing Process Control to Reduce Part Variation in a Stamping Plant”, Sheet Metal Stamping: Development Applications, SAE Paper 970713, SP-1221, pp. 107-12. Ruffini, R. and Cao, J., 1998, “Using Neural Network for Springback Minimization in a Channel Forming Process”, Developments in Sheet Metal Stamping, SAE Paper 98M154, SP-1322, pp. 77-85. Rumelhart, D.E. and McClelland, J.L., 1986, “Learning Internal Representation by Error Propagation,” Parallel Distributed Processing, MIT Press, Cambridge, MA, Vol. 1, Ch. 8. Sunseri, M., Cao, J., Karafillis, A. P., and Boyce, M. C., 1996, “Accommodation of Springback Error in Channel Forming Using Active Binder Force Control: Numerical Simulations and Results”, Journal of Engineering Materials And Technology, Vol. 118, No. 3, pp. 426-35. Widrow, B. and Lher, M.A., 1990, “30 Years of Adaptive Neural Networks: Perceptron, Madaline and Backpropagation”, Proceedings of the IEEE, Vol. 78, No. 9, pp. 1415-41. Yang M., Shima, S., and Watanabe, T., 1992, “Development of Control System Using Neural Network Combined with Deformation Model for an Intelligent V-Bending Process of Sheet Metals,” Proceedings of Japan/USA Symposium on Flexible Automation, ASME, Vol. 2, pp. 1485-90.
13
160 HBF
Binder Force (kN)
140 120 Process Stepped BF
100 80
CBF CBF
60
BF (kN) HBF = 142 kN, LBF = 16 kN 142 kN 16 kN
θ 0.41°
ε 9.2%
0.57° 15.0% 4.18° 8.0%
40 20
LBF %
0 0
5
10
PD%
15
20
Punch Displacement (mm)
91.6 mm
all radii 9 mm 19 mm
56°
14
Obtain four curve fitting coefficients of the punch force trajectory.
Continue Punch Displacement with HBF step at predicted location.
Use neural network to predict proper HBF and PD%.
8
16
7
14
6
12
5
10
4
8 springback max strain
3
6
2
4
1
2
0
0 160
0
20
40
60
80
100
Constant Binder Force (kN)
15
120
140
Max Strain (%)
Springback Angle (deg.)
Run process until 53% of Punch Displacement (10 mm).
80
Y-axis (mm)
70
θ 60
desired shape CBF = 16 kN CBF = 64 kN CBF = 128 kN
50
40 0
20
40
60
80
100
120
X-axis (mm)
4500 R e g io n A
4000
R e g io n B
µ = 0.20
Punch Force (N)
3500
µ = 0.16
t = 0.8 mm t = 1.0 mm t = 1.2 mm
3000 2500 2000
µ = 0.12
1500 1000 500 0 0
1
2
3
4
5
6
Punch Stroke (mm)
16
7
8
9
10
18 16
Punch Force (kN)
14 Target PF Trajectory Material 3 (ki = 2.0) Material 4 (ki = 0.8) Material 5 (ki = 2.0) Material 4 (ki = 2.0)
12 10 8 6 4 2 0
0
5
10 15 Punch Displacement (mm)
20
250
Binder Force (kN)
200 Material 3 (ki = 2.0) Material 4 (ki = 0.8) Material 5 (ki = 2.0) Material 4 (ki = 2.0)
150
100
50
0
0
5
10 15 Punch Displacement (mm)
17
20
Thickness (mm) 0.9 0.9 0.9 0.9 1.1 1.1 1.1 1.1
Material # 2 3 4 5 6 7 2 3 4 5
Mat’l # 3 4 5
Friction Coefficient 0.05 0.09 0.13 0.17 0.07 0.11 0.13 0.17
Thickness (mm) 0.9 1.1 1.4 1.0 0.8 1.0 0.9 1.1 0.9 1.1
Thickness (mm) 1.1 1.4 1.0
Friction Coefficient 0.06 0.08 0.10
Predicted HBF (kN) 169.65 90.73 59.54 43.51 144.00 89.30 75.02 53.69
Friction Coefficient 0.04 0.06 0.08 0.10 0.12 0.16 0.07 0.08 0.09 0.11
Predicted PD% 69.08 65.08 61.84 61.00 72.55 67.77 66.78 66.92
Predicted HBF (kN) 185.72 190.63 154.94 92.06 47.35 67.13 109.31 135.68 90.72 89.67
kp ki (N/N) (N/N) 10.0 10.0 10.0
Springback Angle (deg.) 0.35 0.36 0.49 0.52 0.47 0.50 0.39 0.59
Predicted PD% 67.83 75.68 79.45 67.33 57.08 65.46 66.17 73.03 65.08 67.81
Springback Angle (deg.) 0.59 0.38 0.56 0.29 0.20 0.28 0.23 0.54 0.42 0.30
Neural Network Springback Strain Angle (deg.) (%) 0.38 8.09 0.56 8.49 0.29 8.99
2.0 0.8 2.0
18
Max. Strain (%) 8.36 8.43 8.40 8.70 8.70 8.95 9.26 9.11
True Strain (%) 8.91 8.09 8.49 8.99 8.32 9.12 8.52 8.62 8.24 9.34
Closed-loop Springback Strain Angle (deg.) (%) 1.27 9.27 1.52 9.23 1.52 7.19
List of symbols
CBF:
Constant Binder Force (upper case letters)
LBF:
Low Binder Force (upper case letters)
HBF:
High Binder Force (upper case letters)
PD%:
Punch Displacement Percentage (upper case letters)
t:
Sheet Thickness (lower case letter)
µ:
Friction Coefficient (Greek lower case mu)
θ:
Springback Angle (Greek lower case theta)
ε:
Maximum Principal Strain (Greek lower case epsilon)
u:
Displacement of Node in Finite Element Model (lower case letter)
φ:
Angular Rotation of Node in Finite Element Model (Greek lower case phi)
E:
Young’s Modulus (upper case letter)
ν:
Poisson’s Ratio (Greek lower case nu)
σ:
True Stress (Greek lower case sigma)
K:
Material Strength Coefficient (upper case letter)
n:
Strain Hardening Exponent (lower case letter)
ki:
Integral Gain (lower case letters)
kp:
Proportional Gain (lower case letters)
19
List of Figures
Figure 1.
Stepped binder force trajectory.
Figure 2.
Channel forming geometry.
Figure 3.
Flowchart of proposed neural network control system.
Figure 4.
Springback angle and maximum strain versus constant binder force.
Figure 5.
Final part shape with increasing constant binder force.
Figure 6.
Punch force trajectory for 0 to 10 mm of punch travel.
Figure 7.
The target and actual punch force trajectories in close-loop control.
Figure 8.
Resulting binder force trajectories for closed-loop control following punch force trajectory.
List of Tables
Table 1.
Results of variation in thickness and friction coefficient.
Table 2.
Results of variation in material properties, thickness, and friction coefficient.
Table 3.
Comparison of results from neural network and closed-loop control systems.
20