Turkish Journal of Electrical Engineering & Computer Sciences http://journals.tubitak.gov.tr/elektrik/
Research Article
Turk J Elec Eng & Comp Sci (2018) 26: 3239 – 3257 © TÜBİTAK doi:10.3906/elk-1803-14
Constrained multiobjective PSO and T-S fuzzy models for predictive control Ali THAMALLAH∗,, Anis SAKLY,, Faouzi M’SAHLI, Department of Electrical Engineering, School of Engineering, Monastir, Tunisia Received: 02.03.2018
•
Accepted/Published Online: 26.08.2018
•
Final Version: 29.11.2018
Abstract: Multiobjective optimization problems are still a challenging area in the field of control system engineering. In this context, the current study describes a new multivariable predictive control scheme formulated by using the T-S fuzzy modeling method and a new constrained multiobjective PSO algorithm. The T-S fuzzy modeling technique is applied to forecast the behaviors of the nonlinear system. It also aims at establishing some conditions so that the proposed control loop is asymptotically stable. The obtained experimental results show that the combination of the philosophy of the T-S fuzzy model and multiobjective PSO is very good in the controlling of nonlinear multivariable processes. The satisfactory tracking results with small values of MRE demonstrate the proof of capability of the proposed algorithm and the accuracy of the T-S modeling approach. Meanwhile, experimental results show that, compared with the ones obtained with standard MPC, the proposed method is of high effectiveness in term of the control increments optimization and the errors in the presence of disturbances. Key words: Multiobjective PSO algorithm, nonlinear system, model predictive control, T-S fuzzy modeling approach, quadruple-tank process
1. Introduction Model predictive control (MPC) has been thoroughly applied in the field of controlling industrial processes, thanks to its ability to deal with control difficulties such as hard nonlinearity, constrained variables, large delay time, and undertrained variables [1]. According to MPC strategy, the generating of the control actions is established by minimizing a cost function, which uses an internal process model to forecast the behavior of the system over the prediction horizon HP [2]. Although MPC was widely studied [1–6], this control technique is still an open field in the area of the constrained control problems typical with nonlinear multivariable systems. In a similar vein, some works have employed distributed model predictive control (DMPC) to handle nonlinear multiinput, multioutput (MIMO) system problems [7]. To deal with the complexity of nonlinear multivariable processes, recent studies have employed the decomposition of MIMO systems into several SISO subsystems based on partial least squares (PLS). However, the application of decentralized or decomposition techniques in MPC needs to eliminate the couplings between the different variables; thus, the MIMO system can be controlled as a set of decoupled single input and single output (SISO). Despite the fact that these techniques have simpler structures, they are confined to controlling multivariable processes, which are characterized by negligible interactions between variables. However, most real processes have strong coupling. In order to tackle the nonlinearity and the coupling problems typically seen in MIMO systems, some works have designed multivariable predictive controllers based on advanced techniques of modeling and optimization [1, 5, 6]. Various ∗ Correspondence:
[email protected]
3239 This work is licensed under a Creative Commons Attribution 4.0 International License.
THAMALLAH et al/Turk J Elec Eng & Comp Sci
studies, aimed at solving nonlinear problems, have employing artificial neural networks (ANNs), in which the prediction stage is based on ANNs [5]. In this context, there are recent studies that have employed Volterra models in multivariable MPC to control a nonlinear MIMO system [6]. However, the use of advanced modeling techniques causes difficulties and impairs the tuning of the control actions in MPC because the quadratic criterion becomes a nonlinear optimization problem [6]. In addition, the design of multivariable predictive controllers requires the specification of synthesis parameters (prediction horizons, control horizons, and cost weighting factors) and closed loop performances (overshoots, rise, and settling time). In this case, the objective function of MPC can be truly treated as multivariable multiobjective optimization problems in order to achieve satisfactory performances [7, 8]. In order to solve the problem, there have been various methods in the literature [5, 7], which are based on the weighted sum method (WSM) to address the matter in multiobjective optimization problems. One of the main advantages of the WSM is to replace multiobjective optimization problems with a single objective function. The single objective function of the WSM is obtained by the sum of the weighted summation. This method requires the determination of an adequate value of the weights, but there is no exact technique to tune the weighting factors. Despite the fact that the WSM makes the task of optimization easier, the solution is calculated in favor of some criteria or one against the others. Consequently, closed-loop performances of MPC may be significantly decreased since some criteria are favored. From such a perspective, the objective function of MPC can be seen as a weighted sum of two quadratic criteria. The first one is the quadratic sum of errors between the predicted outputs and the sequence of the set points along finite Hp . The second criterion represents the future increments of the control actions over a suitable HC [2]. Despite the fact that the syntheses of the parameters of MPC have been thoroughly studied [4, 7, 8], there are no general methods that allow the determination of the cost weighting factors. On the other hand, even with automatic tuning the values of cost weighting factors may be tuned in favor of some criteria against others, typically with a nonlinear optimization function. In addition, the control of real systems is characterized by the presence of constraints, which make the task of multiobjective optimization more difficult. In the context of optimization problems, various evolutionary computation approaches have been developed in the past two decades [9, 10]. In the field of evolutionary multiobjective optimization, there exist Pareto-based approaches and other techniques [11]. One of the popular evolutionary optimization algorithm is particle swarm optimization (PSO), which has been constantly developing since its appearance in 1995 [12]. Nowadays, thanks to the easy coding and implementation of PSO, various versions of PSO have been employed in different areas of research, such as machine control [13] and fault diagnosis [14]. However, for a large range of industrial actuators, it is often necessary to respect some constraints on control and its increments [15]. Therefore, the presence of constraints complicates the process of multiobjective optimization algorithms [9]. In an attempt to overcome the problems of weight factor determination and the constraints in MPC, the present work develops a new constrained multiobjective PSO algorithm, which is applied to calculate the optimal predictive control of a nonlinear MIMO system. The control actions are obtained by simultaneously minimizing the two separated criteria of MPC without the determination of weighting factors. In the modeling stage, the proposed strategy uses the T-S fuzzy modeling method in order to predict the outputs of the nonlinear MIMO system and to formulate stability conditions of the closed loop. Consequently, the minimizing simultaneously of the two proposed objective functions allows to obtain control laws with small increments. This highlights the importance of the proposal method to prevent the aggressive control and to provide a progressive control law for a nonlinear system manipulated under hard constraints and stability conditions. The organization of the paper is as follows. Section 2 revisits the predictive control problem of nonlinear 3240
THAMALLAH et al/Turk J Elec Eng & Comp Sci
system. The T-S modeling approach is presented in Section 3. Details of the new constrained multiobjective PSO algorithm are outlined in Section 4. Section 5 presents experimental and simulation tests of the application of the proposed method in controlling the quadruple-tank process. Finally, a summary of the developed method and concluding remarks are given in the final section. 2. Problem formulation 2.1. Description of nonlinear MIMO system The present paper focuses on the study of a nonlinear MIMO system characterized by m inputs and p outputs, which is represented by the following state equations: { ˙ t ) = f ( X( t ) ) + B( X( t ) ) U ( t ) X( Y ( t ) = g( X( t ) ) + B( t ) U ( t ),
(1)
where X ∈ Rn denotes the state vector and Y is the p-dimensional output vector, representing the input vector. f ( X( t ) ) , B( X( t ) ) , g( X ( t ) ) , and D( X( t ) ) are nonlinear vectors with appropriate dimensions [16]. 2.2. Proposed predictive controller In the MPC scheme, the control action is determined by minimizing a performance criterion (2). The minimizing procedure is realized repeatedly at each time step over the prediction horizon Hp . According to the idea of MPC [2], the predictive control actions of the MIMO system are given by minimizing the following criterion:
JM P C =
p ∑ HP ∑
( yci ( k + j ) − ybi ( k + j/k ) )2 +
i=1 j=1
m ∑ i=1
λ
H∑ C −1
∆ui ( k + j )2 ,
(2)
j=1
with yci ( k + j ) denoting the future set points, ybi ( k + j/k ) corresponding to the predicted outputs at time step k + j obtained by a model taking into account the effect of the future control action, and λ representing weighting factors of control increments ∆ui . The parameters HP and HC represent respectively the prediction horizon and the control horizon. The MPC technique has been the focus of several studies and there are various tuning methods for the MPC parameters [17]. However, most specialized literature presents a different method to adjust weighting factors λ in such way to obtain the desired performance and robustness [17, 18]. It is evident that the parameters HP and HC , as well as the weighting factors, all have an effect on the closed-loop performance of the system. This may explain why the synthesis and the tuning of MPC parameters is still an open area of research. In addition to the tuning task of MPC parameters, the control of a real process requires the presence of some constraints. Generally, the constraints are presented as follows: umin ⩽ ui ( k + j ) ⩽ umax ∆umin ⩽ ∆ui ( k + j ) ⩽ ∆umax ymin ⩽ yh ( k + j ) ⩽ ymax
∀i ∈ [ 0 m ] and ∀h ∈ [ 0 p ].
(3)
The closed-loop stability is another property that must be considered in the controlling system, making the optimization of the MPC criteria difficult. In this context, Bemporad and Muñoz de la Peña proposed a multiobjective MPC scheme that takes into account stability conditions based on a standard terminal region/terminal region constraint approach [19]. In the same way, Zavala and Flores-Tlacuahuac proposed an efficient method, 3241
THAMALLAH et al/Turk J Elec Eng & Comp Sci
in which the control action is established by minimizing multiobjective optimization problems under stabilizing conditions based on Lyapunov functions [20]. In general, the stability analysis is still a hard task in the design of a controller, especially those that are based on advanced techniques such as MPC [19]. It is clear from previous studies that there are no general methods that can be automatically applied to adjust the MPC parameters and to provide closed-loop stability of the predictive controller. Accounting for the latter considerations and in order to avoid the tuning task of weighting factors, the current paper presents a new MPC scheme in which the control actions are calculated by simultaneously minimizing two separate criteria without taking into account the value of weighting factors. The first one is the sum quadratic of the differences between the desired references and the predicted outputs. The second criterion is the sum quadratic of the incremental control. Under these conditions, the predictive control actions are established by minimizing the following criterion: JM P C1 =
p ∑ HP ∑
( yci ( k + j ) − ybi ( k + j/k ) )2 and JM P C2 =
i=1 j=1
m ∑
λ
i=1
H∑ C −1
∆ui ( k + j )2 .
(4)
j=1
In order to deal with the aforementioned problems, the current paper presents a new MPC scheme, which can be applied to control a nonlinear MIMO process. The proposed method integrates the T-S fuzzy modeling approach and a new multiobjective PSO algorithm. The T-S fuzzy models have been used for two reasons: first, they predict the behavior of the nonlinear MIMO system such as the quadruple-tank process. Second, they allow to study the closed-loop stability of the proposed method. However, the developed PSO algorithm has been employed to efficiently search for the Pareto optimal solutions of the multiobjective optimization problems defined by Eq. (4), taking into account the stability conditions and constraints expressed in Eq. (3). 3. T-S fuzzy models In recent years, the T-S fuzzy modeling approach has become one of the successful techniques used in all fields of control theory [4, 16, 21]. Based on the work of Takagi and Sugeno [22], the fuzzy rules of a discrete T-S fuzzy system (DFS) can be written as follows: Rule Ri : If z1 (k) is F1i … and znm ( k ) is F1nm Then
{
X( k + 1 ) = Ai X( k ) + Bi U ( k ) Y (k ) = Ci X( k )
∀i ∈ [ 1 r ],
where z1 ( k ), …, znm ( k ) represent the premise variables, Fji corresponds to the fuzzy set for j = 1, …, r , X( k ) is the state vector, U ( k ) is the control vector, Y ( k ) is the output, and r is the rule number. The fuzzy matrices Ai ∈ Rn∗n , Bi ∈ Rn∗m , and Ci ∈ Rp∗n define the relationship between U ( k ) , Y ( k ) , and X( k ). In this work, the defuzzification is realized by using the center of gravity method [16]. Under this condition, the T-S fuzzy models are inferred as: X( k + 1 ) =
r ∑
hi ( z( k ) )( Ai X( k ) + Bi U ( k ) ) and Y ( k ) =
i=1
with hi (z( k )) =
∑rwi ( z( k ) ) i=1 wi ( z( k ) )
r ∑
hi ( z( k ) )Ci X( k ),
(5)
i=1
as the activation degree and wi ( z( k ) ) =
∏nm i=1
Fji ( zj ( k ) ) . The activation
degree is designed by calculating the values of the membership functions during the inference process. In the framework of this research, convex polytopic transformation has been used to obtain the T-S models [16]. This approach is interested in the nonlinear state equation presented in Eq. (1), which contains 3242
THAMALLAH et al/Turk J Elec Eng & Comp Sci
nonlinear bounded coefficients fi ( t, X, U ) over [ ab ] . The approach allows to present nonlinear function fi ( t, X, U ) by fi ( t, X, U ) = F 1 ( t, X, U )α + F 2 ( t, X, U )β , where F j ( t, X, U ) are two functions such as F j ( t, X, U ) : [ a, b ] → [ 0, 1 ], j ∈ { 1, 2 } and F 1 ( t, X, U ) + F 2 ( t, X, U ) = 1 . In general, any bounded function fi ( t, X, U ) has a maximum fmax and a minimum fmin . Consequently, F 1 ( ) and F 2 ( ) can be expressed as: f ( ) − fmin fmax − f ( ) F 1 ( t, X, U ) = and F 2 ( t, X, U ) = . (6) fmax − fmin fmax − fmin In this case, α and β can be chosen as fmax and fmax , respectively. Then the construction of T-S fuzzy models of fi ( t, X, U ) are established based on two fuzzy rules, which are presented as follows: • R1 : IF X( t ) is F 1 ( t, X, U ) THEN fi ( t, X, U ) = α • R2 : IF X( t ) is F 2 ( t, X, U ) THEN fi ( t, X, U ) = β The number rules are dependent on the number nf of function fi ( t, X, U ). If there exists nf nonlinear function fi (t, X, U ) , then the number rule is equal to r = 2nf . In this paper, the conditions of closed-loop stability are established with respect to Koteliansky’s method [23]. In order to simplify the stability conditions and to minimize the computation time, the stability study focuses on the first term of the control action sequence since it is actually applied to the system; on the contrary, the other shall be discarded. In order to provide the stability conditions of the closed loop of the developed MPC method, the following assumptions are considered in this paper. Assumption 1 For all time steps k , there exists a linear feedback U (k) = LX such as that Eq. (5) can be written as follows: X( k + 1 ) =
r ∑
hi Gi X( k ) with Gi = Ai + Bi L.
(7)
i=1
Assumption 2 There exists a globally Lipschitz diffeomorphism ϕ : Rn → Rn that transforms Eq. (7) into the following relation [23]: Z( k + 1 ) =
r ∑
hzi Gzi Z( k ),
(8)
i=1
where Z represents the new state vector and Gzi are upper triangular matrices [23]. Assumption 3 There exists an overvaluing upper triangular matrix M ( U ( k ) ) ∈: Rn∗n of all Gzi and a vector norm P () : R+ → R+ for the system expressed in Eq. (8) such as: P ( Z( k + 1 )) ⩽ M (U ( k ))Z( k ).
(9)
If the three aforementioned assumptions are satisfactorily met, then the T-S fuzzy system in closed loop with the MPC scheme based on the proposed multiobjective PSO algorithm is stable if: mii (U (k))Z(k) ⩽ 1 ∀ ∈ [ 1 n ],
(10)
with mii the diagonal elements of M () 3243
THAMALLAH et al/Turk J Elec Eng & Comp Sci
Proof
The matrix M () is an overvaluing matrix of Assumption (3); thus, the application of the Koteliansky
conditions to matrix I − M allows the conclusion of stability if the successive main minors of I − M are all positive [23]. Since M () is an upper triangular matrix, the stability conditions applied to the successive main minors of I − M can be written as in Eq. (10).
2
4. The developed multiobjective PSO Thanks to its ability to efficiently find solutions adapted to different complex optimization problems, many researchers have been interested in PSO in such way as to extend it to solve multiobjective optimization problems [11]. Multiobjective optimization consists of solving simultaneously two or more conflicting objectives. With regard to multiobjective optimization problems, Pareto defined an optimality concept that allows finding the set optimal trade-off solutions [9]. These solutions are known as the Pareto optimal set (referred to as the Pareto front). In the multiobjective optimization framework, some works have demonstrated the ability of genetic algorithms (GAs), particle swarm optimization (PSO), and evolutionary algorithms (EAs) to deal with this type of problem. The versions of PSO extended to solve multiobjective problems are classified according to the techniques employed: Pareto-based approaches, aggregating approaches, lexicographic ordering, subpopulation approaches, and hybrid approaches [11]. In the current paper, the proposed algorithm is based on the employment of two nested loops, which use two counter variables, pk ∈ { 1, .., Mf } and pj ∈ { 1, .., Ns }, with Mf and Ns representing respectively the maximum iteration and the number of the objectives. The outer loop takes control of the repetition of the optimization process by incrementing its counter variable pk ∈ { 1, .., Mf }. However, the inner loop, characterized by the counter variable, pj ∈ { 1, .., Ns } , is required for the optimization process to find solutions accordingly with the concept of Pareto optimality. In the proposed solver, at each iteration pj only one of the objective functions of the problem is optimized. At each iteration pk , the variable pj moves from 1 to Ns . At each new iteration pj , the selection of the local best position P bestpi ( pk + pj ) and the global best position P gbestpi ( pk + pj ) of the particle Ppi ( pk + pj ) pi ∈ { 1, .., Np } is calculated only in the fitness values of the objective pj . Then the update of the velocity and the position of the particle Ppi (pk+pj) are established by Eqs. (12) and (13), respectively. At this stage, the optimization procedure keeps the new position Ppi (pk + (pj + 1)) only when it dominates its previous position Ppi (pk + pj) and respects the constraints on the state variable. At the next iteration pk +(pj +1) of the inner loop, the new positions Ppi ( pk +( pj +1 ) ) are employed to minimize the objective ( pj +1 ) and to tune the new variables P bestpi ( pk+( pj +1 ) ) and P gbestpi ( pk+( pj +1 ) ) , which are used to calculate the new position. The optimization process continues until the last objective function; then the process increments the counter variable pk of the outer loop and restarts with the first objective function for j = 1 and repeats the optimization steps until the end of iterations. Therefore, the total number of iterations is proportional to the number of objective functions. At the end of iteration, the algorithm provides Np solutions of the problem. The optimization process retains only the solutions that form the Pareto front. Then, the final solution is chosen among the Pareto front in terms of the fitness valueJM P C1 . In order to respect the constraints on the controls and its increments, the developed algorithm integrates the parameters ∆Ppi ( pk + pj ) , which measure the increment of particle Ppi ( pk + pj ) at each iteration pk + pj . The expression of ∆Ppi ( pk + pj ) is given by: ∆Ppi ( pk + pj ) =
pk+pj ∑ ph=1
3244
Vpi ( ph ),
(11)
THAMALLAH et al/Turk J Elec Eng & Comp Sci
with the velocity Vpi of the particle Ppi based on the following formulation: Vpi ( pk + ( pj + 1 ) ) = wVpi ( pk + pj ) + c∗1 r1 (P bestpi ( pk + pj ) − Ppi ( pk + pj ) ) + c∗2 r2 (P gbestpi ( pk + pj ) − Ppi ( pk + pj ) ),
(12)
where c∗1 and c∗2 are positive constants, which define the learning factors of the velocity. The parameters r1 and r2 are random values distributed in the interval from 0 to 1 . The inertia weight w has been used in order to ameliorate the convergence of the algorithm.
with
) − ∆U P f easiblepi ( k + pj ) U ( k { Ppi ( pk + ( pj + 1 ) ) = max Vpi ( pk + ( pj + 1 ) ) + Ppi ( pk + pj ) min U (k) + ∆U P f easiblepi ( k + pj ),
(13)
∆Umin { (k) ∆U P f easiblepi ( k + pj ) = max ∆Umax ( k ) min ∆Ppi ( pk + pj ).
(14)
∆Umin ( k ) and ∆Umax ( k ) represent the dynamic limits of the increments, which are initialized, taking into account the constraints and stability conditions by the proposed algorithm at each new time step k . The proposed algorithm is evaluated by a number of significant test problems. The standardization of the test problems was proposed for the first time by Deb et al. [24] in order to correctly evaluate the performances of an algorithm in the area of multiobjective optimization [24]. In the current paper, for the sake of comparison of the developed algorithm to the nondominated sorting genetic algorithm II (NSGA-II) [24], three test problems (SCH, FON, and KUR) have been chosen from the benchmark tests proposed in this field [24]]. The different characteristics of the test problems such as the Pareto-optimal front, its nature, the number of variables, their bounds, and constraints were presented in [24]. For NSGA-II, the crossover probability and the mutation probability are fixed at 20 and 20 . The performances of multiobjective algorithms are assessed according to the convergence to the Pareto-optimal front and the computational time. Each test was repeated ten times in order to measure the maximum T max , minimum T min and the average T ave values of the computational time. To measure the convergence of the solutions, the average of Euclidean distances Υ between the obtained nondominated solutions and the Pareto-optimal front of the problems is calculated [24]. The results of comparison between the proposed PSO and NSGA-II are presented in Table 1. The values of Υ and the computation time are obtained at the end of 250 iterations for both algorithms. The initial population size is equal to 100, which has randomly been created. The results in term of Υ show that the performance of NSGA-II is better for all test problems, except in SCH’s problem, where the convergence obtained by the proposed algorithm is very close to those of NSGA-II. It is clear that the capability of NSGA-II to find nondominated solutions with a good convergence is due to its selection mechanism, which is based on the crowded-comparison operator. However, the time metrics show that the proposed PSO has the smallest computation time in all tests. Therefore, the simplicity of the proposed algorithm and its performance in terms of computational time nominate the latter as an interesting candidate that can be used to solve a multiobjective optimization problem in the field of control systems. 3245
THAMALLAH et al/Turk J Elec Eng & Comp Sci
Algorithm: The proposed PSO algorithm. 1. Acquire the control vector U (k) of the previous time step k 2. For each particle do (a) Initialize the position Ppi (b) Initialize the velocity Vpi (c) Initialize ∆Umin (k) and ∆Umax ( k ) taking into account U ( k ) , stability conditions, and constraints on the controls and its increments 3. For each iteration pk do (a) For each iteration pj do i. for each particle Ppi ( pk + pj ) , update the value P bestpi ( pk + pj ) in the fitness values of the objective pj ii. for each particle Ppi ( pk + pj ) , update the value P gbestpi ( pk + pj ) in the fitness values of the objective pj iii. Update the velocity Vpi ( pk + ( pj + 1 ) ) of each particle Ppi ( pk + pj ) iv. Update the ∆Ppi ( pk + pj ) v. Tune the ∆P f easiblepi ( pk + pj ) vi. Tune the new position Ppi ( pk + ( pj + 1 ) ) of each particle Ppi ( pk + pj ) according to Eq. (13) vii. Keep the new position Ppi ( pk + ( pj + 1 ) ) if it is the Pareto optimal solution and respect the constraints on the outputs variables viii. Increment pj and return to Step (a.i) while maximum iteration Ns is not attained (b) Increment pk and return to Step (3.a) while maximum iteration is not attained 4. Select the final solution U ( k + 1 )
Table 1. The metrics Υ (first row), T max( s ) (second row), T min( s ) (third row), and T ave( s ) (fourth row).
Metrics Υ T min(s) T max(s) T ave(s)
Proposed PSO SCH FON KUR 0.000389 0.0248 0.723 1.2872 0.932 1.1743 1.6890 1.185 1.7020 1.3664 1.096 1.2484
SCH 0.000341 2.301 4.2975 3.0536
NSGA-II FON 0.001301 2.207 2.7264 2.4575
KUR 0.0325 2.26 2.9508 2.51
Table 2. Results in terms of M RE and M CT of simulation and experimental tests.
Tests Simulation test Experimental test
3246
M RE1 0.0261 0.0479
M RE1 0.0237 0.0436
M CT 0.102 0.247
THAMALLAH et al/Turk J Elec Eng & Comp Sci
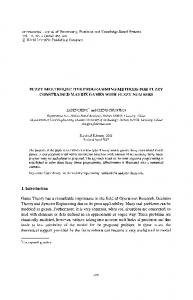
5. Application of the proposed MPC method In this section, the performance of the proposed MPC scheme and the developed multiobjective PSO algorithm have been evaluated by carrying out the simulation and experimental tests aimed to control liquid levels of a quadruple-tank process [25]. The first part is devoted to presenting the quadruple-tank process and the experimental setup. The second part is dedicated to respectively presenting the simulation and experimental results of the proposed method. 5.1. Quadruple-tank process The quadruple-tank process, given in Figure 1, consists of a liquid basin, four tanks, and two pumps. The main goal of the proposed method is to adjust the liquid levels in Tank 1 and Tank 2 by controlling the voltages applied to Pump 1 and Pump 2. Pump 1 provides respectively to feed Tank 1 and Tank 4. However, Pump 2 is used to fill water in Tank 2 and Tank 3. The outflows of Tank 3 and Tank 4 come in feed respectively to Tank 1 and Tank 2. The outflows of Tank 1 and Tank 2 are discharged into the liquid reservoir. The dynamic equation of the considered quadruple-tank process is expressed as follows:
Tank 4
Tank 3
Tank 1
Tank 2
Pump 2
Pump 1
u2
u1
Figure 1. Experimental quadruple-tank process: (A) Pump 1; (B) Pump 2;(C) liquid level sensors for Tank 1 and Tank 2; (D) liquid level sensors for Tank 3 and Tank 4; (E) Tank 1; (F) Tank 2; (G) Tank 3; (H) Tank 4; (I) liquid reservoir; (J) interface card; (K) USB cable; (L) power card; (M) ± 26 V supply voltage; (N) PC.
y˙1 y˙ 2 y˙3 y˙4 with c1 =
S1 √ CS1 2g ,
c2 =
S3 √ CS1 2g ,
= = = =
c3 =
√ √ −c1 y1 + c2 y2 + c3 u1 √ √ −c4 y2 + c5 y4 + c6 u2 √ −c7 y3 + c8 u2 √ −c9 y4 + c10 u1 , γ1 k1 CS1
, c4 =
S2 √ CS2 2g ,
c5 =
(15)
S4 √ CS2 2g ,
c6 =
γ2 k2 CS2
, c7 =
S3 √ CS3 2g ,
3247
THAMALLAH et al/Turk J Elec Eng & Comp Sci
c8 =
(1−γ2 )k2 CS3
, c9 =
S4 √ CS4 2g ,
and c10 =
(1−γ1 )k1 CS4
. U = [u1 u2 ]T is the control vector , with u1 and u2
respectively the voltages applied to Pump 1 and Pump 2. The state vector is X = [y1 y2 y3 y4 ]T , with yi the water level of Tank i . The controlled output vector Y = [ y1 y2 ]T is composed of levels in lower Tanks 1 and 2. CSi represents the cross-sectional area of Tank i, and Si corresponds to the cross-sectional area of the outlet hole. The parameters γ1 and γ2 are constant values determined from how the valves are set prior to an experiment. The constant g represents the acceleration of gravity. As the cross-sectional areas of the four tanks are equal, it is possible to define the relationship between c2 = c7 and c5 = c9 . Experimental values are given as c1 = 0.049 , c2 = 0.042, c3 = 0.0098, c4 = 0.034, c5 = 0.042, c6 = 0.0093 , c8 = 0.0041 , and c10 = 0.0039 . With regard to the experimental setup shown in Figure 1, the control law must take into account several physical constraints. On the one hand, the discharge pipes and the bottom orifices of each tank are installed so that the liquid levels do not reach 0 cm. Furthermore, the maximum level of each tank must not exceed 20 cm. On the other hand, the pumps installed in the system are driven by DC motors, which are characterized by some practical problems such as dead zone and saturation nonlinearity. For the present experimental system, the dead zone nonlinearity of DC motor-pumps is given for ui ∈ [ 0 6 ] . In order to avoid the nonlinear effects of dead zone nonlinearity, umin is fixed at 6 V. The maximum voltage umax applied to the DC motor-pumps is equal to 24 V. The constraints on increments of the controls are fixed at 10 V and –10 V. The minimum ymin and the maximum ymax liquid levels in the four tanks are respectively 1 cm and 20 cm. In this work, the construction of DFS is obtained after the determination of the continuous T-S fuzzy system (CFS). In order to obtain the CFS of the quadruple-tank process, the nonlinearity terms of the state equation, √ Eq. (15), have been transformed into nonlinear functions by substituting the square root functions y i with √ fi ( yi ) = √1y y i . Under this condition, Eq. (15) can be written as: i
c3 −c1 f1 ( y1 ) 0 c2 f3 ( y3 ) 0 0 0 −c f ( y ) 0 c f ( y ) 4 2 2 5 4 4 + X˙ = 0 0 0 −c7 f3 ( y3 ) 0 0 0 0 −c9 f4 ( y4 ) c10
0 c6 U. c8 0
(16)
Since all liquid levels in the four tanks are limited by ymin and ymax , the nonlinear terms fi ( yi ) are bounded functions fmin ⩽ fi ( yi ) ⩽ fmax . An evident decomposition of fi ( yi ) is to be considered over [ 0.8 22 ] : fi ( yi ) = Fi1 ( yi )fmax + Fi2 ( yi )fmin , with fmin = fi (22) and fmax = fi (0.8). Fi1 ( yi ) and Fi2 ( yi ) are the fuzzy memberships described as in Eq. (6). Figure 2 shows the graphs of the Fi1 ( yi ) and Fi2 ( yi ) . On the assumption that fi ( yi ) are continuous and bounded, based on convex polytopic transformation of the system Eq. (16) can be transformed as a CFS characterized by 16 fuzzy rules. Based on aggregation techniques, it is possible to obtain the DFS of the quadruple-tank process by discretization of thr CFS using zero-order hold with sample time Ts equal to 1 s [26]. Finally, the DFS is expressed as in Eq. (5). In order to evaluate the developed DFS, an experimental open loop test was carried out. A sequence of variable control actions has been applied at the same time to the real system and the developed DFS. Figure ?? shows the open loop response of the system and the T-S fuzzy model. The number of steps for the proposed test is fixed at 350. The root mean square errors ( RM SE ) between levels y1 and y2 of the system and the outputs yˆ1 and yˆ1 of the T-S fuzzy model are respectively 0.683 and 0.477, which were obtained using Eq. (17). The values of RM SE and open loop results reported in Figure ?? present proof of the capability of the T-S fuzzy model to predict the outputs of the quadruple-tank process: 3248
Level of Tank 1
1
15 10 ^ y 1 y1
5 0
0
50
100
150
F 1j (y j ) 0.5
0
F 2j (y j )
0
5
10 yj (cm)
15
20
Figure 2. The fuzzy memberships Fj1 ( yj ) and Fj2 ( yj ) .
√ RM SIi =
200
250
300
350
Time (s)
Level of Tank 2
Fuzzy memberships
THAMALLAH et al/Turk J Elec Eng & Comp Sci
∑350 k=1
15 10 ^ y2 y2
5 0
0
50
100
150 200 Time (s)
250
300
350
Figure 3. Evolutions of T-S outputs yˆi and real system outputs yi with i ∈ { 1, 2 } .
(yi (k) − yˆi (k))2 with i ∈ {1, 2}. 350
(17)
Taking into account constraints on liquid levels, it is possible to choose the feedback matrix, at each time step k , as follows: ] [ 0 0 0 uy41 . (18) L= 0 0 uy32 0 In order to provide the stability condition, the vector norm p(X(t)) and the upper triangular matrix M () ∈ Rn∗n are expressed as in Eq. (20):
y1 y2 p( X( t ) ) = y3 and M () = y4
a11 0 0 0
0 a22 0 0
b12 u2 y3 b22 u2 y3 b32 u2 y3 + a24
a12 +
0
b11 u1 y4 a24 + b21y4u1
0 b41 u1 y4 + a44
,
(19)
with a11 = 0.98 , a12 = 0.12 , a22 = 0.99 , a24 = 0.12 , a33 = 0.98 , a44 = 0.98 , b11 = 0.009 , b12 = 0.0005, b21 = 0.0005, b22 = 0.0088, b32 = 0.0018, and b41 = 0.0017 . A simple computation based on fuzzy matrices shows that the vector norm p() and the matrix M () given by Eq. (19) verified Assumptions 1, 2, and 3. Thus, based on Koteliansky’s method, the stability conditions can be expressed by the following expressions: u1 ≤
y4 (1 − a44 ) y3 (1 − a33 ) and u2 ≤ . b41 b32
(20)
5.2. Simulation and experimental results The primary aim of this section is to evaluate the proposed MPC scheme in terms of adjusting the liquid levels y1 and y2 of the quadruple-tank process. The predicted outputs and the stability conditions are calculated based on the DFS. The new constrained multiobjective PSO algorithm presented in Section 4 is applied to elaborate the suitable output actions U by solving the multiobjective problem of Eq.(4) with Hp = 5 and Hc = 3 . The simulation tests of the proposed strategy control are carried out using MATLAB 7. The T-S model and 3249
THAMALLAH et al/Turk J Elec Eng & Comp Sci
the proposed PSO algorithm have been implemented by using the MATLAB programming language and the MATLAB/Simulink environment. In what follows, the number of objective functions Ns , the population size, and the maximum value of the iteration number for the outer loop are fixed, respectively, to 2, 5, and 78. The experimental setup shown in Figure 1 consists of the real quadruple-tank process, PC with Intel Core7 3.75 GHz processor, interface card based on ATmega328 microcontroller that operates at 20 MHz, a power card, and ± 26 V supply voltage. The experimental tests have been performed by implementing in real time the
u1 and u2 (V)
Level of Tank 2 (cm)
Level of Tank 1 (cm)
developed MPC in the MATLAB/Simulink environment. y1 y c1
15 10 5 0
0
1000
2000
3000
4000
5000
6000
7000
8000 y2 yc2
15 10 5 0
0
1000
2000
3000
4000
5000
6000
7000
8000
9000 u1 u2
20 10 0
0
1000
2000
3000
4000
5000
6000
7000
8000
10 Increments (V)
9000
9000 ∆ u1 ∆ u2
5 0 -5 -10 0
1000
2000
3000
4000
5000
6000
7000
8000
9000
Time(s)
Figure 4. Simulation results of outputs yi and evolutions of control actions ui and its increments ∆ui with i ∈ { 1, 2 } .
In order to evaluate the proposed scheme control, a first set of experimental and simulation tests were carried out. Figure 4 shows the simulation results of the first test. The results of the first experimental validation are illustrated in Figure 5. In addition, Table 2 presents the measurement of the mean relative error ( M RE ) of the two liquid levels y1 and y2 and mean computation time ( M CT ). The values of M RE are calculated according to Eq. (21): ∑9000 M REi =
k=1
|yci (k) − yi (k)| . 9000
(21)
The simulation and experimental results reported in Figures 4 and 5 and the results in terms of M RE illustrate the ability of the proposed method to deal with the control problem of nonlinear MIMO systems. The errors between the references and the outputs, despite overshoots during the initial moments, are always 3250
THAMALLAH et al/Turk J Elec Eng & Comp Sci
Table 3. Comparison results.
Proposed method 0.0452 0.0389 30 28 0.255 0.248
u1 and u2 (V)
Level of Tank 2 (cm)
Level of Tank 1 (cm)
M RE1 M RE2 D1 % D2 % RM SI1 RM SI2
PID 1.68 0.87 1 0.3 5.3 4.7
Single objective method (λ1 ) 0.084 0.0692 23 26 3.2 3.58
Single objective method (λ2 ) 2.112 1.842 40 45 0.284 0.236 y1 yc1
15 10 5 0
0
1000
2000
3000
4000
5000
6000
7000
8000
9000 y2 yc2
15 10 5 0
0
1000
2000
3000
4000
5000
6000
7000
8000
9000 u1 u2
20 10 0
Increments (V)
MPC 0.0787 0.0822 8.8 13 4.02 4.28
0
1000
2000
3000
4000
5000
6000
7000
8000
10
9000 ∆u 1 ∆u 2
5 0 -5 -10 0
1000
2000
3000
4000
5000
6000
7000
8000
9000
Time(s)
Figure 5. i ∈ { 1, 2 } .
Experimental results of outputs yi and evolutions of control actions ui and its increments ∆ui with
reduced with smooth controls. This is due to the ability of the proposed PSO algorithm to solve a multiobjective problem taking into account the physical constraints of the system. Figure 6 shows the evolution of computation time Tc of the developed PSO algorithm throughout the previous experimental test. It is clear that Tc is always lower than the sampling time (1s) . That means that the proposed algorithm is able to provide the control actions before the end of the sampling time. Remark 1 The comparison of the obtained experimental results with those obtained when carrying out numerical simulations shows a slight difference. This can be understood by the fact that almost all physical parameters ci i ∈ { 1, .., 10 } present uncertainties. Therefore, it is unachievable to obtain perfectly equal 3251
Computation time Tc (s)
THAMALLAH et al/Turk J Elec Eng & Comp Sci
0.55 0.5 0.45 0.4 0.35 0.3 0.25 0.2
0
1000
2000
3000
4000 5000 Time (s)
6000
7000
8000 9000
Figure 6. Evolution of computation time Tc .
experimental result to those of simulations. Besides, the equipment used for the test rig is also subjected to uncertainties and the captured and emitted signals are, in turn, subjected to noises, which make the experimental results slightly different from those obtained in simulations.
u1 and u2 (V)
Level of Tank 2 (cm)
Level of Tank 1 (cm)
To further study the closed-loop performances of the developed MPC scheme, experimental tests of comparison were carried out between the results of the proposed method and those obtained with standard MPC [27] and PID controller. In order to control the quadruple-tank process with the standard MPC, Euler
y1 yc1
15 10 5 0
0
200 400 600 800 1000 1200 1400 1600 1800 2000 2200 2400 2600 2800 3000 y2 yc2
15 10 5 0
0
200 400 600 800 1000 1200 1400 1600 1800 2000 2200 2400 2600 2800 3000 u1 u2
20 10 0
0
200 400 600 800 1000 1200 1400 1600 1800 2000 2200 2400 2600 2800 3000
Increments (V)
10
∆u 1 ∆u 2
5 0 -5 -10 0
200 400 600 800 1000 1200 1400 1600 1800 2000 2200 2400 2600 2800 3000 Time(s)
Figure 7. Experimental results of outputs yi and evolutions of control actions ui and its increments ∆ui with i ∈ { 1, 2 } obtained with the proposed method (comparison test).
3252
THAMALLAH et al/Turk J Elec Eng & Comp Sci
approximation has been used to predict the output variables [28]. In addition, experimental tests of comparison are realized between the proposed method and T-S MPC method based on the PSO algorithm with a single optimization problem defined in Eq. (2). Two experimental tests of thr T-S MPC method based on a single objective were carried out with λ1 = 0.2 and λ2 = 0.8 . Figures 7, 8, 9, 10, and 11 and Table 3 present the comparison results. Table 3 illustrates the comparison results in terms of M RE , overshoot Dj % corresponding
Level of Tank 2 (cm)
Level of Tank 1 (cm)
to the j th output, and the root mean square of the increments of the controls ( RM SI ) expressed in Eq. (22): y1 yc1
15 10 5 0
0
200 400 600 800 1000 1200 1400 1600 1800 2000 2200 2400 2600 2800 3000 y2 yc2
15 10 5 0
0
200 400 600 800 1000 1200 1400 1600 1800 2000 2200 2400 2600 2800 3000
u1 and u2 (V)
30
u1 u2
20 10
Increments (V)
0
200 400 600 800 1000 1200 1400 1600 1800 2000 2200 2400 2600 2800 3000 ∆ u1 ∆ u2
20 10 0 -10 0
200 400 600 800 1000 1200 1400 1600 1800 2000 2200 2400 2600 2800 3000 Time(s)
Figure 8. Experimental results of outputs yi and evolutions of control actions ui and its increments ∆ui with i ∈ { 1, 2 } obtained with the MPC controller (comparison test).
√ RM SIi =
∑3000
∆ui (k)2 . 3000
k=1
(22)
In order to compare the robustness of the proposed method and those obtained with mentioned methods, the outflows of Tank 1 and Tank 2 have been modified by varying the positions of the valves from 1000 time steps. By focusing on Figures 7, 8, and 10, it is evident that despite the disturbance caused by the variation in outflows, the proposed method, standard MPC method, and T-S MPC method based on a single optimization problem with λ1 are able to correct the evolution of the outputs and to track the set point. However, the PID controller and T-S MPC method based on a single optimization problem with λ2 are almost incapable of controlling the system after the disturbance. As far as the values of M RE are concerned, after the disturbance, 3253
u1 and u2 (V)
Level of Tank 2 (cm)
Level of Tank 1 (cm)
THAMALLAH et al/Turk J Elec Eng & Comp Sci
20
y1 y c1
15 10 5 0
0
200 400 600 800 1000 1200 1400 1600 1800 2000 2200 2400 2600 2800 3000 y2 y c2
15 10 5 0
0
200 400 600 800 1000 1200 1400 1600 1800 2000 2200 2400 2600 2800 3000 u1 u2
20 10 0
0
200 400 600 800 1000 1200 1400 1600 1800 2000 2200 2400 2600 2800 3000
Increments (V)
20
∆ u1 ∆ u2
10 0 -10 0
200 400 600 800 1000 1200 1400 1600 1800 2000 2200 2400 2600 2800 3000 Time(s)
Figure 9. Experimental results of outputs yi and evolutions of control actions ui and its increments ∆ui with i ∈ { 1, 2 } obtained with PID controller (comparison test).
the proposed strategy is better than the MPC method in dealing with effects of disruptions. It is highly arguable from the results of the comparison tests presented by Table 3 that the performance in terms of M RE of the proposal method is better than that of the MPC method and the PID controller. In examining the results in terms of RM SI , it is clear that the proposed method has an important contribution in the optimization of control increments compared to the method based on the standard MPC and PID controller, which adjusts the liquid levels with aggressive controls and variables. However, the result in terms of Dj % of the PID controller is better than that of the proposed method and standard MPC. Additionally, the standard MPC approach and PID controller are easier to implement, but the use of the developed method leads to satisfactory results with a good performance in terms of M RE in the presence of disturbances. The results of Figures 7 and 10 and Table 3 clearly indicate that the performances of the proposed method are better than the method based on a single objective with λ1 in terms of RM E and RM SI after the variation in outflows. The results shown in Figures 7 and 11 and Table 3 demonstrate that the performance of the proposed method has shown more intricate results than the one based on a single objective with weighting factor λ2 in terms of RM E and very close in terms of RM SI .
3254
u1 and u2 (V)
Level of Tank 2 (cm) Level of Tank 1 (cm)
THAMALLAH et al/Turk J Elec Eng & Comp Sci
10 5 0
0
200 400 600 800 1000 1200 1400 1600 1800 2000 2200 2400 2600 2800 3000 y2 yc2
15 10 5 0
0
200 400 600 800 1000 1200 1400 1600 1800 2000 2200 2400 2600 2800 3000 u1 u2
30 20 10 0
Increments (V)
y1 yc1
15
0
200 400 600 800 1000 1200 1400 1600 1800 2000 2200 2400 2600 2800 3000 ∆u 1 ∆u 2
20 10 0 -10 0
200 400 600 800 1000 1200 1400 1600 1800 2000 2200 2400 2600 2800 3000 Time(s)
Figure 10. Experimental results of outputs yi and evolutions of control actions ui and its increments ∆ui with i ∈ { 1, 2 } obtained with T-S fuzzy MPC based on single objective function with λ1 (comparison test).
6. Conclusion This paper has described a multivariable predictive control of nonlinear system based on a new multiobjective PSO algorithm. In the modeling stage, the proposed method has used T-S fuzzy models to predict the behaviors of the process. The proposed algorithm has been applied to minimize multiobjective optimization problems in order to find the optimal control actions that respect some constraints and to preserve the stability of the closed loop. The developed MPC scheme has been implemented using a quadruple-tank process. The simulation and experimental results have shown the ability of the proposed method to deal with control problems of nonlinear MIMO systems. The satisfactory results with small values of control rate illustrate the proof of the ability of the developed multiobjective PSO algorithm. In addition, the results show that the proposed method has high stability and satisfactory results. Furthermore, the proposed method has provided progressive control without aggressive rate.
3255
u1 and u2 (V)
Level of Tank 2 (cm) Level of Tank 1 (cm)
THAMALLAH et al/Turk J Elec Eng & Comp Sci
10 5 0
0
200 400 600 800 1000 1200 1400 1600 1800 2000 2200 2400 2600 2800 3000 y2 yc2
15 10 5 0
0
200 400 600 800 1000 1200 1400 1600 1800 2000 2200 2400 2600 2800 3000 u1 u2
30 20 10 0
Increments (V)
y1 y c1
15
200 400 600 800 1000 1200 1400 1600 1800 2000 2200 2400 2600 2800 3000
20
∆u 1 ∆u 2
10 0 -10 0
200 400 600 800 1000 1200 1400 1600 1800 2000 2200 2400 2600 2800 3000 Time(s)
Figure 11. Experimental results of outputs yi and evolutions of control actions ui and its increments ∆ui with i ∈ { 1, 2 } obtained with T-S fuzzy MPC based on single objective function with λ2 (comparison test).
References [1] Nery Júnior GA, Martins MF, Kalid R. A PSO-based optimal tuning strategy for constrained multivariable predictive controllers with model uncertainty. ISA T 2014; 53: 560-567. [2] Clarke DW, Mohtadi C, Tuffs PS. Generalized predictive control—Part I. The basic algorithm. Automatica 1987; 23: 137-148. [3] Venkatesh S, Ramkumar K, Guruprasath M, Srinivasan S, Balaş VE. Generalized predictive controller for ball mill grinding circuit in the presence of feed-grindability variations. Stud Inform Control 2016; 25: 29-38. [4] Ben Abdennour R, Ksouri M, Favier G. Application of fuzzy logic to the on-line adjustment of the parameters of a generalized predictive controller. Intell Autom Soft Com 1998; 4: 197-213. [5] Laabidi K, Bouani F, Ksouri M. Multi-criteria optimization in nonlinear predictive control. Math Comput Simulat 2008; 76: 363-374. [6] Khouaja A, Garna T, Ragot J, Messaoud H. Nonlinear predictive controller based on S-PARAFAC Volterra models applied to a communicating two-tank system. Int J Control 2015; 88: 1456-1471. [7] McNamara P, Negenborn RR, De Schutter B, Lightbody G. Weight optimisation for iterative distributed model predictive control applied to power networks. Eng Appl Artif Intel 2013; 26: 532-543. [8] Vallerio M, Van Impe J, Logist F. Tuning of NMPC controllers via multi-objective optimisation. Comput Chem Eng 2014; 61: 38-50.
3256
THAMALLAH et al/Turk J Elec Eng & Comp Sci
[9] Deb K. Multi-Objective Optimization Using Evolutionary Algorithms. New York, NY, USA: John Wiley & Sons, 2001. [10] Ben Hassen N, Saadaoui K, Benrejeb M. Lead-lag controller design for time delay systems using genetic algorithms. Stud Inform Control 2017; 26: 87-94. [11] Reyes-Sierra M, Coello CC. Multi-objective particle swarm optimizers: a survey of the state-of-the-art. International Journal of Computational Intelligence Research 2006; 2: 287–308. [12] Kennedy J, Eberhart R. Particle swarm optimization. In: IEEE International Conference on Neural Networks; 27 November–1 December 1995; Perth, Australia. New York, NY, USA: IEEE Press. pp. 1942-1948 [13] Thi Thom H, Ming Yuanc C, Quoc Tuan V. A novel perturbed particle swarm optimization-based support vector machine for fault diagnosis in power distribution systems. Turk J Elec Eng & Comp Sci 2018; 26: 518-529. [14] Toader FT. A hybrid algorithm for job shop scheduling problem. Stud Inform Control 2015; 24: 171-180. [15] Francesco B. Constrained Optimal Control of Linear and Hybrid Systems. New York, NY, USA: Springer, 2003. [16] Chadli M, Borne P. Multiple Models Approach in Automation: Takagi-Sugeno Fuzzy Systems. 1st ed. New York, NY, USA: Wiley-ISTE, 2012. [17] Garriga JL, Soroush M. Model predictive control tuning methods: a review. Ind Eng Chem Res 2010; 49: 3505-3515. [18] Wojsznis W, Gudaz J, Blevins T, Mehta A. Practical approach to tuning MPC based on practical approach to tuning MPC. ISA T 2003; 42: 149-162. [19] Bemporad A, Muñoz De La Peña D. Multiobjective model predictive control. Automatica 2009; 45: 2823-2830. [20] Zavala VM, Flores-Tlacuahuac A. Stability of multiobjective predictive control: a utopia-tracking approach. Automatica 2012; 48: 2627-2632. [21] Boulkaibet I, Belarbi K, Bououden S, Marwala T, Chadli M. A new T-S fuzzy model predictive control for nonlinear processes. Expert Syst Appl 2017; 88: 132-151. [22] Takagi T, Sugeno M. Fuzzy identification of systems and its applications to modeling and control. IEEE T Syst Man Cyb 1985; SMC-15: 116-132. [23] Fossard AJ, Normand-Cyrot D. Nonlinear Systems Stability and Stabilization 2. London, UK: Chapman & Hall, 1996. [24] Deb K, Pratap A, Agarwal S, Meyarivan T. A fast and elitist multiobjective genetic algorithm: NSGA-II. IEEE Transactions on Evolutionary Computation 2002; 6: 182-197. [25] Johansson KH. The quadruple-tank process: a multivariable laboratory process with an adjustable zero. IEEE T Control Syst T 2000; 8: 456-465. [26] Lee HJ, Park JB, Joo YH. Digital fuzzy set-point regulating chaotic systems: intelligent digital redesign approach. In: Halang ZL, Halang WA, Halang CG. Integration of Fuzzy Logic and Chaos Theory. Berlin, Germany: Springer, 2006. pp. 157-183. [27] Camacho EF, Bordons C. Model Predictive Control. Berlin, Germany: Springer, 1999. [28] Miranda H, Cortes P, Yuz JI, Rodriguez J. Predictive Torque Control of Induction Machines Based on State-Space Models. IEEE T Ind Electron 2009; 56: 1916-1924.
3257