Aug 20, 2017 - Bernard Klein. Positioning NK-kappaB in multiple myeloma. Blood, 115(17):3422â4, April 2010. Tim Lenoir
Constraints on signaling networks logic reveal functional subgraphs on Multiple Myeloma OMIC data Bertrand Miannay Team MeForBio, LS2N Team 11, CRCINA Nantes, France PhD supervisor : Olivier Roux (LS2N, Nantes) Co-supervisors : Stéphane Minvielle (CRCINA, Nantes), Carito Guziolowski (LS2N, Nantes), Florence Magrangeas (CRCINA, Nantes)
August 20, 2017
Bertrand Miannay
August 20, 2017
1 / 26
Context
Summary
1
Context
2
Method Overview Formalism and implementation Components analysis Space solution reduction
3
Application Data and regulatory network Perfect colorations generation Components analysis
4
Conclusion & perspective
Bertrand Miannay
August 20, 2017
2 / 26
Context
Historical Genes expression measure : I I
Decrease of cost/time during last 2 decades. Used to compare expression profiles[LG06, PJvdR+ 99].
Biological knowledge : I I
Increase of knowledge on interactions between biological entities and their roles. Formalization in databases (KEGG, GO, NCI-PID, CBN, etc.).
Accumulated regulatory knowledge and experimental observations.
Modelization Used for cellular phenomenas study [KDS+ 16], disease research [LLX+ 13, Nev01], bio-production optimization[Ate15], etc. Cannot work with large amounts of data due to "natural noise". Need pre-selection of data.
Bertrand Miannay
August 20, 2017
3 / 26
Method
Summary
1
Context
2
Method Overview Formalism and implementation Components analysis Space solution reduction
3
Application Data and regulatory network Perfect colorations generation Components analysis
4
Conclusion & perspective
Bertrand Miannay
August 20, 2017
4 / 26
Method
Overview
Specificity Identification of sub-set of data using biological interactions. Based on graph coloring approaches [TCSR+ 15]. Integrate activation and inhibition interactions in the regulatory network. Research of the “perfect colorations”. Implemented in ASP (Answer Set Programming).
Input/output From a regulatory network ⇒ The entities strongly associated merged in components From a set of observations ⇒ Measurement of the maximal similarity with the "perfect configurations" of the components.
Bertrand Miannay
August 20, 2017
5 / 26
Method
Formalism and implementation
Instanciation Graph : Set of oriented, signed (activator or inhibitor), weighted edges between nodes Target : A node with at least, one predecessor (or regulator).
Candidate solutions generation Colored graph : A graph in which each node is associated to a sign: up or down
Bertrand Miannay
August 20, 2017
6 / 26
Method
Formalism and implementation
Constraints Consistent target coloring : A colored target, which is explained by at least one predecessor’s coloration. Perfect target coloring : A colored target, which is explained by all predecessor’s coloration. Imperfect weighted regulator : Weight of the edge between an imperfect target and its inconsistent regulator.
Bertrand Miannay
a
b
c
d
Consistent node coloring
X
X
X
X
Perfect target coloring
X
X
X
X
Imperfect weighted regulator
3
1
2
0
August 20, 2017
7 / 26
Method
Formalism and implementation
Optimization 1 : Consistency maximization : Colored graphs with the maximal number of consistent targets. 2 : Perfect target coloring maximization : Colored graph with the maximal number of perfect targets. 3 : Imperfect weighted regulator minimization : Colored graphs with the minimal sum of imperfect weighted regulator
Result Set of perfect colorations
node
A
B
C
D
coloration 1
up
up
up
down
coloration 2
up
down
down
up
coloration 3
down
up
up
down
coloration 4
down
down
down
up
Components identification Component : set of nodes with correlated (positive or negative) coloration in perfect solutions.
Example When B is up (down), C is up (down) too ⇒ Positive correlation. When B is up (down), D is down (up) ⇒ Negative correlation. Component syntax : "B +, C +, D -" Bertrand Miannay
August 20, 2017
8 / 26
Method
Components analysis
Maximal similarity computing Component configurations : Two possibilities of colorations for a component. Maximal similarity (MS) : For a set of observation (nodes associated to signs) and a component : the maximal percentage of observed nodes in the component with the same sign as in the configurations.
Toy example Configuration : Component : "A +,B +,C +,D +,E -" (A,up), (B,up), (C,up), (D,up), (E,down) (A,down), (B,down), (C,down), (D,down), (E,up) Observations : (B,up), (C,up), (D,up), (E, up) MS = 43 Bertrand Miannay
August 20, 2017
9 / 26
Method
Space solution reduction
Coloring property Symmetric reduction : A colored graph and its reverse coloring ( up ⇐⇒ down) have the same optimization scores.
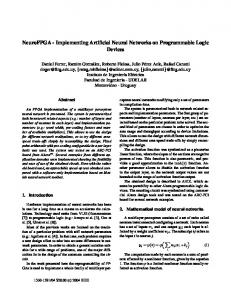
Topological property Consistent coloring : Identification of nodes which will have a sign correlation in consistent solutions (Figure 1-a) Imperfect coloring : Identification of nodes which will have a sign correlation in candidate solutions with minimized imperfect colorations (Figure 1-b) Edges balance : Deletion of balanced edges (Figure 1-c)
Figure : Patterns searched by the 3 reductions methods used in this study. a : nodes correlated in consistent solution. b : nodes correlated sharing the same target. c : edges with same weight, root, target and opposite signs. Bertrand Miannay
August 20, 2017
10 / 26
Application
Summary
1
Context
2
Method Overview Formalism and implementation Components analysis Space solution reduction
3
Application Data and regulatory network Perfect colorations generation Components analysis
4
Conclusion & perspective
Bertrand Miannay
August 20, 2017
11 / 26
Application
Data and regulatory network
Context Analysis of genes expression data from Multiple myeloma patients with regulatory network.
Data Gene expression profiles (GEP) from : 602 multiple myeloma patients (myeloma cells : MC) 9 healthy donors (normal plasma cells : NPC). Identification for each GEP of the over-expressed (up) and under-expressed (down) genes.
Regulatory network From Pathway Interaction database (PID) Extraction of the downstream events from three signaling pathways (IL6/IL6-R, IGF1/IGF1-R and CD40) [Kle10] to the variant genes Generation of an induced subgraph from NCI-PID, containing 2269 nodes, 2683 edges and connecting 529 variant genes.
Bertrand Miannay
August 20, 2017
12 / 26
Application
Perfect colorations generation
Graph reduction Consistent coloring, Imperfect coloring, Edges balance reductions New graph with 193 nodes 389 edges
Table : Computation time. Graph
number of nodes
number of edges
time
Generated graph
2269
2683
72’,12”
Reduced graph
193
389
14”
Perfect solutions and components identification 16834 perfect colorations. 15 components identified from the regulatory network. Only 2 components (2 and 6) include more than one gene.
Bertrand Miannay
August 20, 2017
13 / 26
Application
Components analysis
Components validation and specification Computing then comparison between MS MC and MS NPC for each component. Validation by comparing with MS from random data. Only component 2 is statistically different between MC and NPC.
Biological analysis : gene ontology Genes in the component 2 (167 genes) are strongly associated to cancer pathways (apoptotic process). Genes in the component 6 (349 genes) are not associated to specific pathway. Genes in the graph (529 genes) and all variant genes (12410 genes) are not associated to specific pathway. Bertrand Miannay
August 20, 2017
14 / 26
Conclusion & perspective
Summary
1
Context
2
Method Overview Formalism and implementation Components analysis Space solution reduction
3
Application Data and regulatory network Perfect colorations generation Components analysis
4
Conclusion & perspective
Bertrand Miannay
August 20, 2017
15 / 26
Conclusion & perspective
Conclusion Identification of functional subgraphs/components from a regulatory network based on perfect colorations. Estimation of deregulation for each components from dataset based on similarity with perfect colorations.
Perspective Comparison with other pathways analysis methods. Use other database (trrust, causal bionet, etc.) Improve topological reduction. Integration of continuous data. Bertrand Miannay
August 20, 2017
16 / 26
Conclusion & perspective
Thanks for your attention
[email protected]
Bertrand Miannay
August 20, 2017
17 / 26
Références
Références I Ozlem Ates. Systems Biology of Microbial Exopolysaccharides Production. Frontiers in bioengineering and biotechnology, 3:200, 2015. Aristotelis Kittas, Aurélien Delobelle, Sabrina Schmitt, Kai Breuhahn, Carito Guziolowski, and Niels Grabe. Directed random walks and constraint programming reveal active pathways in hepatocyte growth factor signaling. FEBS Journal, 283(2):350–360, jan 2016. Bernard Klein. Positioning NK-kappaB in multiple myeloma. Blood, 115(17):3422–4, April 2010. Tim Lenoir and Eric Giannella. The emergence and diffusion of DNA microarray technology. Journal of biomedical discovery and collaboration, 1(1):11, jan 2006. Wei Liu, Chunquan Li, Yanjun Xu, Haixiu Yang, Qianlan Yao, Junwei Han, Desi Shang, Chunlong Zhang, Fei Su, Xiaoxi Li, Yun Xiao, Fan Zhang, Meng Dai, and Xia Li. Topologically inferring risk-active pathways toward precise cancer classification by directed random walk. Bioinformatics (Oxford, England), 29(17):2169–77, September 2013. J R Nevins. The Rb/E2F pathway and cancer. Human molecular genetics, 10(7):699–703, apr 2001. C M Perou, S S Jeffrey, M van de Rijn, C A Rees, M B Eisen, D T Ross, A Pergamenschikov, C F Williams, S X Zhu, J C Lee, D Lashkari, D Shalon, P O Brown, and D Botstein. Distinctive gene expression patterns in human mammary epithelial cells and breast cancers. Proceedings of the National Academy of Sciences of the United States of America, 96(16):9212–7, aug 1999. Sven Thiele, Luca Cerone, Julio Saez-Rodriguez, Anne Siegel, Carito Guziołowski, and Steffen Klamt. Extended notions of sign consistency to relate experimental data to signaling and regulatory network topologies. BMC bioinformatics, 16(1):345, jan 2015.
Bertrand Miannay
August 20, 2017
18 / 26
Validation & specificity
Summary
5
Validation & specificity
6
GO-results
7
Components interactions
Bertrand Miannay
August 20, 2017
18 / 26
Validation & specificity
Figure : MS comparison for component 2 (left) and 6 (right).
Component
# Nodes
# Genes
Validation p-value
Specificity p-value
C2
422
167
8,904e-03
0.019
1832
349
7.91e-05
0.573
C
6
Bertrand Miannay
August 20, 2017
19 / 26
GO-results
Summary
5
Validation & specificity
6
GO-results
7
Components interactions
Bertrand Miannay
August 20, 2017
20 / 26
GO-results
Table : 5 first results of the Gene Ontology Enrichment Analysis for the component C 2 . GO biological process
found
expected
Fold Enrichment
P-value
regulation of cell death
75
11.98
6.26
6.46E-37
regulation of programmed cell death
73
11.21
6.51
8.33E-37
regulation of apoptotic process
72
11.11
6.48
4.90E-36
single-organism cellular process
149
77.70
1.92
9.90E-28
positive regulation of metabolic process
87
24.50
3.55
7.81E-26
Bertrand Miannay
August 20, 2017
21 / 26
GO-results
Table : 5 first results of the Gene Ontology Enrichment Analysis for the component C 6 . GO biological process
found
expected
Fold Enrichment
P-value
response to organic substance
182
42.74
4.26
1.02E-68
response to chemical
203
64.12
3.17
2.13E-57
response to oxygencontaining compound
129
23.26
5.55
1.32E-56
positive regulation of biological process
233
88.29
2.64
1.39E-55
regulation of cell proliferation
132
25.67
5.14
1.98E-54
Bertrand Miannay
August 20, 2017
22 / 26
GO-results
Table : 5 first results of the Gene Ontology Enrichment Analysis for the 529 genes integrated in the graph. GO biological process
found
expected
Fold Enrichment
P-value
positive regulation of biological process
368
137.60
2.67
6.53E-94
positive regulation of cellular process
346
122.38
2.83
2.02E-91
positive regulation of metabolic process
285
80.69
3.53
3.06E-90
positive regulation of cellular metabolic process
271
75.30
3.60
6.04E-86
response to organic substance
259
68.79
3.77
4.85E-85
Bertrand Miannay
August 20, 2017
23 / 26
GO-results
Table : 5 first results of the Gene Ontology Enrichment Analysis for all the variant genes (21002). GO biological process
found
expected
Fold Enrichment
P-value
biological process
11199
10256.18
1.09
2.69E-123
cellular process
9925
8845.71
1.12
2.22E-105
cellular metabolic process
6101
5303.88
1.15
2.77E-43
biological regulation
7805
7018.07
1.11
5.08E-43
regulation of biological process
7404
6658.81
1.11
1.13E-37
Bertrand Miannay
August 20, 2017
24 / 26
Components interactions
Summary
5
Validation & specificity
6
GO-results
7
Components interactions
Bertrand Miannay
August 20, 2017
25 / 26
Components interactions
Bertrand Miannay
August 20, 2017
26 / 26