LETTER
doi:10.1038/nature11216
Constraints on the volatile distribution within Shackleton crater at the lunar south pole Maria T. Zuber1, James W. Head2, David E. Smith1, Gregory A. Neumann3, Erwan Mazarico1, Mark H. Torrence4, Oded Aharonson5, Alexander R. Tye2, Caleb I. Fassett2, Margaret A. Rosenburg5 & H. Jay Melosh6
Shackleton crater is nearly coincident with the Moon’s south pole. Its interior receives almost no direct sunlight and is a perennial cold trap1,2, making Shackleton a promising candidate location in which to seek sequestered volatiles3. However, previous orbital and Earth-based radar mapping4–8 and orbital optical imaging9 have yielded conflicting interpretations about the existence of volatiles. Here we present observations from the Lunar Orbiter Laser Altimeter on board the Lunar Reconnaissance Orbiter, revealing Shackleton to be an ancient, unusually well-preserved simple crater whose interior walls are fresher than its floor and rim. Shackleton floor deposits are nearly the same age as the rim, suggesting that little floor deposition has occurred since the crater formed more than three billion years ago. At a wavelength of 1,064 nanometres, the floor of Shackleton is brighter than the surrounding terrain and the interiors of nearby craters, but not as bright as the interior walls. The combined observations are explicable primarily by downslope movement of regolith on the walls exposing fresher underlying material. The relatively brighter crater floor is most simply explained by decreased space weathering due to shadowing, but a one-micrometre-thick layer containing about 20 per cent surficial ice is an alternative possibility. Detailed study of the topography of Shackleton (Fig. 1a) offers the opportunity to improve understanding of processes that operate in permanently shadowed regions (Fig. 1b). Crater geometry, age and preservation state are relevant for understanding the accumulation and preservation of volatiles as well as the processes that modify the lunar surface over geologic timescales. Our analysis uses observations from the Lunar Orbiter Laser Altimeter (LOLA)10, an instrument on NASA’s Lunar Reconnaissance Orbiter (LRO) mission. LOLA is a five-beam laser altimeter that operates at a wavelength of 1,064.4 nm with a 28-Hz pulse repetition rate. From LRO’s mapping orbit at ,50 km altitude, the instrument illuminates 5-m-diameter spots on the lunar surface, returning up to 140 measurements of elevation per second; the five profiles enable characterization of bi-directional slopes over various baselines, and roughness from averaging of pulse elevations. In addition, from the spreading of backscattered laser pulses, LOLA obtains the root-mean-square (RMS) roughness of the surface within laser footprints. Finally, from the ratio of received to transmitted laser energy, LOLA measures the reflectance of the lunar surface at zero phase angle at the laser wavelength within laser spots. As of 1 December 2011, the LOLA instrument has accumulated more than 5.1 billion elevation measurements11. Because Shackleton lies nearly at a pole, where the LOLA coverage is densest, it is possible to construct a digital elevation model of unprecedented spatial resolution and radial accuracy. More than 5,000 LOLA tracks, referenced to the Moon’s centre of mass via precision orbits determined from radio tracking12 aided by Earth-based laser tracking13,14, were converted
to topography. Track segments within the area of interest were geometrically corrected at orbit crossover points15. Figure 1a shows the topography of Shackleton crater sampled at 10-m spatial resolution; individual measurements have an accuracy of ,1 m with respect to the Moon’s centre of mass. The 40 km 3 40 km topographic model of Shackleton is derived from 5.358 million elevation measurements with an average of 0.34 altimeter measurements in each 10-m square area; the resolution is comparable to or better than other studies of Shackleton’s interior by images9, Earth-based radar6 and orbital synthetic aperture radar16. The topography reveals the near-axisymmetric bowl-shaped nature of the crater, in which the crater rim and interior walls are well preserved. The depth/diameter ratio of the crater is 0.195 6 0.025 (Table 1), which is consistent with other fresh simple craters17. Figure 1c shows bi-directional surface slopes over 10-m baselines that quantify the uniform, steep inner walls; slopes approach the angle of repose. Slopes are greatest in the mid-levels of walls, which is in contrast to many crater walls on Mars, where near-vertically oriented cliffs of outwardly dipping coherent cap rock are exposed in the upper walls18. Surface roughness at a scale of 20–50 m is shown in Fig. 1d. These data indicate that crater walls are smoother, within bounds of measurement uncertainty, at this spatial scale than the floor or rim, especially portions of lower walls aligned with mounds on the crater floor. Table 1 lists estimated roughness values of various crater components. Similarly, the average RMS roughness derived from spreading of individual laser footprints (Supplementary Information) is lower on the crater walls. Pulses returned from the steep walls of Shackleton are spread in time by .10 ns, but after correcting for the effect of local slope on a longer baseline, the pulse spreading due to surface roughness is somewhat less than on the crater floor or surrounding terrain. The floor can be divided into two regions, a flat portion and an elevated terrain. The roughness of the mound unit increases at the largest scales due to its hummocky character, but it is smoother than the flat region at smaller scales, due to its paucity of craters. Figure 2 shows a more detailed view of the topography of Shackleton’s floor, which highlights the irregularly distributed deposits and numerous small craters (see also Fig. 1e). The largest mound of material has a relief of 210 m (Table 1) and the highest-local slope of any of the floor deposits is ,25u, which is below the angle of repose. Two areas of the floor show fan-shaped structures consisting of material that has been transported downslope from the interior walls in a manner commonly observed in craters of this size range17. The limited fan material around the margins of the crater floor, combined with the asymmetric distribution and slope properties of deposits, suggest that the predominant contribution to the fill is ejecta fallback with a secondary contribution from slumped wall deposits.
1
Department of Earth, Atmospheric and Planetary Sciences, Massachusetts Institute of Technology, Cambridge, Massachusetts 02139, USA. 2Department of Geological Sciences, Brown University, Providence, Rhode Island 02912, USA. 3Solar System Exploration Division, NASA/Goddard Space Flight Center, Greenbelt, Maryland 20771, USA. 4Stinger Ghaffarian Technologies, Greenbelt, Maryland 20770, USA. 5Division of Geological and Planetary Sciences, California Institute of Technology, Pasadena, California 91125, USA. 6Department of Earth and Atmospheric Sciences, Purdue University, West Lafayette, Indiana 47907, USA.
3 7 8 | N AT U R E | VO L 4 8 6 | 2 1 J U N E 2 0 1 2
©2012 Macmillan Publishers Limited. All rights reserved
LETTER RESEARCH a
b
10
30 60
0.75
–1.50
–10
–2.25
40 30
–10
0 20 15
–10 10
20
–3.00
–20
Slope (degrees)
–0.75
25 50
0
Percentage
0.00
Topography (km)
0
10
70
10
1.50
c
80
5 10
–20
–3.75
–20 0
0
–10
0
10
20
–10
0
10
20° W 10° W
d 10
4.0
e
3.5
89° S
0
2.5
1.5
–10
1.0
0.0
–10
0
10
20
30° E
0.5
0 I
0.4
89° S
I
–10
0.3
F
F
–20 Slope (degrees) 0–5 5–10 10–15 15–20 20–25 25–30 30–35 35–40 40–45 45–50
20
10
10
0.5
–20
0
I/F
2.0
10° E 19° E
–10
f
Surface roughness (RMS m)
3.0
0°
20
50+
E
A D
C
0.2
X
–10
B
0
10
20
X G
89° S 0 km 5
X
14° E
Figure 1 | Detailed characterization of Shackleton crater. a, Topography in km; b, percentage of time illuminated; c, 10-m baseline slopes in degrees; d, surface roughness shown as RMS residual in m; e, locations of crater counts used to determine relative ages; and f, zero-phase, 1,064-nm reflectance shown as I/F. Topography, slopes and roughness are based on a 10-m spatial resolution grid of all available LOLA profiles. In a–d and f, x and y axes indicate spatial scale, where (0, 0) is the lunar south pole and colour scales show magnitude of plotted quantity. White regions in b correspond to zero illumination. Panel e shows locations of craters counted to estimate relative age, plotted over 10-m slopes (colour coded as in inset). Crater regions in e correspond to: A, flat region of crater
floor; A/B, entire crater floor; C, crater wall; D, crater rim crest; E/F, inner rim annulus (,5.5 km); E, inner rim annulus excluding steep region (F); F, steep rim region within annulus; G, crater wall section; I, Shackleton crater deposits north of rim in flat areas; and X, secondary crater chains and clusters (removed from analysis). In f, reflectance is expressed as a radiance factor (I/F), which is defined as the ratio of the measured radiance I to the radiance F of an ideal diffusive surface in vacuum with 100% reflectance under the same illumination. Each dot represents a 0.4 3 0.4 km pixel median average of LOLA’s spot 3 reflectance. Contours show topography at 0.2 km intervals. The grey annulus shows the 17-km diameter of the steepest portion of the walls and the 7-km diameter of the floor.
Table 1 | Parameters describing Shackleton crater
Shackleton was previously assigned an Eratosthenian age19 (middle lunar history; in the approximate interval 1–3.2 Gyr before present) on the basis of its relatively fresh morphology, its lack of rays, and counts of superposed craters3 using AMIE image data (50 m per pixel) and Arecibo radar data (20 m per pixel). Craters were counted within a crater diameter (,20 km) of the rim crest, avoiding obvious secondary craters. This analysis was subsequently revisited and resulted in an older, Imbrian age3 (in the approximate interval 3.2–3.8 Gyr before present). Here we use a LOLA shaded relief map to advance previous work by individually dating different parts of the crater (see Fig. 1e and Supplementary Information) to investigate the processes that have operated since crater formation. LOLA observations permit dating of shadowed regions in the crater interior and allow spatially unbiased measurements of crater density due to uniformity in illumination conditions. In addition, illumination can be varied over the topographic model to enhance crater detection. On the basis of comparison of the several different areas of the rim of the crater, it is clear that the variable slopes of the rough crater rim have an influence on crater retention. For example, two areas of very flat terrain on the Shackleton flank within one crater diameter of the rim crest (I; Fig. 1e) yield modelled crater ages of ,3.69 Gyr, whereas areas closer to the rim crest (within ,5.5 km)
Parameter
Value
Areocentric latitude of centre of rim (degrees) Areocentric longitude of centre of rim (degrees) Lunar radius at floor centre (km) Mean crater diameter at rim (km) Mean depth, rim to floor (km) Mean rim height above datum (km) Range of floor topography (km) Area of crater at rim (km2) Area of crater floor (km2) Estimated fill depth (km) Crater volume (km3) Fill volume, including mounds (km3) Maximum wall slope (degrees) Average wall slope (degrees) RMS roughness* of crater exterior (m) RMS roughness* of crater walls (m) RMS roughness* of crater floor (m) RMS roughness* of crater rim (m) I/F of crater exterior I/F of interior walls I/F of interior floor Ratio of average depth/average rim diameter, d/D See Fig. I legend for definition of I/F. * Within 5-m spots.
289.655 129.174 1,734.63 21 4.1 6 0.05 1.3 ,0.210 ,346 ,38 ,0.75 640 6 10 12 6 1 35 30.5 ,1 ,1 ,1 ,1 0.32 6 0.04 0.46 6 0.03 0.43 6 0.02 0.195 6 0.025
2 1 J U N E 2 0 1 2 | VO L 4 8 6 | N AT U R E | 3 7 9
©2012 Macmillan Publishers Limited. All rights reserved
RESEARCH LETTER –1.750
–2.6 –2.7
.7
–2
–2.7
–1.875
–2.000
–2
.8
–5.0
–2.8
–2
7
.5
–2.
–2.7
–2
.6
–2.6 –2.5
–2.125
–2.250
–2.375
Elevation (km)
Stereographic y axis (km)
–2.6
−2.8
–2.7
–7.5
–2.500 –2 .6
–2.5
–2.625
–2.750
–10.0
–2.875 5.0
7.5
10.0
Stereographic x axis (km)
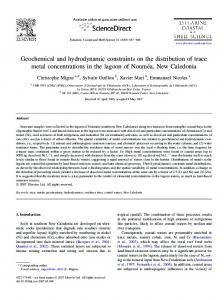
Figure 2 | High-resolution elevation map in stereographic projection of the floor of Shackleton. Elevations are contoured at 5-m intervals with colours indicating elevation with respect to 1,737.4 km. The axes indicate spatial scales.
yield ages of ,1.21 Gyr (F, steeper slopes; Fig. 1e) and ,2.91 Gyr (E, fewer steep slopes; Fig. 1e). The flat areas of the Shackleton crater deposit (I; Fig. 1e) indicate an age of ,3.69 Gyr (Supplementary Table 1), older than the originally estimated age of 1.3–3.3 Gyr (ref. 19) but close to the Upper Imbrian age of ,3.6 Gyr estimated subsequently3. Determination of ages of these individual regions permits quantitative investigation of how the crater has been modified. A critical question is the age of the permanently shadowed portions of the interior walls and floor of Shackleton. Analysis indicates that the lunar spin axis has been at its approximate current orientation for ,2 Gyr (ref. 20). If the crater had been accumulating volatiles in the permanently shadowed areas over a period of this order, it is reasonable to hypothesize that its interior was resurfaced, covering and burying craters and thus producing a younger relative age. Examination of the steep crater wall (C; Fig. 1e) yields a much younger crater retention age of ,1.44 Gyr, which could be consistent with either volatile mantling or downslope mass wasting (Fig. 1c)21. Examination of the permanently shadowed parts of the crater floor (A; Fig. 1e), the area where volatiles plausibly accumulated, reveals a crater retention age of ,3.60 Gyr, essentially identical to the flat areas of the crater rim. Including the rougher parts of the crater floor (B; Fig. 1e) produces an age of ,3.29 Gyr, which almost certainly reflects the influence of downslope transport, as observed on the inner part of the Shackleton rim, on the retention of craters. The similar age of the Shackleton crater exterior and floor (,3.69 and 3.60 Gyr) is evidence that if volatiles accumulated in this cold trap for ,109 years, they were not in sufficient quantity to alter in a statistically significant sense the size–frequency distribution of superposed craters in the size range counted. Knowledge of the crater size–frequency distribution (Supplementary Fig. 1) permits an assessment of the minimum amount of deposition that could occur without disrupting this distribution. The craters counted on Shackleton’s floor ranged from ,250 m up to ,500 m in diameter, representing a range of fresh crater depths of ,50–100 m (ref. 22). Accumulation of volatiles to thicknesses in excess of 20–50 m would significantly alter the crater size–frequency distribution and
should be observed in terms of a deficit in the number of small craters. A rollover in the curve at small crater diameters is observed, but is very similar to that seen outside the crater (I; Fig 1e and Supplementary Fig. 1), and thus is more likely to be due to the typical destruction effects of superposed craters and other diffusive processes (such as micrometeorite bombardment or seismic shaking associated with moonquakes triggered by stresses associated with impacts or tides) at these diameters. On the other hand, if volatiles were cold-trapped by vapour diffusion into the regolith, as opposed to deposition in surface layers, then muting of superposed craters may not have been as significant. Figure 1f shows profiles of 1,064-nm reflectance of Shackleton crater and its surroundings. A previous study9 obtained images of the floor of Shackleton from the Kaguya Terrain Camera at the time of maximum scattering illumination at the lunar south pole and observed no evidence for brightening; results were interpreted to indicate an absence of pure ice deposits on the crater floor. In the current study, LOLA profiles assembled from numerous orbital passes at the most favourable conditions for obtaining reliable measurements of reflectance show that the crater walls are anomalously bright relative to the surrounding terrain. Similarly to other impact craters in this size range, this brightness could be due to downslope movement of material caused by micrometeorite and small projectile bombardment on steep slopes, or by seismic shaking. The cascading of regolith material downslope exposes optically less mature surfaces than those developed and retained on lower slopes. At a wavelength of 1,064 nm, the floor of Shackleton crater is darker than its interior walls, but both floors and walls are considerably brighter than the surrounding terrain, including the interiors of nearby craters that are both shadowed and sunlit. The relative brightness of the floor relative to surroundings requires explanation. Micrometeorite bombardment and impingement of the solar wind produce ‘space weathering’ of exposed geologic materials that reddens and darkens their surfaces23. The former (bombardment) would be less significant in the shadowed interior of Shackleton than in the surrounding region
3 8 0 | N AT U R E | VO L 4 8 6 | 2 1 J U N E 2 0 1 2
©2012 Macmillan Publishers Limited. All rights reserved
LETTER RESEARCH because the interior of the crater has not been exposed to the Sun for more than 2 Gyr (ref. 20), whereas the latter (solar wind impingement) might be enhanced in permanently shadowed craters24. Thus the floor brightness enhancement could be explained by a dearth of space weathering by micrometeorite bombardment. Volatile deposition is an alternative possibility. Under the conservative assumption that water ice has a 1,064-nm reflectance twice that of the lunar regolith25 and that both are observed at zero phase, the measured reflectance of the floor can be explained by a micrometrethick surface layer (the depth over which the laser backscatter measurement is sensitive) of 22% ice mixed with rock26. Greater ice contents distributed throughout a thicker layer are possible but cannot be constrained from LOLA’s reflectivity measurement. For comparison, far-ultraviolet reflectance of permanently shadowed regions from the LRO Lyman Alpha Mapping Project (LAMP) is consistent with ,1–2% surface water frost27. Results from the LRO Mini-RF orbital radar for the interior of Shackleton16 provide additional insight. Regions with thick ice deposits are expected to have circular polarization ratios (CPR) .1, but such high ratios can also be explained by surface roughness. High-resolution images from ground-based radar6 show that some areas with high CPR lie inside the rim of Shackleton. Mini-RF data16 reveal that CPR values decrease with depth within the crater, and CPR values on the floor of Shackleton crater are predominantly ,1. The pixels with CPR values in excess of unity are distributed heterogeneously throughout the crater walls, correlate generally with regions of high roughness observed by LOLA (Fig. 1d) and include some sunlit areas (Fig. 1b). Although some contribution to high CPR values from volatiles is possible, and would imply a process in which volatile deposition operates very rapidly in comparison to the rate of removal, the combined data suggest that the higher floor reflectance is due primarily to the dearth of space weathering in this shadowed environment. In considering why Shackleton’s interior walls have a higher reflectance than its floor, it is instructive to note that wall brightening is not restricted to areas that are continuously shadowed but extends to the upper illuminated portions. Consequently, a higher concentration of surface volatiles on the walls than present on the floor is an unlikely explanation. More likely is downslope movement of regolith material on the steep crater walls that has exposed brighter underlying material; downslope movement is consistent with the observed slopes near the angle of repose and the roughness and morphology of Shackleton’s interior walls (Fig. 1c, d), as well as with Earth-based radar backscatter6 and Mini-RF16 measurements.
METHODS SUMMARY
Full Methods and any associated references are available in the online version of the paper at www.nature.com/nature. Received 23 December 2011; accepted 4 May 2012. 1. 2. 3. 4. 5. 6. 7. 8. 9. 10. 11. 12. 13. 14. 15. 16. 17. 18. 19. 20. 21. 22. 23. 24.
25. 26.
LOLA, an instrument on board the LRO spacecraft, outputs five beams per laser pulse that are backscattered from the lunar surface and detected in the instrument’s receiver. The relevant measurement is the time of flight of each individual laser pulse, which can be converted to a range of the spacecraft to the lunar surface given knowledge of the position of the spacecraft with respect to the Moon’s centre of mass. Radial range errors were minimized by geometric adjustment of altimetric tracks within the study area. In practice, profiles of one-way range from the LOLA instrument to the lunar surface along the spacecraft ground track were converted to lunar radius at each bounce point using the reconstructed orbit of LRO. Topography was determined by subtracting a sphere of 1,737.4 km from each radius measurement. Slopes were calculated from a two-laser-spot fit at 20–50-m length scales, and RMS roughness represents a standard deviation about a plane fitted by leastsquares to two laser shots along-track, from which at least four valid spots are returned out of a possible total of ten. The plane has dimensions of 90–100 m in the longest axis and 10–40 m in the shortest axis, depending on the positions of the spots returned. The ratio of returned to transmitted pulse energy is a measure of surface reflectance at the laser wavelength. The transmitted and returned pulse energies were measured by integrating the area under the pulses. Observations of 1,064-nm reflectance were derived from LOLA tracks crossing Shackleton for days 130– 149 in 2010.
27.
Watson, K., Murray, B. C. & Brown, H. The behavior of volatiles on the lunar surface. J. Geophys. Res. 66, 3033–3045 (1961). Arnold, J. R. Ice in the lunar polar regions. J. Geophys. Res. 84, 5659–5668 (1979). Spudis, P. D., Plescia, J., Josset, J.-L. & Beauvivre, S. Geology of Shackleton Crater and the south pole of the Moon. Geophys. Res. Lett. 36, L14201, http://dx.doi.org/ 10.1029/2008GL034468 (2008). Nozette, S. et al. The Clementine bistatic radar experiment. Science 274, 1495–1498 (1996). Stacy, N. J. S., Campbell, D. B. & Ford, P. G. Arecibo radar mapping of the lunar poles: a search for ice deposits. Science 276, 1527–1530 (1997). Campbell, D. B., Campbell, B. A., Carter, L. M., Margot, J.-L. & Stacy, N. J. S. No evidence for thick deposits of ice at the lunar south pole. Nature 443, 835–837 (2006). Simpson, R. & Tyler, G. L. Reanalysis of Clementine bistatic radar data from the lunar south pole. J. Geophys. Res. 104, 3845–3862 (1999). Nozette, S. et al. Integration of lunar polar remote-sensing data sets: evidence for ice at the lunar south pole. J. Geophys. Res. 106 (E10), 23253–23266 (2001). Haruyama, J. et al. Lack of exposed ice inside lunar south pole Shackleton crater. Science 322, 938–939 (2008). Smith, D. E. et al. The Lunar Orbiter Laser Altimeter investigation on the Lunar Reconnaissance Orbiter mission. Space Sci. Rev. 150, 209–241 (2010). Smith, D. E. et al. Results from the Lunar Orbiter Laser Altimeter (LOLA): global, high resolution topographic mapping of the Moon. Lunar Planet. Sci. Conf. XLII, 2350 (2011). Mazarico, E. et al. Orbit determination of the Lunar Reconnaissance Orbiter. J. Geod. 86, 193–207 (2012). Sun, X. et al. The Laser Ranging Subsystem on the Lunar Reconnaissance Orbiter. Report No. GSC-15884-1 (NASA New Technology Report, Washington DC, 2009). Zuber, M. T. et al. The Lunar Reconnaissance Orbiter laser ranging investigation. Space Sci. Rev. 150, 63–80 (2010). Neumann, G. A., Rowlands, D. D., Lemoine, F. G., Smith, D. E. & Zuber, M. T. Crossover analysis of MOLA altimetric data. J. Geophys. Res. 106 (E10), 23753–23768 (2001). Thomson, B. J. et al. The interior of Shackleton crater as revealed by Mini-RF orbital radar. Lunar Planet. Sci. Conf. XLII, 1626 (2011). Pike, R. J. in Impact and Explosion Cratering (eds Roddy, D. J., Pepin, R. O. & Merrill, R. B.) 489–509 (Pergamon, 1977). Squyres, S. W. et al. Exploration of Victoria crater by the Mars Rover Opportunity. Science 324, 1058–1061 (2009). Wilhelms, D. E., Howard, K. A. & Wilshire, H. G. Geologic Map of the South Side of the Moon (Map I-1162, US Geological Survey, 1979). Ward, W. R. Past orientation of the lunar spin axis. Science 189, 377–379 (1975). Howard, K. A. Fresh lunar impact craters — review of variations with size. In Proc. 5th Lunar Sci. Conf. 61–69 (Pergamon, 1974). Pike, R. J. Depth/diameter relations of fresh lunar craters: revision from spacecraft data. Geophys. Res. Lett. 1, 291–294 (1974). Hapke, B. Space weathering from Mercury to the asteroid belt. J. Geophys. Res. 106 (E5), 10039–10073 (2001). Zimmerman, M. I. Farrell, W. M., Stubbs, T. J., Halekas, J. S. & Jackson, T. L. Solar wind access to polar craters: feedback between surface charging and plasma expansion. Geophys. Res. Lett. 38, L19202, http://dx.doi.org/10.1029/ 2011GL048880 (2011). Kwok, R., Cunningham, G. F., Zwally, H. J. & Yi, D. ICESat over Arctic sea ice: Interpretation of altimetric and reflectivity profiles. J. Geophys. Res. 111, C06006, http://dx.doi.org/10.1029/2005JC003175 (2006). Pieters, C. M. et al. Character and spatial distribution of OH/H2O on the surface of the Moon seen by M3 on Chandrayaan-1. Science 326, 568–572 (2009). Gladstone, G. R. et al. Far-ultraviolet reflectance properties of the Moon’s permanently shadowed regions. J. Geophys. Res. 117, E00H04, http://dx.doi.org/ 10.1029/2011JE003913 (2012).
Supplementary Information is linked to the online version of the paper at www.nature.com/nature. Acknowledgements The LOLA investigation is supported by the Lunar Reconnaissance Orbiter Mission under the auspices of NASA’s Exploration Systems Mission Directorate and Science Mission Directorate. We thank T. Perron for discussions. Author Contributions M.T.Z. led and participated in all aspects of the analysis and wrote the paper. J.W.H. oversaw the relative age dating analysis and participated in geologic interpretation of topography, slopes and roughness. D.E.S. led the acquisition and correction of the LOLA observations. G.A.N. led the slope and roughness analysis and contributed to the development of the topographic grid. E.M. performed refined orbit adjustments and led the analysis of illumination. A.R.T. and C.I.F. performed the crater counts used in the relative age date analysis. O.A. and M.A.R. contributed to the analysis and interpretation of slopes and roughness. H.J.M. contributed to the interpretation of the crater morphology in the context of Shackleton’s geological history and volatile sequestration. Author Information Reprints and permissions information is available at www.nature.com/reprints. The authors declare no competing financial interests. Readers are welcome to comment on the online version of this article at www.nature.com/nature. Correspondence and requests for materials should be addressed to M.T.Z. (
[email protected]). 2 1 J U N E 2 0 1 2 | VO L 4 8 6 | N AT U R E | 3 8 1
©2012 Macmillan Publishers Limited. All rights reserved
RESEARCH LETTER METHODS The Lunar Orbiter Laser Altimeter (LOLA), an instrument aboard the Lunar Reconnaissance Orbiter (LRO) spacecraft, outputs five beams per laser pulse that are backscattered from the lunar surface and detected in the instrument’s receiver. The relevant measurement is the time of flight of each individual laser pulse, which can be converted to a range of the spacecraft to the lunar surface given knowledge of the position of the spacecraft with respect to the Moon’s centre of mass. The timing of LOLA instrument events was derived from the LRO ultrastable oscillator, which is monitored by ground tracking stations. Time systems on board LRO used Coordinated Universal Time (UTC) to correlate spacecraft Mission Elapsed Time (MET) to ground time. The analysis of LOLA data used Barycentric Dynamical Time as its primary time system. Spacecraft states relative to the Solar System Barycentre (SSB) at the laser transmit and detector receive times were projected along the instrument boresight and return path vectors to match the observed time of flight, correcting for the aberration of light and general-relativistic time delays. SSB states were determined in the Earth Mean Equator of 2000 (J2000) inertial reference frame using lunar spacecraft trajectories and the DE421 planetary ephemeris28 During its lunar mapping mission, the LRO spacecraft is tracked using S-band Doppler and range data by the Universal Space Network, Deep Space Network and White Sands Missile Range. The precise reconstruction of LRO orbits used Doppler tracking observations from these stations as well as laser ranging to LRO14 from the Goddard Space Flight Center and participating members of the International Laser Ranging Service. Precision orbit determination was accomplished using the NASA/Goddard Space Flight Center’s GEODYN system of programs29 using the GLGM-3 gravity model30 as a reference. GEODYN numerically integrates the spacecraft Cartesian state and force-model partial derivatives by employing a high-order Cowell predictor-corrector model. In addition to a model of the lunar gravity field, the force modelling included point mass representations for the Sun and planets. Solar radiation pressure, measurement and timing biases, and tracking station coordinates were also estimated. Radial range errors were minimized by geometric adjustment of altimetric tracks within the study area. In practice, profiles of one-way range from the LOLA instrument to the lunar surface along the spacecraft ground track were converted to lunar radius at each bounce point using the reconstructed orbit of LRO. Topography (Fig. 1a) was determined by subtracting a sphere of 1,737.4 km from each radius measurement. Topographic measurements were binned and interpolated within a 40 km 3 40 km area at 10-m spatial resolution.
The LOLA digital elevation model (DEM) used in this analysis was combined with a lunar ephemeris31 to characterize the solar illumination conditions of Shackleton and surroundings (Fig. 1b). A polar gnomonic projection on which great circle paths plot as straight lines was applied to the DEM to calculate lighting conditions that are accurate over geological timescales. The confluence of orbit ground tracks in the vicinity of the lunar poles, combined with LOLA’s multi-beam profiling capability, permitted slopes over a range of baselines and directions to be determined. In this study, slopes (Fig. 1c) were calculated from a two-laser-spot fit at 20–50-m length scales. In similar fashion, RMS roughness (Fig. 1d) was calculated as a standard deviation about a plane fitted by least-squares to two laser shots along-track, from which at least four valid spots were returned out of a possible total of ten. The plane had dimensions of 90–100 m in the longest axis and 10–40 m in the shortest axis, depending on the positions of the spots returned. An independent measure of surface roughness, discussed in Supplementary Information and shown in Supplementary Fig. 2, used the spreading in time of backscattered pulses. The spreading of LOLA’s backscattered pulses provides a measure of the RMS roughness of the surface at a smaller scale—the 5-m diameter of the laser footprints on the lunar surface. As with plane-deviation roughness shown in Fig. 1d, the pulse-spread-derived roughness featured a correction for local slopes. The ratio of returned to transmitted pulse energy is a measure of surface reflectance at the laser wavelength of 1,064 nm. The transmitted and returned pulse energies were measured by integrating the area under the pulses. LOLA’s measurement of reflectance is calibrated only in a relative sense, with respect to pre-launch testing, as the instrument lacks a source with known brightness in flight. Observations of reflectance were derived from LOLA tracks crossing Shackleton and environs from day of year 130–149 2010, which represented the most favourable time period for stable reflectance measurements due to the geometry of spacecraft terminator crossings. 28. 29. 30.
31.
Folkner, W. M., Williams, J. G. & Boggs, D. H. The Planetary and Lunar Ephemeris DE421 (Jet Propulsion Laboratory, Pasadena, 2008). Pavlis, D. E., Poulouse, S. G. & McCarthy, J. J. GEODYN Operations Manuals (SGT, Inc., Greenbelt, 2009). Mazarico, E., Lemoine, F. G., Han, S.-C. & Smith, D. E. GLGM-3, a degree-150 lunar gravity model from the historical tracking data of NASA Moon orbiters. J. Geophys. Res. 115, E05001, http://dx.doi.org/10.1029/2009JE003472 (2010). Williams, J. G., Boggs, D. H. & Folkner, W. M. Lunar Orbit, Physical Librations and Surface Coordinates (Jet Propulsion Laboratory, Pasadena, 2008).
©2012 Macmillan Publishers Limited. All rights reserved