European Research in Mathematics Education I: Group 2
189
CONSTRUCTING MEANING FOR FORMAL NOTATION IN ACTIVE GRAPHING 1
1
2
Janet Ainley , Elena Nardi , Dave Pratt
Mathematics Education Research Centre, University of Warwick, CV4 7AL Coventry U.K.
[email protected] 2 University of Oxford, 15, Norham Gardens, OX2 6PY Oxford, U.K.
[email protected]
Abstract: Active Graphing has been proposed as a spreadsheet-based pedagogic approach to support young children’s construction of meaning for graphs, particularly as a tool for interpreting experiments. This paper discusses aspects of a detailed study, illustrating how Active Graphing emerges as a facilitator of the children’s passage from a vague realisation of relationships to the articulation of rules and finally the construction of formulae. Keywords: -
1.
Background
This paper will present aspects of research on primary school children’s use and interpretation of graphs, within the Primary Laptop Project (see Pratt & Ainley, 1997, for a detailed description of this project). We have discussed elsewhere the development of a computer-based pedagogic approach, termed Active Graphing, which may help children to develop such interpretative skills (Pratt 1994, 1995). Briefly,
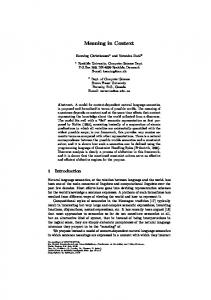
Fig. 1: A model of Active Graphing
http://www.fmd.uni-osnabrueck.de/ebooks/erme/cerme1-proceedings/cerme1-proceedings.html
European Research in Mathematics Education I: Group 2
190
children enter experimental data directly into a spreadsheet, and are able to graph this data immediately in order to look for trends and make decisions about what further data to collect. The physical experiment, the tabulated data and the graph are brought into close proximity. The significance of such proximity is strongly suggested by evidence from studies of data-logging projects (for example Brasell, 1987). The ability to produce graphs during the course of an experiment enables the graph to be used as an analytical tool for making decisions about future trials (Figure 1). In the current study (funded by the Economic and Social Research Council) we are mapping out the ways in which 8 and 9 year-olds work through the Active Graphing process in activities in which they have to move between working with the experiment to collect data, tabulating the data on a spreadsheet, and producing and reading graphs. We are analysing the process of negotiation as the children draw on their pre-conceived expectations and their interpretations of the different modalities of Experiment, Data and Graph (the EDG triangle). We focus here on one aspect of this process which has emerged from the analysis: the ways in which children began to use, and to construct meaning for, the formal notation of the spreadsheet through interactions with the vertices of the EDG triangle (see Ainley, 1996, for preliminary work in this area).
2.
Method
To explore the Active Graphing approach in more detail, we designed a sequence of four activities, re-using some from earlier phases of the research. The activities were designed to combine a range of features, one of which was the accessibility of the underlying mathematical structure. In this paper we use data from two activities which we shall refer to as Display Area (Act II) and Sheep Pen (Act IV). In Display Area, the children are asked to make a rectangular frame from a 75 cm length of ribbon, into which they can fit as many miniature pictures as possible: i.e. they are asked to find the rectangle with maximum area for a perimeter of 75 cm. This activity arose as part of a project about Tudors: hence the interest in miniatures. In Sheep Pen, the children are asked to design a rectangular sheep pen using 39 m of fencing, to be set against a wall, that would hold as many sheep as possible: i.e. they are http://www.fmd.uni-osnabrueck.de/ebooks/erme/cerme1-proceedings/cerme1-proceedings.html
European Research in Mathematics Education I: Group 2
191
asked to find the rectangle with maximum area when one length and two widths of this rectangle total 39 m. They modelled this using 39 cm straws. Both activities produce similar graphs, in which the maximum value is found from a parabola. In each, the relationship between the length and the width of the rectangle is 75 - 2 w for accessible to the children and amenable to algebraic modelling (e.g. l = 2 Display Area , and l=39-2w for Sheep Pen). The children recorded the results from each experiment on spreadsheets which (with help) they had set up to calculate the area of the rectangle, and made x-y scattergraphs of the width or length of the display area or sheep pen against its area. They were encouraged to make graphs frequently, and to discuss amongst themselves their ideas about the results so far, as well as to decide on what to do next in the experiment. Each activity was used during one week with a class of 8 and 9 year olds, led by the class teacher, with a gap of around two weeks between activities. The children worked on the activity in small groups in sessions lasting up to two hours. For organisational reasons, the class was split into two halves, working on the activity on alternate days: thus each group worked for two sessions on each activity. The researcher (the second-named author) observed the work of four girl-boy pairs (two from each half of the class) using audio tape to record their conversations as they worked. She also recorded regular informal interviews reviewing their progress. There was a closing session at the end of each week’s work, in which each group presented their work to the class: this session was also recorded. The data consist of the recorded sessions, the children’s work and field notes. Selected parts of the recordings were transcribed and these were combined with data from the field notes and examples of children’s work to produce extended narrative accounts, describing the work of each pair on each activity. Significant learning incidents, varying in size and content, were then extracted and categorised. From this analysis emerged two broad themes: constructing meaning for trend, and constructing meaning for formal notation.
http://www.fmd.uni-osnabrueck.de/ebooks/erme/cerme1-proceedings/cerme1-proceedings.html
European Research in Mathematics Education I: Group 2
3.
192
Analysis
We use the term formalising to encapsulate three categories of activity which we observed as contributing to the construction of meaning for formal notation: • connecting a pattern based on the data with the experiment, • connecting a pattern based on the data with a rule, and • connecting a rule based on the data with a formula.
Our use of the word ‘pattern’ here is deliberately a little ambiguous, referring sometimes to an obvious numerical pattern, and sometimes to a fixed relationship between numbers. We will exemplify formalising by providing extracts from the data before discussing links with other themes in the research.
4.
Connecting a pattern based on the data with the experiment
In both activities, the formula for the area was introduced in the beginning with the help of the teacher, so the notion of such a formula was familiar to the children. In Display Area the children began by working with a 75 cm length of ribbon, and pinning out rectangles on a display board. This naturally led to some inaccuracies as ‘imperfect’ rectangles were produced, although the children were not initially aware of this. Later the children went through a period of growing realisation that the length and the width are somehow interrelated. Consider this incident from work on Display Area . (Note: all boxed items are extracts from the data. The first person refers to the researcher. Numerical inaccuracies in these extracts are due to difficulties in making measurements, or to hasty calculations.) I ask Laura and Daniel whether their measurements have become more accurate. I observe how they are doing it and notice they are fixing the length. I ask them whether they can find out the width given the length. Daniel does the 23-length case: he doubles 23 and then the pair notice that their measurement of 16 cm for the width makes the perimeter 76 cm. They measure the 23 cm sides and the other comes out as 15.5 cm, so they record 15.5 cm as the width. (ACT II: session 1)
http://www.fmd.uni-osnabrueck.de/ebooks/erme/cerme1-proceedings/cerme1-proceedings.html
European Research in Mathematics Education I: Group 2
193
At this stage the children are deciding on (fixing) the length of the rectangle, but still measure the width. However they are not totally unaware of the interdependence of the two measures. When asked to predict the width if the length is given, Daniel starts by doubling the given length but then is distracted by the realisation that the previous measurement had been inaccurate. However, after several trials of the experiment, the children gradually saw the width-length relation more clearly and began to connect patterns based on the data with a rule.
5.
Connecting patterns based on the data with a rule.
The following example from Display Area, begins with an attempt to correct or ‘normalise’ the appearance of the graph: we use the term normalising to describe this kind of behaviour, which emerged as a feature of the children’s work on all four activities. The teacher (T in the transcript), who has experience in working on similar activities, recognises an opportunity to intervene to extend Chris’ and Claire’s thinking. The children’s concern with normalising the graph leads to a realisation of how to calculate the width of a rectangle when given the length. Although Claire uses this calculation as a correcting procedure, applied to experimental data, she is still unaware of its potential as a data-generating tool.
400
300 a r e a
width (cm) 200
100 20
30 length [cm]
length (cm)
area
14
24
6.5
30.5
336
16
22
352
15.5
22
341
16.5
22
363
198.25
40
http://www.fmd.uni-osnabrueck.de/ebooks/erme/cerme1-proceedings/cerme1-proceedings.html
European Research in Mathematics Education I: Group 2
Cl
ahhh...wicked...
T Cl
What’s happening there? ... it’s doing a real pattern there
T
Why have you got three crosses all in a row - in a column rather?
[ ... ] Cl
Maybe it’s because we’ve got twenty two twenty two twenty two ...
T
Ahh!
[ ... ] Ch
... it’s the measurement...
Res T
Do you think it’s a problem? Well, ... just have a look at that rectangle ... rectangle with a question mark!
Ch
Ah, I know ... it’s ... it’s not ... isn’t it not right angles?
T [ ... ]
What do you think?
Cl
I didn’t understand why it was still twenty two twenty two twenty two so...
Ch [ ... ]
Sixteen, fifteen and a half and sixteen and a half
Cl
Let’s go back to these then ... shall we delete four, five and six?
194
Claire means rows 4, 5 and 6 on the spreadsheet. Ch
... can we measure this one again to see what that actual one is - it’s sixteen and a half yes delete them two...
Res
How are you going to choose which one to delete?
[ ... ] Res
Can you tell me how much this is going to be? If this is twenty two how much is the other? ... How would you find it?
Cl Res
Let’s measure... Can you do it in your head, Chris? ... How would you find it out?
Cl
Twenty two add twenty two is ... that’s forty four then you err then you have to try and make seventy five.
Res
OK, so how do you make seventy five from forty four ?
Ch
Forty four ... ohh I think I get it - what you do is ..
Cl
Twenty one
Res
Thirty-one
Ch
Oh yeah
[... checking calculation]
http://www.fmd.uni-osnabrueck.de/ebooks/erme/cerme1-proceedings/cerme1-proceedings.html
European Research in Mathematics Education I: Group 2
195
Res
So then these two things would be thirty one what would each be?
Cl Res
...fifteen times two equals thirty, sixteen times two equals thirty two We have thirty one though, OK?
Cl
I don’t know.
Res Ch
It’s very close what you are saying. If we have, this is twenty two and this twenty two and this is forty four so these two are thirty one both of them so how much each? Divide it -
Cl
ahh so it’s fifteen and a half
Res Cl
Excellent so this is how to choose which one... Now I get it! That one is right but these two aren’t.
As this activity developed, the children demonstrated firmer knowledge of the width/length relationship, especially when asked to check the accuracy of their measurements. They added two widths and two lengths and if the result was 75 they accepted the measurement: if not, they didn’t. However, the construction of an inverse process (given the length and the perimeter, find the width) is less straightforward. The following example is from session 2. While trying to make the 19x19 square out of 75 cm, Laura realises that there doesn’t seem to be enough string for the four angles of their quadrilateral to be right angles. L
So we need to make it smaller! Instead of 19, make it 18!
D
Then the width has to be 20. (ACT II: session 2)
As the children’s confidence in articulating their rules developed, the teacher again used this as a signal that she could intervene to move them towards the idea of using a formula to generate data.
http://www.fmd.uni-osnabrueck.de/ebooks/erme/cerme1-proceedings/cerme1-proceedings.html
European Research in Mathematics Education I: Group 2
WIDTH
LENGTH
196
AREA
15
23
345
7
30.5
213.5
14 16
23.5 21
329 336
6.5
31
201.5
11.5
26
299
Eli and Tarquin are busy using a rule to correct their measurements. The teacher joins in and asks what they have been doing. Eli explains the 26 case and also the previous 31 case. They explain how they get from width to two widths minus from the perimeter and then divided by two. After a discussion in which Tarquin confuses area with perimeter in his calculations, the teacher says she wonders whether they can find any other way of doing the calculation automatically. Tarquin mentions ‘formula’ but cannot say more. The teacher lets them go on. (ACT II: session 1)
Using their experience from Display Area, most of the children moved swiftly towards looking for a rule in Sheep Pen. The following example is from an early stage of Chris’ work on the new activity. I ask them to prepare a sheep pen for demonstration and save their file. Chris shows me why the width-29.5 sheep pen is impossible. Ch
You can’t because you have to double the 29.5. (ACT IV: session 1)
Laura and Daniel both claim at this stage: “we don’t have to make them” because “we’ve got a pattern”. The following incident confirms the clarity with which Laura and Daniel ‘see’ the relationship between the length and the width of the sheep pen. When the teacher set up the activity initially, a length of 41m of fencing was chosen for the sheep pen, but this was later changed to 39m. The children instantly suggest “taking 2 out of 41” because “If it’s 41, if it’s going to be 39 we are going to go 41, 40, 39 we are going to take two off everything so that makes that ...”. (ACT IV: session 1)
http://www.fmd.uni-osnabrueck.de/ebooks/erme/cerme1-proceedings/cerme1-proceedings.html
European Research in Mathematics Education I: Group 2
197
Connecting their initial sense of a pattern with a rule they can articulate becomes gradually more overt. It is the beginning of Activity IV for Laura and Daniel and they have chosen to start from width of 4 cm. Laura then suggests their choice of widths follows a pattern: ‘increase it by a half cm. So the next is 4.5 cm’. Res L
So, if you have 4.5 what’s gonna happen then? It’s gonna be thirty the...in the 3s...
Res
So this is 4.5 and this is going to be?
D
That’s going to be 32!
Res
Clever, how did you do that?
D The first one was 4 and then it’s 4.5 then both sides you take off a whole. (ACT IV: session 1)
6.
Connecting a rule based on the data with a formula
The process of constructing the width-length formula and putting it into use was an extended one for most pairs of children, and it is not possible to include extracts of such discussion here (detail of a similar incident can be found in Ainley (1996)). The teacher typically intervened with the suggestion that the children might ‘teach the spreadsheet’ their rule, once she felt they could articulate their rule clearly. At this point the teacher and/or the researcher were prepared to offer some help to the children in translating their rule into formal notation. The example below shows the confidence with which Laura and Daniel were able to work systematically which such a formula to generate data in Sheep Pen. At this stage their spreadsheet contains three formulae. In the ‘Area’ column they have their original formula to multiply length by width. In the ‘Width’ column they have a formula to add .5 to the previous cell, so that they can increment the width by half a centimetre each time. They realised that there is a pattern in how the length changes when the width changes, and originally they used an iterative rule “increasing the width by a half cm decreases the length by 1 cm”, and entered the appropriate formula in the ‘Length’ column. After some discussion with other groups they decided to change their approach.
http://www.fmd.uni-osnabrueck.de/ebooks/erme/cerme1-proceedings/cerme1-proceedings.html
European Research in Mathematics Education I: Group 2
198
Later in the day, and once the children have introduced the spreadsheet formula, =39-2*F2, in order to connect the lengths in column E to the widths in column F, they decide to refine their measurements and generate data for an increment of a quarter for the width. Laura says that all they have to do is replace the ‘sign for a half’ with ‘the sign for a quarter’. The discussion leads to deciding that .25 is the sign for a quarter and Laura says: L
So we have to put plus .25.
Res
I think you have got the idea very well so can we see it: please, shall we start from 4?
D L
Can we do the wholes? We’ve done the wholes!
Res
Because you start with halves: if you put half and half again you have a whole.
They insert the .25 formula. Daniel looks as if he is really clear about it but Laura does not. I ask her and she says: L
When the pattern comes up it will come to me.
D
It’s a different language, Laura, it’s a different language! They fill down the width column. Res
Can you tell me now, are you filling down? Good.
L
4.25, 4.5, 4.75 and then it does it again, it’s repeating itself! What do you mean repeating itself?
Res L
Length
Width
Area
31
4
30.5
4.25
30
4.5
29.5
4.75
29
5
28.5
5.25
124 129.625 135 140.125 145 149.625
28
5.5
27.5
. . .
5.75
. . .
158.125
154
1.5
18.75
28.125
. . .
1
19
19
0.5
19.25
9.625
0
19.5
0
4.25, 4.5, 4.75, 5, 5.25, 5.5, 5.75 so it’s like in a pattern.
(ACT IV: session 1)
7.
Constructing meaning for trend and for formal notation
Despite the initial perception of constructing meanings for trend and for formal notation as two distinct analytical themes, it has gradually become possible to view them as interrelated. In the three observed categories of formalising activity mentioned above, the children began with a vague but increasingly persistent notion of the dependence of length on width. As their work progressed they proceeded to specify this
http://www.fmd.uni-osnabrueck.de/ebooks/erme/cerme1-proceedings/cerme1-proceedings.html
European Research in Mathematics Education I: Group 2
199
dependence: twice the length plus twice the width should always make 75 cm, or estimating that for a width of 20 cm, length should be around 18 cm (Display Area). However these observations did not yet lead to the realisation that the length could actually be calculated from a given width. After numerous repetitions of the experiment and the evolution of their attempts to articulate a rule to express relationships (patterns) in the data, the idea of the formula arose as a natural step in which children understood both the structure of the formula, and its utility (see Pratt and Ainley 1997). The children often reached this realisation in the context of checking whether the experimental data were accurate. As their sense of meaning for trend became more firmly established, they became more aware of points on the graph which seemed to be in the wrong place, that is, they did not fit with the trend. In a number of cases, the children recognised ‘impossible’ situations in a graph, or a set of data. An example of this was given earlier in this paper, when Claire and Chris realised that the three crosses in a vertical line on their graph could not be correct, as they represented three display areas with the same length but different widths. Perceived abnormalities in the graph such as these prompted children to check their data. In their efforts to normalise the graph or the data, they consolidated the notion of dependence between length and width. This consolidation accelerated their move towards formal notation. As the teacher became increasingly aware of normalising, she was able to recruit it as an intervention strategy, drawing children’s attention towards discrepancies in the hope of moving them towards formalising. Elsewhere we have described the data relating to constructing meaning for trend in terms of interactions with the EDG triangle (Ainley, Nardi & Pratt, 1998). In order to describe constructing meaning for formal notation, it is necessary to add the Formula as a fourth modality. The richest episodes in our data exemplifying the construction of meaning for trend are characterised by intense interaction between the graph and the data and between the graph and the experiment. Similarly, the richest episodes in our data relating to formalising are characterised by the intensity of the data-formula interaction. In both cases the most powerful learning incidents seem to occur where there is more interaction among the different modalities. We conclude that meanings do not emerge exclusively within any one of the four modalities, but are gradually established through constant interaction between them http://www.fmd.uni-osnabrueck.de/ebooks/erme/cerme1-proceedings/cerme1-proceedings.html
European Research in Mathematics Education I: Group 2
200
(see Nemirovsky & Rubin (1991)). In such interactions we commonly see children using patterns of language which draw on one modality, whilst working with another (see Ainley, Nardi & Pratt 1(998)). Nemirovsky (1998) terms such “talking and acting without distinguishing between symbols and referents” as fusion, which he sees as an expression of fluency in symbol use. In the activities we have described here, formal notation emerges as another, and particularly powerful way, of making sense of the phenomena. Children not only have opportunities to become familiar with the symbols of formal notation, but also experience their utility in describing the patterns they have observed within the experimental situation, and within the data, and in generating data to produce accurate graphs. As Active Graphing clearly encourages the interaction between different modalities, it emerges as an approach with high potential to encourage such fluency.
8.
References
Ainley, J., Nardi, E. & Pratt, D. (1998): Graphing as a Computer Mediated Tool. In A. Olivier & K Newstead (eds.), Proceedings of the 22nd Annual Conference of the International Group for the Psychology of Mathematics Education, Vol. 1 (243-258), Stellenbosch, South Africa. Ainley, J. (1996): Purposeful Contexts for Formal Notation in a Spreadsheet Environment. Journal of Mathematical Behavior, 15(4) Brasell, H. (1987): The Effect of Real-Time Laboratory Graphing on Learning Graphic Representations of Distance and Velocity. Journal of Research in Science Teaching 24 Nemirovsky, R. & Rubin, A. (1991): “It Makes Sense If You Think About How The Graphs Work. But In Reality ...”. In F. Furunghetti (ed.) Proceedings of the 15th Annual Meeting, North American Chapter of the International Group for the Psychology of Mathematics Education. Nemirovsky, R. (1998): Symbol-Use, Fusion and Logical Necessity: on the Significance of Children’s Graphing. In A. Olivier & K Newstead (Eds.), Proceedings of the 22nd Annual Conference of the International Group for the Psychology of Mathematics Education, Vol. 1 (259-263), Stellenbosch, South Africa Pratt, D. (1994): Active Graphing in a Computer-Rich Environment. In J. P. da Ponte & J. F. Matos (eds.), Proceedings of the 18th Annual Conference of the International Group for the Psychology of Mathematics Education, University of Lisbon, Portugal Pratt, D. (1995): Young Children’s Active And Passive Graphing. Journal of Computer Assisted Learning, 11 Pratt, D. & Ainley, J. (1997): The Design of Activities for the Abstraction of Geometric Construction. International Journal of Computers for Mathematical Learning, 1 (3)
http://www.fmd.uni-osnabrueck.de/ebooks/erme/cerme1-proceedings/cerme1-proceedings.html