Constructing Parallel Coordinates Plot for Problem Solving Gennady Andrienko and Natalia Andrienko GMD - German National Research Center for Information Technology Schloss Birlinghoven, Sankt-Augustin, D-53754 Germany Tel: +49-2241-142329 Fax: +49-2241-142072 E-mail:
[email protected] URL http://borneo.gmd.de/and/
Abstract The paper reports about authors’ investigation of applicability of a well-known technique of visualization of multivariate data, parallel coordinates plot, to different kinds of tasks. Some new methods of transformation of parallel coordinates plots are suggested. However, the primary aim of the authors is “to link tools to tasks”, i.e. to explicitly define the tasks that can be appropriately supported by this technique and to find what of the possible transformations of parallel coordinates plot are useful for each of the tasks.
Keywords Parallel coordinates plot, interactive graphics, linked displays, exploratory data analysis
1. INTRODUCTION Exploratory data analysis is greatly supported by visualization [7]. There are two different paradigms in designing and applying visualizations [18]: 1.
Design visualization and interaction tools suited to a specific problem.
2.
Create problem- and domain-independent software that can produce various visualizations depending on characteristics of data by applying the general principles of graphics [6].
Usually, the second paradigm applies the expert systems technology. This involves explicit representation of knowledge about data, different types of graphics, and their applicability (see [14,17,2]). Some systems also apply knowledge about possible user’s tasks and appropriateness of visualization methods or graphical elements to the tasks [8,16]. However, the tasks dealt with are very general and primitive: lookup, search, compare etc. In contrast, the first paradigm is less universal, but allows building more sophisticated visual presentations that better match user’s needs. Our work goes mostly along the second paradigm. We developed a knowledge-based system Descartes that automatically designs interactive cartographic representations of spatially referenced attribute data. The system takes into Permission to make digital or hard copies of all or part of this work for personal or classroom use is granted without fee provided that copies are not made or distributed for profit or commercial advantage and that copies bear this notice and the full citation on the first page. To copy otherwise, or republish, to post on servers or to redistribute to lists, requires prior specific permission and/or a fee. Smart Graphics ’01, March 21-23, 2001, Hawthorne, NY. Copyright 2001 ACM 1-58113-000-0/00/0000…$5.00.
account characteristics of the data and relationships between attributes [2]. Now we are extending our system so that it could also account for the current user’s task. We set an ambitious goal of bridging the gap between the two paradigms. On the one hand, we want to go beyond the typically considered primitive tasks and handle a more comprehensive set of tasks. On the other hand, we want our system to be able to select and configure interactive data analysis tools rather than merely design graphics. One of the activities we undertake in order to approach our goal is experimentation with various kinds of interactive displays. The aim of this is to gain knowledge about what tasks can be supported by these displays. One of the types of display we investigate is parallel coordinates plot [10], a well-known method of representation of multivariate data. Parallel coordinates plot has been in the focus of attention of many researchers (see, for example, [5, 11, and 19]). They suggested a number of ways the user can manipulate the display in order to facilitate data analysis: • •
change the order of the attribute axes; filter the data by imposing constraints on the value range of some attribute(s) or on the angle of lines connecting a pair of attributes; • remove selected lines from the plot; • classify the objects by breaking the value range of some attribute into subintervals and paint the lines in different colors according to which class the objects fit; • link the plot to other displays, in particular, apply the same coloring to representation of the same objects in the other displays (this technique is known as “brushing”); • scale the plot horizontally and vertically Unfortunately for our enterprise of linking tools to tasks, the advocates of these manipulations and transformations do not explicitly state what tasks these operations can support. It is only generally declared that interactive parallel coordinates plot can be used for overview of data [19] or “visual data mining”, finding “interesting” data samples [11]. Therefore we decided to investigate by our own the potential of various transformations of the plot in order to arrive at more precise formulation of tasks they can support or problems they can help to solve. In particular, we have focused on scaling. To our opinion, just arbitrary scaling of attribute axes may be confusing rather than productive for data exploration. Hence, we tried to find what methods of scaling make sense for what purposes. As a result of our investigation, we revealed a number of tasks parallel coordinates plot may support and related these tasks to appropriate methods of manipulation. The tasks are: observation of characteristics of objects, comparison of objects, exploration of relationships between attributes, search for objects similar to a given specimen, classification of objects
according to similarity to given representatives of two classes, and multi-criteria evaluation of objects. These tasks and the respective transformation methods will be described in the subsequent sections.
2. Investigation of characteristics of objects and relationships between attributes A parallel coordinates plot may have either horizontal or vertical orientation of the attribute axis. The orientation has no influence on interpretation of the plot and its use. In our implementation the axes are horizontal and placed one below another. In the standard form of parallel coordinates plot the leftmost position of each axis corresponds to the minimum value of the respective attribute, and the rightmost to the maximum value. The leftmost and the rightmost positions of the axes are aligned (see Figure 1). The plot is reactive to mouse operations. When the mouse points on some line, this line is highlighted, as in Figure 1. This gives an opportunity to estimate attribute values associated with the corresponding object and compare characteristics of this object to distribution of characteristics over the whole set of objects. Clicking on a line makes it permanently highlighted (until explicit cancellation). This enables pairwise comparison of the selected object with other objects. For this purpose the user needs to point on these objects with the mouse. The two objects being compared can be well distinguished as permanent and “mouse-on” types of highlighting differ in color. In our system a parallel coordinates plot may be dynamically linked to other displays such as a map or a scatter plot. This means that objects are highlighted simultaneously in all the displays when the user selects them in any of the displays. Due to this the user can explore the set of objects from many perspectives. Data exploration often involves tasks of comparison of attribute values for selected objects and comparison of value ranges of several attributes. Such tasks are usually relevant to cases when the attributes under investigation are comparable, i.e. measured in the same units and semantically related. Examples of such data are land cover or land use statistics, division of population
according to age groups, employment, or marital status, birth and death rates, etc. For the tasks of comparison of values and value ranges the standard form of the plot is inappropriate. The axes need to be scaled so that the same positions correspond to exactly the same number on all the axes. Such scaling is illustrated by Figure 2. The plot represents the same data as in Figure 1: percentages of people in three age groups (0-14 years, 15-64 years, and 65 and more years) in countries of Europe. It is well visible that the part of the middle-age population is bigger in all countries than parts of other age groups. Such an extreme case was selected in order to demonstrate clearly the difference of the suggested scaling method from the “standard” form of parallel coordinates plot. An important activity in exploratory analysis is investigation of relationships among attributes. It involves comparison of value variation of different attributes and seeking for correlation between attributes. A parallel coordinates plot can effectively support these tasks. Thus, if the lines between two neighboring axes are nearly parallel to each other, the attributes are positively correlated. If almost all the lines have either northeast to south-west or north-west to south-east orientation, the attributes are negatively correlated. Evidently, in order to detect such pairs of correlated attributes, the user should have an opportunity to change the order of the attribute axes. It may be also helpful to “flip” some of the axes. However, the canonic form of parallel coordinates plot may become inconvenient if the data contain outliers, i.e. values standing far apart from the bulk of values. Presence of outliers complicates the tasks of detecting correlated pairs of attributes as well as the tasks of comparison of objects. For such cases we suggest two methods of scaling of the axes [3]: •
normalization by median and quartiles;
•
normalization by mean and standard deviation.
The first variant of scaling is shown in Figure 3. The axes are positioned so that median values of all attributes are on the same vertical line and are scaled so that the first and the second quartiles are also aligned. Positions of the rest of the values are found by linear interpolation. In a similar way, in the second variant the values , -σ, and +σ are used for axes scaling (here is the arithmetic mean and σ is the standard deviation). This variant is shown in Figure 4. Besides neutralizing the impact of outliers, both variant of scaling are good for investigation of general characteristics of value variation. In our system the user can easily switch between different variants of scaling of parallel coordinates.
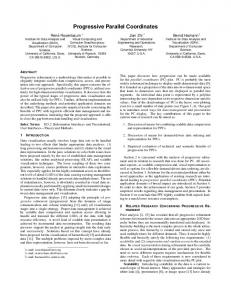
Figure 1. The standard form of parallel co-ordinate plot. The leftmost position on each axis corresponds to the minimum value of the respective attribute, the rightmost to the maximum. The leftmost and the rightmost positions of all axes are aligned; all axes have the same length.
Figure 2. Comparison of values of attributes. All attribute axes have a common scale.
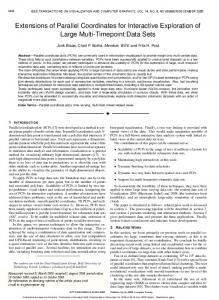
Figure 3. Scaling based on normalization by median and quartiles. Medians and quartiles are aligned.
Figure 4. Scaling based on normalization by mean and standard deviation. Mean values of all attributes are aligned. Scales of the axes are determined by standard deviations of the attributes.
3. Analysis of similarity between objects An interesting and useful kind of data analysis can be done on the basis of calculation of the degree of similarity, or distance between objects in the multidimensional attribute space. For example, a geologist may look for places with characteristics similar to those in a place of deposit of some mineral resources. A commercial company may look for sites similar to the site where it has good sales of its products. Analysis of similarity can also help in understanding of distribution of characteristics over a set of objects. We implemented several methods of calculation of distance between objects based on various types of metrics [9]. The results of calculation can be illustrated on a parallel coordinates plot containing, besides axes for the source attributes, an axis with the distances (Figure 5). The user should be able to find easily the line representing the reference object and to compare it with the lines of other objects. One possibility is to mark this particular line on the plot, for example, by different width or color, blinking etc. Another possibility is to transform the plot so that the reference line becomes straight. In the latter case all axes are shifted without changing their scales. A useful property of this representation is that it helps to understand and verify the results of distance calculation. The
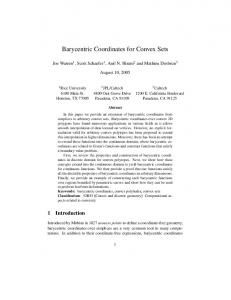
Figure 5. Distances in 3-dimensional attribute space to Germany are computed and presented in the map and the plot. The axes in the plot are aligned so that the line of Germany is straight. The order of the axes is changed to exhibit correlation between the distances and values of the attribute “AGE_1”. closer a line is to the straight reference line, the smaller is the distance to the reference object. The user has an opportunity to tune the method of calculation by setting up its parameters including the metrics to be used. Any change of the parameters immediately results in change of the appearance of the plot. Various measures for calculation of distances between objects in a multi-attribute space are described in [12]. However, the authors do not relate distance calculation to any kind of visualization. On the contrary, we focus on visualization that can help to understand the notion of distance and results of calculation.
4.
Classification by similarity
On the basis of calculation of distances one may do another exploratory data analysis task: classify objects into two classes represented by their samples. For example, a salesman can be interested to see whether different potential sites for expansion of the business are more similar to the site with good sales or to that with bad sales. The procedure of classification is done in the following way. For each object the system computes distances DI and DII to the given samples of the classes I and II. If for some object min(DI,DII)>d0, where d0 is some specified threshold, this object is not ascribed to any of the classes (it is too different from both samples). Otherwise, the object is included in the class I if DIDII. The user can select different
5.
Multi-criteria evaluation of objects
In general, visualization by parallel coordinates plot is applied when it is necessary to consider simultaneously multiple attributes (usually more than two). One of activities for which such situations are typical is multi-criteria decision making. Here attributes play as criteria by which objects (available options) are to be evaluated. Some researchers in the area of multi-criteria decision support suggest using parallel coordinates plot for representation of a decision space [15]. However, they did not try to investigate what transformations of parallel coordinates are necessary or would be helpful for the task of decision making. In constructing parallel coordinates plot for decision making two peculiarities of this process should be taken into account. First, two types of criteria need to be distinguished: benefit criteria (bigger values are better) and cost criteria (smaller values are better). Second, criteria may have different relative importance for the decision maker. In the variants of parallel coordinates plot we propose for decision making support the axes for benefit and cost criteria have different orientation: left to right vs. right to left (see Figure 7, the orientation is indicated by arrows). With such a solution, the best values of each attribute are always on the right, and the worst on the left. This makes it easy to estimate visually how good any specific option is: the closer to the right edge of the plot is a line, the better is the option.
Figure 6. Classification according to similarity to Germany (dark gray) and to Poland (light gray). White color means “too far from both classes”. Note different orientation of axes on the plot (indicated by dark arrows). metrics for computing distances as well as vary values of the parameters. The task of similarity-based classification may be also supported with a parallel coordinates plot. The plot contains axes for all source attributes, the distances to the classes I and II, and the results of classification. The latter are encoded by numbers: –1 stands for class I, 1 for class II, and 0 for nonclassified objects. The axes are transformed so that the lines for the two samples are straight (this is possible only if values of all attributes for these two objects are different). The scale of each axis is determined by the difference between the values of the attribute for sample I and sample II. The orientation of an axis may change to right-to-left in order to make the value for sample I be located on the left of that for sample II. The appearance of the plot is shown in Figure 6. The so transformed plot illustrates well the results of the classification. If some line lies close to the line of one of the samples, the corresponding object belongs to the class the sample represents. If some line differs very much from the lines of both samples, the object remains unclassified. In a case of analysis of geographically referenced data the results of classification are also represented on a map (see Figure 6). The objects are painted in different colors depending on whether they belong to class I, class II, or are unclassified.
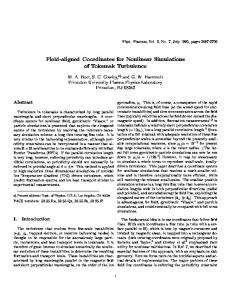
Difference in relative weights of criteria can be reflected by variation of lengths of the axes: the more important is a criterion, the longer is the corresponding axis (Figure 7 B, C). Due to this transformation lines of options surpassing others in more important criteria shift visually more to the right (“good”) pole of the plot. Two useful alignments of axes can be suggested: by left ends (Figure 7B) or by right ends (Figure 7C). The first variant of alignment supports comparison of performance of an option with the (imaginary) “worst possible case” by estimating how far from the left pole of the plot the line is. With the second variant of alignment one can estimate how close any particular option is to the “ideal” case (i.e. the case with the best values of all the attributes that usually does not exist in reality). Visual estimation of goodness of options can be reinforced by application of existing computational methods for multi-criteria evaluation. For example, an integrated score for an option may be found as the weighted average value of its performance according to each criterion (using the weights assigned to the criteria by the decision maker). Results of computation can be represented on the same parallel coordinate plot as the source data. Thus, in each of the three displays shown in Figure 7 the computed integrated scores are represented on the bottom axis, and the next axis above it reflects ranking of the options with respect to the scores received. Such combined display of source information and results of computation significantly helps in understanding and verification of the outcome of automatic evaluation. It also allows interactive analysis of sensitivity of the integrated scores to changes of the weights. When the user alters any of the weights, the scores are immediately recomputed, and the results are reflected in the plot. As in the previous cases, the plot may be linked to a map showing locations of the objects. The map may represent the integrated scores or the ranking of the options and change dynamically in parallel with changes in the plot.
(A)
(B)
(C)
Figure 7. Variants of a parallel coordinates plot supporting multiple criteria decision making. Axes for benefit criteria are oriented from left to right, and axes for cost criteria have the opposite direction. Highlighted are lines of 2 best options.
6.
Conclusion
We implemented the visualization by parallel coordinates plot in order to have an opportunity to apply it to different data and to find the tasks that can be effectively supported by this visualization method. We wanted also to experiment with different ways of manipulation of the plot and see what transformations are suitable for what tasks. In our exploration we came by a rather extensive list of tasks for which the use of parallel coordinates plot or some its modification appears appropriate: 1) survey of distribution of characteristics over a set of objects; 2) comparison of individual characteristics of an object to distribution of characteristics over the set; 3) pairwise comparison of objects; 4) comparison of values of attributes associated with a selected object; 5) comparison of value ranges of attributes; 6) comparison of variations of values of different attributes; 7) looking for correlation between attributes; 8) estimation of degree of similarity between objects;
9)
assignment of objects to one of two classes specified by selection of sample representatives; 10) multi-criteria evaluation of objects. We tested the following modifications of parallel coordinates plot: a) alignment with the common minimum and maximum; b) normalization by medians and quartiles; c) normalization by mean and standard deviation; d) straightening of the line of a selected object; e) straightening of the lines of two selected objects; f) variation of lengths of axes proportionally to relative importance of attributes. Most of the modifications involve linear transformation of the scales of the axes. The only exception is the normalization by median and quartiles. The distances from the median to each of the quartiles may differ and, hence, the left and the right parts of an axis are transformed differently. Besides the above-listed methods of transformation of scales, we considered two other operations: g) changing of the order of the axes; h) changing of direction of axes.
Table 1 shows the correspondence we established between the possible tasks and the methods of plot transformation supporting them. Table 1. Correspondence between data analysis tasks and methods of transformation of the parallel coordinates plot. a
b
c
1
•
•
2
•
•
d
f
g
•
•
4
•
•
5
•
•
6
•
•
•
7
•
•
•
8 9 10
h
• •
3
e
•
• •
• •
•
•
A very useful tool of data analysis is dynamic linking of a parallel coordinates plot to other graphics, including maps. Multiple linked displays give an opportunity to view data from different perspectives. We implemented two kinds of linking. The first is simultaneous highlighting of objects in different displays. The second type is linking to a dynamic query device [1]. With this device the user can specify constraints on attribute values. The objects that do not satisfy these constraints are filtered out of all the displays. In the future we plan to investigate which of the transformations we suggested for parallel coordinates plot are also applicable to time series plot, and vice versa, which transformations proposed for time plot [4] can be applied to parallel coordinates plot.
Acknowledgements The work described in the paper was partly supported by two European research grants: CommonGIS (“Common Access to Geographically Referenced Data”, Esprit project 28983, 19982001) and SPIN! (“Spatial Mining for Data of Public Interest”, IST Program, project No.IST-1999-10536, 2000–2002). We are grateful to our partners in these projects for fruitful discussions. The work of Dr. V. Gitis (IITP RAS) motivated our efforts on visualization of degrees of similarity. Prof. P. Jankowski (University Idaho) stimulated our interest to spatial decision support problems. Communication with Dr. H. Voss, Dr. A. Savinov, and P. Gatalsky (GMD) provided a creative atmosphere in the process of software development and testing.
References [1] Ahlberg, C., Williamson, C., and Shneiderman, B. Dynamic queries for information exploration: an implementation and evaluation. In Proceedings ACM CHI’92 (ACM Press), 1992, 619-626. [2] Andrienko, G. and Andrienko, N. Interactive maps for visual data exploration. International Journal Geographic Information Science, 13 (4), 1999, 355374. [3] Andrienko, G. and Andrienko, N. Exploring Spatial Data with Dominant Attribute Map and Parallel
Coordinates. Computers, Environment and Urban Systems, special issue on GIS Research UK'2000. 25, 2001 (accepted) [4] Andrienko, N., Andrienko, G., and Gatalsky, P. Visualization of Spatio-Temporal Information in the Internet. In A.M.Tjoa, R.R.Wagner, A.Al-Zobaidie (eds.) Second International Workshop on Web-Based Information Visualization: WebVis 2000, 11th International Workshop on Database and Expert Systems Applications, Proceedings, IEEE Computer Society, Los Alamitos, California, 2000, pp.577-585. [5] Avidan, T. and Avidan, S. ParallAX – A data mining tool based on parallel coordinates. Computational Statistics, 14 (1), 1999, pp.79-90. [6] Bertin, J. Semiology of graphics. Diagrams, networks, maps. The University of Wisconsin Press, Madison WI, 1983. [7] Card, S.K., Mackinlay, J.D., and Shneiderman, B. (Eds.) Readings in Information Visualization. Using Vision to Think. Morgan Kaufmann Publishers, San Francisco, 1999. [8] Casner, S.M. A Task-Analytic Approach to the Automated Design of Graphic Presentations, ACM Transactions on Graphics, 10 (2), 1991, pp 111-151. [9] Gitis, V., Osher, B., Dovgyallo, A., and Gergely, T. GeoNet: an Information Technology for Space-Time WWW on-line Intelligent Geodata Analysis. In R.J. Peckham (Ed.), Proceedings of the 4th EC-GIS Workshop, JRC, Ispra, 1999, pp.124-135. [10] Inselberg, A. The plane with parallel coordinates. The Visual Computer, 1 (1), 1985, pp.69-97. [11] Inselberg, A. Visual data mining with parallel coordinates. Computational Statistics, 13 (1), 1998, pp. 47-64. [12] Inselberg, A. and Dimsdale, B. Multidimensional Lines II: Proximity and Applications. SIAM Journal Applied Mathematics, 54 (2), 1994, 578-596. [13] Jankowski, P., Andrienko, N., and Andrienko, G. Map-Centered Exploratory Approach to Multiple Criteria Spatial Decision Making. International Journal Geographical Information Science, 15, 2001, accepted [14] Mackinlay, J. Automating the design of graphical presentation of relational information. ACM Transactions on Graphics, 5 (2), 1986, pp.110-141 [15] Malczewski, J. Visualization in multicriteria spatial decision support systems. Geomatica, 53(2), 1999, pp.139-147 [16] Roth, S.M. and Mattis, J. Data characterization for intelligent graphics presentation. Proceedings of SIGCHI’90: Human factors in computing systems conference (Seattle WA), ACM Press, 1990, pp.193200. [17] Senay, H. and Ignatius, E. A knowledge-based system for visualization design. IEEE Computer Graphics and Applications, 14 (6), 1994, pp.36-47. [18] Treinish, L.A. Task-Specific Visualization Design. IEEE Computer Graphics and Applications, 19 (5), 1999, pp.72-77. [19] Wegner, E.J. Hyperdimensional Data Analysis Using Parallel Coordinates. Journal of the American Statistical Association, 85 (411), 1990, pp.664-675.