Materials Science Forum Vols. 505-507 (2006) pp 745-750 online at http://www.scientific.net © (2006) Trans Tech Publications, Switzerland Online available since 2006/Jan/15
Constructing the Predictive Models of Friction Coefficient Using Cylindrical Compression Testing Y. C. Hsua, T. S. Yangb, S. Y. Sungc and S. Y. Changd Department of Mechanical Manufacturing Engineering, National Formosa University 64 Wun-Hua Rd. Huwei, Yulin, Taiwan, Republic of China a
[email protected],
[email protected],
[email protected], d
[email protected],
Keywords: Friction, Bulging, Finite element simulation, Neural network.
Abstract. In this study, the predictive model of friction coefficient using cylindrical compression was constructed through combining the finite element method and neutral networks. Namely, the related data of the materials characters, cylinder compression bulging, and how they were associated with friction coefficient was obtained by the finite element method. Based on those analysis data, the relationship model, reflecting the relationship among the materials characters such as strength coefficient and strain-hardening exponent, the compression bulging such as reduction height, expanding in upper ending, expanding in bottom ending, maximum expanding in outside diameter and the friction coefficient in workpiece/die interface, was constructed. Finally, the cross verification between finite element analysis, prediction by neutral network model and the experiments of cylindrical compression testing and ring compression testing are repeatedly checked to ensure the accuracy and reliability of the constructed model. Results of the current study indicate that their errors are extremely limited, and the developed predictive system is reliable and feasible. Introduction Metal forming is one of the manufacturing techniques in which the workpiece is put on certain force to generate plastic deformation, transform the geometrical shape, and enhance the mechanical properties. In the metal forming processes, the frictional forces exist in the interface of die and workpiece. The frictional force not only determines the forming load, but also influences the workpiece quality. The frictional force is determined by the variation of the friction coefficients. Thus, estimating the friction coefficient has grown as an important topic in the processes analysis and the die design of metal forming. A number of testing methods have already been employed in an attempt to obtain quantitative data on the friction coefficient of workpiece/ die interface in metal processing. The ring compression testing is widely used for evaluating the friction coefficient for bulk deformation processes now. But the solution precision of this method is not satisfactory due to the lack of considering the work hardening and bulging of testing deformed workpiece after being compressed. In addition, the number of calibration curves is generally small; hence it can not conform to various compressed materials. Owing to the existence of the friction in the interface of workpiece/die, the bulging is found in the cylindrical surface of workpiece after upsetting. Therefore, many researchers have been attracted by the analysis issues of upsetting bulging for a considerable period. For example, Kulkarni and Kalpakjian[1] conducted a study of the barreling of free deformation in upsetting. Ettouney and Stelson[2]presented an approximate model to calculate fold-over and equatorial- axial strain of a cylinder from workpiece geometry during non-uniform compression. Hou et al. [3] dealt with the problem of bulging and folding over in plane-strain upset forging. Due to the disadvantages and the improvement of the friction coefficient testing methods, such as the ring compression test, combining the bulging analysis and the friction coefficient prediction has become the research focus. For example, Venugopal et al[4] have developed a simple theoretical analysis of the solid compression test and estimated the friction factor from the reduction-extrusion All rights reserved. No part of contents of this paper may be reproduced or transmitted in any form or by any means without the written permission of the publisher: Trans Tech Publications Ltd, Switzerland, www.ttp.net. (ID: 140.130.15.16-11/04/08,07:48:07)
746
Progress on Advanced Manufacture for Micro/Nano Technology 2005
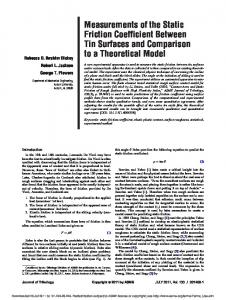
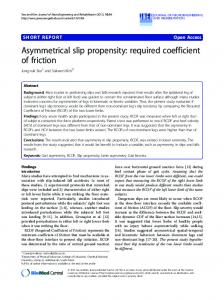
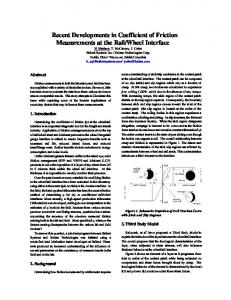
test. The approach of calculating the friction coefficient during non-uniform compression of cylinders has employed by Ettouney & Stelson. [5] Ebrahimi & Najafizadeh [6] have also developed a simple theoretical analysis of the cylindrical compression test to estimate quantitatively the constant friction factor by using compression test. However, studies of friction coefficient prediction considering the materials characters and bulging at the same time, and combining the finite element method and neural networks were extremely less. Thus, in this study, the predictive model of friction coefficient using cylinder compression was constructed through combining the finite element method and neutral networks. Namely, the related data of the materials characters, cylinder compression bulging, and their relations with the friction coefficient was obtained by the finite element method. Based on those analysis data, the relationship model showing the materials characters(i.e. strength coefficient and strain-hardening exponent) and the compression bulging (i.e. reduction height, expanding in upper ending, expanding in bottom ending, maximum expanding in outside diameter), and how they were associated with the friction coefficient in workpiece/die interface was constructed. Finally, the cross verification between finite element analysis and prediction by neutral network model are repeatedly checked to ensure the accuracy and reliability of the constructed model. Besides, the experiments of cylinder compression testing and ring compression testing using dies made by the authors were also carried out to confirm the reliability and feasibility of the developed predictive system. Research methods 1、Finite element simulation analysis The finite element method used for modeling the metal flow deformation has become the most utilized analysis tool in metal forming industry now. In the current study, in order to effectively perform the finite element analysis, the items including the materials characters such as strength coefficient and strain-hardening exponent, the compression bulging such as reduction height, expanding in upper ending, expanding in bottom ending, maximum expanding in outside diameter and the friction coefficient in workpiece/die interface were programmed to the simulation. The 100set simulations were employed to survey the relationship of the bulging deformation with the friction coefficient during cylinder compression. In this study, the commercial package DEFORM-2D has been used for the FEM modeling and analysis of the cylinder compression. The configurations of the billet and die used for simulation are illustrated in Fig. 1and Fig.2. As shown in Fig.2, the h, Re, Rc, Rmax respectively represent the compressed cylinder of reduction height, expanding in upper ending, expanding in bottom ending and maximum expanding in outside diameter. The main parameters of cylinder compression simulation analysis are shown in Table 1. die workpiece die
Fig.1 The configuration of die and billet during cylindrical compression finite element simulation (right view)
Materials Science Forum Vols. 505-507
747
Fig. 2 Configuration of cylindrical compression testing (a) before compressing (left view) (b) after compressing (right view) Table 1 The related parameters of cylindrical compression simulation Die Workpiece Workpiece / die interface
Speeds Strokes Strain-hardening exponent Strength coefficient Constant shear friction coefficient
1(mm/sec) 15mm 0.01~ 0.9 100 ~ 2000 0 ~ 0.9
2、Neural network The abductive network is the neural network employed in the current study. In an abductive network, the complex system is decomposed into smaller, simpler subsystems and grouped into several layers by using polynomial functional nodes. Inputs of the network are subdivided into groups, and then transmitted into individual functional nodes. The general polynomial function in a polynomial functional node is expressed as: n
n
n
n
n
n
yk =C0 + ∑Ci xi + ∑∑Cijxi xj + ∑∑∑Cijkxi xj xk +⋅ ⋅ i =1
i =1 j =1
(1)
i =1 j =1 k =1
where xi , x j , xk are the inputs, y k is the output, and C 0 , C i , C ij , C ijk are the coefficients of the
polynomial functional node. For the case of constructing an abductive network, a training database with the information of inputs and outputs is required first. Then, a criterion for synthesis of this networks, called predicted square error ( PSE ) criterion, is used to determine an optimal network structure. The principle of the PSE criterion is to select the network as accurate and simple as possible. To accomplish this, the PSE criterion is composed of two terms, i.e. PSE= FSE + K p , where FSE is the average squared error of the network for fitting the training data and K p is the complex penalty of the network, shown 2σ p Q 2
as the equation: K p = CPM
, where CPM is the complex penalty multiplier, Q is a N 2 coefficients in the network, N is the number of training data to be used, and σ p is a prior estimate of the model error variance. In this study, there are 100 data sets obtained by finite element simulation, which are used as training data for the abductive network to construct the optimal predictive models of friction coefficient. 3、Experiments In order to understand and verify the accuracy of the developed predictive system by combining finite element analysis with abductive networks, the experiments of cylinder compress testing and ring compression testing are carried out on a universal material testing machine. The workpieces and configurations of these two testing are shown respectively in Fig.3.
748
Progress on Advanced Manufacture for Micro/Nano Technology 2005
(1) Al
(2) Cu (3) configuration (1) Al e (2)Cu (3)configuration (a) cylinder compression testing (b) ring compression testing Fig. 3 Workpieces and configuration of cylindrical compression testing and ring compression testing Results and discussion 1. The finite element simulation analysis of cylinder compression Through the finite element analysis, a hundred sets of analysis results of the strength coefficient, strain-hardening exponent, the reduction height, expanding in upper ending, expanding in bottom ending, and maximum expanding in outside diameter of deformed billets to the constant shear friction coefficient of billet/die interface were obtained. Employing these analyzed data, the predictive model of billet properties and bulging deformation to the friction coefficient was constructed by using the abductive network.
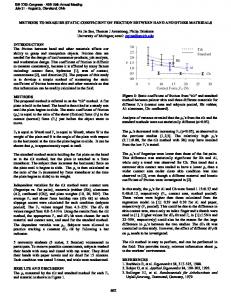
2、Construction of the friction coefficient predicted model of cylindrical compression In this study, one hundred data sets were used as training data for abductive network to construct the predictive model of friction coefficient, as shown in Fig 4. The FSE and PSE of this network are respectively 0.0064 and 0.0068. In Fig. 4, k, n, h, Re, Rc, and Rmax represent respectively the strength coefficient, strain-hardening exponent, the reduction height, expanding in upper ending, expanding in bottom ending, and maximum expanding in outside diameter respectively of deformed billets for the original input of network. They can be also used as the notations of the input determined from the previous layer of specific layer for subsequent calculation. N is the normalized input transformed from the original input. The values of the first Triple and White represent the output of nodes in the first layer calculated using different types of polynomial equation and are also used as the input for the next layer. Similarly, the second Triple is the nodal outputs of the second layer. The fourth Triple is the final result of the network system and can be converted into the real output (U) such as the friction coefficient subjected to the original inputs related to the billet properties and bulging deformations of deformed billets.
Fig.4 The model identified by abductive network for prediction of constant shear friction coefficient under cylindrical compression testing
Materials Science Forum Vols. 505-507
749
Table 2 Comparison of predictive values to simulation values in the relationship of different workpiece properties and bulging to the friction coefficient
1 2 3 4 5
Materials characters Compression bulging Strain-hardeni Reduction Expanding Expanding in Maximum Strength upper bottom ending expanding in ng exponent height (h) in coefficient ending (Re) (Rc) (n) outside diameter (k) (Rmax) 2000 0.90 15.00 19.00 19.00 20.00 350 0.36 15.00 13.65 14.26 16.79 1511 0.89 15.00 15.00 16.00 18.00 1700 0.75 15.00 15.00 17.00 19.00 800 0.20 15.00 14.26 15.60 18.35
Constant shear friction coefficient Simulation Predictive Error (%) values values 0.13 0.56 0.63 0.73 0.76
0.12 0.55 0.58 0.71 0.73
Average error
5.6 1.9 8.3 2.6 3.7
4.42%
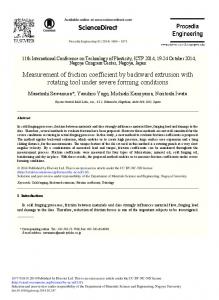
3、Experimental verification of frictional coefficient prediction To verify the accuracy of the predictive model developed by the current study, the true stress-strain equations of aluminum and copper obtained by cylindrical compression experiment, σ = 103.85ε 0.20 and σ = 289.04ε 0.48 , are exploited. Namely, the strength coefficient (k) of the Al and Cu are 103.85 and 289.04, and the strain-hardening exponents (n) are 0.20 and 0.48. Fig.5 shows the compression deformation history of these two materials. Table 3 shows the bulging results of cylinder compression experiments under two different lubricate conditions, with and without oil lubricant. Fig. 6 is the photo of the deformed workpieces of ring compression testing. The values of constant shear friction coefficient of Al and Cu estimated by ring compression testing, with and without oil lubricant in workpiece/die interface, are shown in Table 4. Table 5 shows the comparison between predictive model and ring testing for the estimated value of constant shear friction coefficient. From Table 5, we find that the difference of network prediction and ring compression testing of friction coefficient using those two methods is extremely limited. The maximum error is less than 6%, and the mean errors less than 2.88 %.
(a) Al (b) Cu Fig.5 The deformed workpieces of Al and Cu with different compression reduction under Tefelon lubrication Table 3 Bulging deformation results of cylindrical compression testing in the two lubrication of billet/die interface with oil lubricant and without oil lubricant Materials
Friction
Reduction (mm) h 15
Al
without lubricant
Al
with oil lubricant
15
26.715
35.122
37.054
Cu
without lubricant
8
21.908
23.272
24.545
Cu
With oil lubricant
8
21.854
23.421
24.707
Pictures of deformed workpieces by cylindrical compression testing
Main deformation items of cylindrical compression (mm) Re Rc Rmax 23.65 33.895 35.834
750
Progress on Advanced Manufacture for Micro/Nano Technology 2005
(a)Al (without lubricant) (b)Al (with oil lubricant) (c)Cu (without lubricant) (d)Cu (with oil lubricant) Fig. 6 The deformed workpieces of ring compression testing Table 4 Constant shear friction coefficient obtained by ring compression testing Al (without lubricant)
Al (with oil lubricant)
Cu (without lubricant)
Cu (with oil lubricant)
1 2 3 4 1 2 3 4 1 2 3 4 1 2 3 4
Reduction in internal diameter 10.22 13.88 18.00 20.44 3.00 6.55 8.22 13.77 3.55 3.66 3.66 5.11 2.44 1.66 1.33 2.55
Reduction in height 26.83 32.5 38.66 41.66 15.16 29.66 35.83 45.16 16.33 18.00 18.33 25.83 15.33 16.66 16.66 20.33
Constant shear friction coefficient 0.61 0.60 0.59 0.57 0.34 0.36 0.35 0.37 0.51 0.50 0.49 0.44 0.39 0.34 0.33 0.35
Average value 0.593
0.355
0.485
0.353
Table 5 The comparison of errors between the network prediction and ring compression testing of constant shear friction coefficient Predictive value Al (without lubricant) Al (with oil lubricant) Cu (without lubricant) Cu (with oil lubricant)
0.60 0.34 0.46 0.36
Constant shear friction coefficient Ring testing value Error(%) 0.593 0.355 0.485 0.353
-0.40 5.55 4.17 -1.41
Mean error 2.88 %
Conclusions In this study, the predictive model of friction coefficient using cylinder compression was constructed through combining the finite element method and neutral networks. The cross verification between finite element analysis, prediction by neutral network model and the experiments of cylindrical compression testing and ring compression testing were repeatedly checked to ensure the accuracy and reliability of the constructed model. Results of the current study indicate that their errors are extremely limited, and the developed predictive system is reliable and feasible. References [1] K. M. Kulkarni, S. Kalpakjian, Tran. ASME, J. of Eng. Ind., (1969), pp.743-754 [2] O. M. Ettouney and K. A. Stelson, J. of Eng. for Ind., 112, (1990), pp.267-271 [3] J. Hou, U. Stahlberg and H. Keife, J. of Mat. Pro. Tech., 35, (1992), pp.199-212 [4] S. Venugopal, G. Srinivasan, S. Venkadesoan, V. Seetharaman, J. of Mech. Work Tech., 19, (1989), pp.261-266 [5] O. M. Ettouney, K. A. Stelson, J. of Eng.for Ind., 112, (1990), pp.267-271 [6] R. Ebrahimi, and A. Najafizadeh, J. of Mat. Pro. Tech., 152,(2004), pp.136-143