Content based image retrieval(CBIR) also known as query by image content is ... Figure1 is image apple, boundary of object apple and its centroid distance ...
(IJARAI) International Journal of Advanced Research in Artificial Intelligence, Vol. 2, No.3, 2013
Content Based Image Retrieval by using Multi Layer Centroid Contour Distance Kohei Arai 1
Cahya Rahmad 2
Graduate School of Science and Engineering Saga University Saga City, Japan
Electronic Engineering Department The State Polytechnics of Malang, East Java, Indonesia
Abstract—In this paper we present a new approach to measuring similarity between two shape of object. In conventional method, centroid contour distance (CCD) is formed by measuring distance between centroid (center) and boundary of object, but this method cannot capture if an object have multiple boundary in the same angle. We develop a novel approach feature shape by measuring distance between centroid (center) and boundary of object that can capture multiple boundaries in the same angle or multi-layer centroid contour distance (MLCCD). The experiment result on simulation dataset and plankton dataset show that the proposed method (MLCCD) better than the conventional method (CCD). Keywords— Content based Image Retrieval; CCD; MLCCD
I. INTRODUCTION Recently every time amount of image in the world is increasing very fast and there is a big concern to recognize an object in large collections of image databases. Image database every time become bigger and it make a problem dealing with database organization so the necessity of efficient algorithm is obvious needed [1]. Content based image retrieval(CBIR) also known as query by image content is technique which uses visual content that well known as features for extracting similar images from an image in database [2][3][4]. On The Content based Image Retrieval (CBIR) local feature of an image is computed at some point of interest location in order to recognizing an object. In order to recognize the object firstly the image has to be represented by a feature vector. This feature vector be converted to different domain to make simple and efficient image characteristic, classification and indexing [5]. Many techniques to extract the image feature is proposed [6][7][8] [9]. Shape is one of important visual feature of an image and used to describe image content [8]. The Centroid contour distance (CCD) is formed by measuring distance between centroid (center) and boundary of object [10].
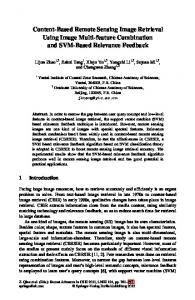
Figure1 is image apple, boundary of object apple and its centroid distance signature. D(a) is distance between center of object and the boundary of object with angle a (from 0 to 360). Suppose center object is (Xc,Yc) and b is point in the boundary of object with coordinate (Xb,Yb). The distance (Dn) between center and the point in the boundary: Dn
=
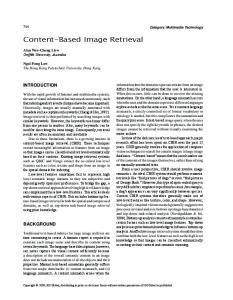
(1) And the CCD feature is : CCD = [D1, D2, D3, …,Dn] Where: Dn = Distance between center and point number n in the Boundary of object. n = Total point in the boundary of object. The remainder of this paper will be organized into the following sections: in the section Two, Proposed method, The third section will describe Similarity and performance, The experiment results will be discussed in the fourth section and finally, the fifth section will provide conclusions. II. PROPOSED METHOD Figure 2 is Diagram block of the proposed CBIR. Firstly images in the database image one by one are extracted. The local feature of an image at some point at interest location is computed. Interest location of the local feature can be obtained by converting RGB image to gray image and implement the canny filter to detect edge position then use morphology filter to ensure the shape of object clear. Feature vector is computed by measuring distance between center of object and point in the boundary object then the result is placed to the feature vector layer 1 if the object has multiple points in the same angle (see fig.3) the result is placed into next layer. All images in the database image is processed by using same method and the output is placed into database of feature vector retrieval. Secondly, when a query image is provided then applied same method to obtain feature vector. These feature vector is compared with other feature vector that exist in the database of feature vector retrieval by using the Euclidean distance.
Fig. 1.
An object and its centroid distance signature
16 | P a g e www.ijarai.thesai.org
(IJARAI) International Journal of Advanced Research in Artificial Intelligence, Vol. 2, No.3, 2013
Xc =
,
Yc =
(2)
The computed distances are saved in a vector. In order to achieve rotation invariance, scale invariance and translation invariance implementation shifting and normalization to these vector is needed. III.
SIMILARITY AND PERFORMANCE
A. Similarity Measurements Similarity metric is very important on the retrieval result. The similarity measure is computed by using Euclidean distance (See Eq.0) between feature representation of image in database image and feature representation of image query. These feature representation is image feature that refer to the characteristics which describe the contents of an image. The retrieval result is a list of image ranked by their similarity. Suppose S1 and S2 are shape of object represented multi layer of feature vectors each (db1, db2,…,dbk) and qr1, qr2,.....,qrk) then the Distance between S1 and S2 is: Fig. 2.
Diagram block of Proposed Cbir
(3)
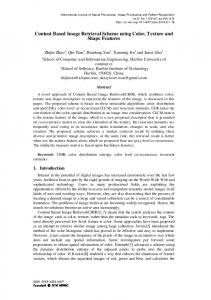
Where: Fdb = Feature vector of image in database image Fqr = Feature vector of query image. Fig. 3. An object and its multi layer centroid contour distance (MLCCD) signature
Fig. 4. An object and its multi layer centroid contour distance (MLCCD) signature
In figure 3 when the angle 0 there is one point have to be captured. However, when the angle is 270 degree there are three point have to be captured by using MLCCD in these case other method just capture one point. In figure 4, the object has three point that have to be captured for all different angle and the result is placed into three layer. In order to obtain the MLCCD firstly position of the centroid have to be computed(see equation 2) then calculate the distance between centroid and the boundary of object repeat this method for other boundary in same angle and different angle.
k
= Number element of feature vector
in these case if the distance between feature representation of image in database image and feature representation of image query small enough then it to be considered as similar. B. Performance Measurements In order to measure the performance of the CBIR system we used precision and recall. Precision measures the retrieval accuracy; it is ratio between the number of relevant images retrieved and the total number of images retrieved (see equation 4). Recall measures the ability of retrieving all relevant images in collection. It is ratio between the number of relevant images retrieved and the total number of relevant images in the collection(see equation 5).
(4)
(5) IV.
EXPERIMENT V
A. Experiment by using Simulation data A. Simulation We use simulation dataset and real dataset for comparison the new approach and the conventional approach.
Position of the centroid is:
17 | P a g e www.ijarai.thesai.org
(IJARAI) International Journal of Advanced Research in Artificial Intelligence, Vol. 2, No.3, 2013
Fig. 6.
Fig. 5.
Example of simulation dataset
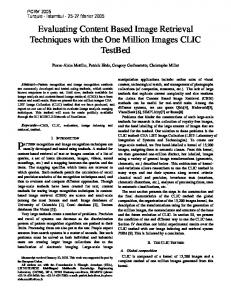
The simulation dataset consist combination of curve shape, oval shape, rectangle shape, Triangle shape, Diamond shape, star shape as shown in Figure 5. Also we make these shapes with different scaling, translation and rotation as shown in Table 1. Graphic average precision results on simulation dataset are then shown in Figure 6. TABLE I. AVERAGE PRECISION ON SIMULATION DATASET
Number Group
Shape
CCD
MLCCD
1
oval rectangle
86
93
2
oval triangle
80
85
3
Triangle rectangle
81
86
4
Rectangle oval
80
85
5
Triangle oval
70
75
6
rectangle triangle
88
96
7
85
89
8
Diamond oval Diamond rectangle
92
9
Star diamond
68 74 67
81
85
91
83
93
10 11 12
Star oval shape with concave 1 shape with concave 2 Average
78.91
Graphic Average precision on simulation dataset
B. Experiment with real image In order to show the feasibility of the shape recognition scheme, we used Image database of phytoplankton [11] for experiment to real data. On the phytoplankton, Algal blooms (red tides) are a phenomenon of clear ecological importance in many regions of the world. Caused by a nutrient influx (e.g. agricultural pollution) into the ocean, by either natural or anthropogenic causes, they can be toxic to marine life [12] and humans under certain conditions.
chattonella marina
chattonella glabosa
heterosigma akashiwo
noctiluca scintillans
alexandrium catenella
Alexandrium tamarense
Akashiwo sanguinea
Ceratorium furca
chattonella antiqua
Fig. 7.
A small portion of phytoplankton image database
Red tide is a significant problem not only for fisherman but also ocean biologist. Red tide is one of measure for representation of ocean healthy [13]. Red tide occur in a nutrition rich ocean. Nutrition rich water makes chlorophyll-a then phytoplankton is increase thus red tide occurs. Figure 7 shows a portion of phytoplankton image database.
85
87.58
The experiment on the simulation dataset in the table 1 and graphic in figure 6 are obtained base on equation 4 shows average precision result is superior to the conventional method for all cases by approximately 8.67 %.
Fig. 8.
Graphic Average precision and recall on real dataset
18 | P a g e www.ijarai.thesai.org
(IJARAI) International Journal of Advanced Research in Artificial Intelligence, Vol. 2, No.3, 2013 TABLE II.
AVERAGE PRECISION ON REAL DATASET
precision Number Group
Total Image
Phytoplankton name
1
18
2
17
3
17
4
17
chattonella antiqua chattonella marina chattonella glabosa heterosigma akashiwo noctiluca scintillans alexandrium catenella Alexandrium tamarense Akashiwo sanguinea Ceratorium furca Average
5
17
6
20
7
22
8 9
23 24
Recall
CCD
ML CCD
ML CCD
85
91
47
50
84
90
49
52
82
87
48
51
85
88
50
51
83
87
48
51
CCD
The experiment results on simulated data demonstrate a new approach has the advantage of 8.67 percent higher than using conventional method. Precision results on real data (real data on phytoplankton dataset) with a new approach has also the advantage of 7.22 percent higher than using conventional method. ACKNOWLEDGMENT
The authors would like to thank all laboratory members for their valuable discussions through this research. [1]
84
93
42
46
84
94
38
42
83
93
36
40
82
94
34
39
83.5
90.7
43.5
46.8
[2]
[3] [4]
In order to detect red tide, many researcher check phytoplankton in water sampled from the ocean with microscope. Immediately after they check phytoplankton, they have to identify the species of phytoplankton. Image retrieval is needed for identification. The proposed method is to be used for image retrieval and identification. The experiment on the real dataset in the table 2 is precision measure base on equation 4 and recall measure base on equation 5. Average precision result by using new approach is higher 3 percent (see in group 4 heterosigma akashiwo) up to 12 percent (see in group 9 Ceratorium furca) rather than the coventional method also for average recall result by using new approach is higher 1 percent up to 5 percent rather than conventional method. From the experiment show if the image have more concave then differences of result between new approach and the conventional method will increase see graphic in figure 8 and figure 9. From these table and figure, it may said that the proposed method is superior to the conventional method for all cases by approximately 7.22 %.
Fig. 9.
same angle just capture one point that nearest to the centroid and placed to one layer. While using the proposed method if there is multiple points in the same angle all point will be captured and the result be placed into multiple vector layers.
Graphic Average recall on real dataset
V. CONCLUSION In this research, we propose a new approach to extract features of an object shape that has some points with the same angle. In the conventional method if there is multiple points in
[5]
[6]
[7] [8] [9] [10]
[11] [12]
[13]
REFERENCES Fotopoulou.F,. Economou,G. “MULTIVARIATE ANGLE SCALE DESCRIPTOR FOR SHAPE RETRIEVAL”Proc. Signal. Process Appl. Math, Electron, Commun. pp. 105-108,2011 P. B. Thawari & N. J. Janwe “CBIR Based On Color And Texture”International Journal of Information Technology and Knowledge Management, Volume 4, No. 1, pp. 129-132. 2011 “Blobworld: Image segmentation using Expectation-Maximization and its application to image querying” R. Datta, D. Joshi, J. Li and J. Z. Wang, “Image retrieval: Ideas, influences, and trends of the new age”, ACM computing Survey, vol.40, no.2, pp.1-60, 2008. J.R. Ohm ,F.B. Bunjamin, W. Liebsch , B. Makai, K. Müller “A Set of Visual Feature Descriptors and their Combination in a Low-Level Description Scheme”J. SignalProcess. Image Commun., Vol. 1,pp.157179, 2000 Y. Liu, D. Zang, G. Lu and W. Y. Ma, “A survey of content-based image retrieval with high-level semantics”, Pattern Recognition, Vol-40, pp-262-282, 2007. Nidhi Singhai, Shishir K. Shandilya “A Survey On: Content Based Image Retrieval Systems”International Journal of Computer Applications (0975 – 8887) Volume 4 – No.2, July 2010 D. Zhang and G. Lu, "Review of shape representation and description techniques," Pattern Recognition, vol. 37, pp. 1-19, 2004. Dengsheng Zhang and Guojun Lu “A Comparative Study of Three Region Shape Descriptors”2002 C.Chang,S. Hwang, and D.Buehrer, “A Shape recognition scheme based on relative distance of feature points from the centroid”Pattern recognition, vol. 11,pp. 1053-1063, 1991 Kohei Arai and Yasunori Terayama, Polarized radiance from red tide, Proceedings of the SPIE Asia Pacific Remote Sensing, AE10-AE101-14, Invited Paper, 2010 C. J. Walsh, S. R. Leggett, B. J. Carter, C. Colle, Effects of brevetoxin exposure on the immune system of loggerhead sea turtles, Aquat. Toxicol. 97, no. 4pp. 293-303, 2010. doi:10.1016/j.aquatox.2009.12.014 Kohei Arai, Red tides: combining satellite- and ground-based detection. 29 January 2011,SPIE Newsroom. doi: 10.1117/2.1201012.003267,http://spie.org/x44134.xml?ArticleID=x4413 4
AUTHORS PROFILE Kohei Arai, He received BS, MS and PhD degrees in 1972, 1974 and 1982, respectively. He was with The Institute for Industrial Science and Technology of the University of Tokyo from April 1974 to December 1978 and also was with National Space Development Agency of Japan from January, 1979 to March, 1990. During from 1985 to 1987, he was with Canada Centre for Remote Sensing as a Post Doctoral Fellow of National Science and Engineering Research Council of Canada. He moved to Saga University as a Professor in Department of Information Science on April 1990. He was a councilor for the Aeronautics and Space related to the Technology Committee of the Ministry of Science and Technology during from 1998 to 2000. He was a councilor of Saga University for 2002 and 2003. He also was an executive councilor for the Remote Sensing Society of Japan for 2003 to 2005. He is an Adjunct Professor of University of Arizona, USA since 1998. He also is Vice Chairman of the Commission A of
19 | P a g e www.ijarai.thesai.org
(IJARAI) International Journal of Advanced Research in Artificial Intelligence, Vol. 2, No.3, 2013 ICSU/COSPAR since 2008. He wrote 30 books and published 307 journal papers. Cahya Rahmad, He received BS from Brawijaya University Indonesia in 1998 and MS degrees from Informatics engineering at Tenth of November
Institute of Technology Surabaya Indonesia in 2005. He is a lecturer in The State Polytechnic of Malang Since 2005 also a doctoral student at Saga University Japan Since 2010. His interest researches are image processing, data mining and patterns recognition.
20 | P a g e www.ijarai.thesai.org