Content Classification-based and QoE-driven Video Send Bitrate Adaptation Scheme Asiya Khan, Lingfen Sun, Emmanuel Jammeh and Emmanuel Ifeachor Centre of Signal Processing and Multimedia Communication School of Computing, Communications and Electronics University of Plymouth, Drake, Circus, Plymouth PL4 8AA, UK. +44 (0)1752 586213
asiya.khan; l.sun; emmanuel.jammeh;
[email protected]
ABSTRACT Initial video quality requirement is not well understood and content providers usually send video at the highest send bitrate resulting in over-provisioning. The main aim of this paper is to present a new scheme that can adapt video send bitrate according to the dynamics of the content and the user’s Quality of Experience (QoE) requirement at the pre-encoding stage. Contents are classified based on their spatio-temporal feature extraction. Video quality is predicted in terms of the Peak-Signal-to-NoiseRatio (PSNR). Statistical analysis of the experimental results confirms that the proposed adaptation scheme performs well for all content types and hence, improves the perceived end-to-end video quality. The proposed scheme makes it possible for content providers to achieve an optimum streaming scheme (with an appropriate send bitrate) suitable for the content type for a requested QoE.
Keywords Content classification, Video Send Bitrate (SBR), PSNR, QoE.
1. INTRODUCTION Content-aware networks have the potential to intelligently and resourcefully link hundreds and thousands of content sources to millions of viewers. This offers service providers a strong service differentiation tool as compared to traditional broadcast networks and it can dramatically increase service revenue while increasing the value of the user experience. The prime criterion for the quality of multimedia applications is the user’s perception of service quality [1]. The most widely used metric is the Mean Opinion Score (MOS). More recently the term QoE (Quality of Experience) has been used and defined as the users perceived QoS (Quality of Service). Users’ demand for quality of streaming service is very much content dependent. Content-aware networks identify, qualify, suggest and match content to users’ based on their specific interest [2]. In content delivery systems such as video-on-demand video content delivered is highly sensitive to network errors. Hence, it is important to determine the relationship between the users’ perception of quality to the actual characteristic of the content and hence increase users’ service by using priority control for delivery. Holistically, to provide service
Permission to make digital or hard copies of all or part of this work for personal or classroom use is granted without fee provided that copies are not made or distributed for profit or commercial advantage and that copies bear this notice and the full citation on the first page. To copy otherwise, or republish, to post on servers or to redistribute to lists, requires prior specific permission and/or a fee. Conference’09, September 7–9, 2009, London, UK. Copyright 2009 ACM 1-58113-000-0/00/0004…$5.00.
differentiation on existing network infrastructure and premium service to end user it is important to define the user requirement (QoE) for any adaptation to take place and hence the motivation of our study. Subjective testing is an accurate way of measuring users’ perception of quality. However, it is expensive and time consuming and hence, the need for objective testing. Objective measurements can be performed in an intrusive or non-intrusive way. Intrusive measurements require access to the source to compare the original and impaired videos. Full reference and reduced reference video quality measurements are both intrusive [3]. Quality metrics such as Peak-Signal-to-Noise-Ratio (PSNR), VQM [4] and PEVQ [5] are full reference metrics. VQM and PEVQ are commercially used and are not publicly available. Nonintrusive methods (reference-free), on the other hand do not require access to the source video. Non-intrusive methods are either signal or parameter based. Non-intrusive methods are preferred to intrusive analysis and they are more suitable for online quality prediction/control. Among the various encoding parameters that play a significant role in the QoE (e.g send bitrate) the dynamics of the content (i.e. the spatial and temporal activity of the content) are critical for the final perceptual outcome. The inter-relationships between adapting the video send bitrate, the activity of the content and QoS are not well understood and relatively less researched. In [6] the authors have proposed content-based video adaptation where a machine learning method is applied to extract content features from the compressed video streams. In [7],[8] the authors propose content-based adaptation using an optimum adaptation trajectory. Similarly in [9], video adaptation based on utility function obtained from content characteristics is proposed. Current schemes result in over-provisioning of the bandwidth as content providers usually send video at the highest send bitrate because the initial video quality requirement is not well understood. In this paper, we propose an adaptive scheme that automatically selects the minimum send bitrate for streaming MPEG4 video to meet QoS requirement (i.e. QoE-driven) and hence save bandwidth. We have established in [10] that sending video beyond a certain send bitrate does not add any value to the quality. Indeed it just wastes scarce network bandwidth. Hence, we have extended our previous work [11] to propose a video Send Bitrate (SBR) adaptive scheme based on the characteristic of the content. In [11] we gave the relationship of video send bitrate for various contents representing the different spatial and temporal activity levels and classified them based on their spatio-temporal activity in three groups as Slight Movement (SM), Gentle Walking (GW) and Rapid Movement (RM). Our scheme fits well with the MPEG7 and MPEG21 conceptual adaptation framework [12]. The rest of the paper is organized as follows. Section 2 presents
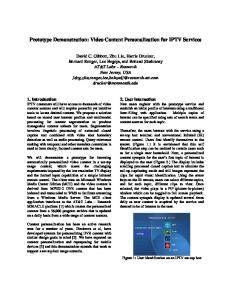
2. PROPOSED ADAPTATION SCHEME The basic model of our adaptation scheme is given in Fig. 1. It consists of the following modules.
Fig.1 Block diagram of the proposed scheme Content feature extraction: For any incoming raw video, content features are extracted based on the spatio-temporal features[10],[11]. Content classifier: Classified by the content classifier into three categories as SM, GW and RM using cluster analysis based on the spatial and temporal features of the video extracted from the previous block. This block decides the content type. The category of SM represents video with low spatial and temporal movement, whereas, the category of RM represents video with high spatial and temporal movement. The third category of GW represents video of low/high spatial and high/low temporal movement. CT-based Decision Function: This function decides, based on the PSNR (or MOS) requirement using equations 2, 3 and 4 (See subsection 2.1 for details), what the send bitrate should be. Video Send Bitrate Adaptor: This block adjusts the send bitrate of the transmitted video as per the information received from the CTbased decision function and according to Table 1. Encoder: Lastly the adapted video stream is generated according to required quality based on video content dynamics. Layered encoding is used for adapting the video streams to the content dynamics. Video streams are encoded in a layered manner in a way that every additional layer increases the perceived quality of the stream. Base layers are encoded at a very low rate to accommodate for different access networks (e.g. UMTS or WLAN). Additional layers are added to adapt the video stream according to the content type.
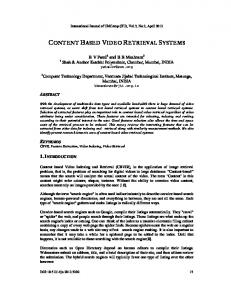
2.1 CT-based Decision Function Three video sequences of ‘Akiyo’, ‘Foreman’ and ‘Stefan’ as shown in Fig. 2 are chosen. They are representative of the three different content types of Slight Movement (SM), Gentle Walking (GW) and Rapid Movement (RM). Therefore, ‘Akiyo’, is chosen as SM, ‘Foreman’ as GW and ‘Stefan’ as RM. SM is described as sequence with a small moving region of interest (face) on a static background. GW is described as a sequence with a contiguous scene change at the end. RM is described as professional wide angled sequence where the entire picture is moving, e.g. sports clip. They are of Quarter Common Intermediate Format (QCIF) resolution and 30s duration. They are encoded with MPEG4 (open ource ffmpeg [13]) codec at several bitrates from 18kb/s to 500kb/s. The bitrates are chosen to produce compressed videos with various levels of quality for each video content type. Video quality is measured in Peak-Signal-to-Noise-Ratio (PSNR) a popular video quality metric.
Fig. 2 Snapshots of the three video sequences In previous work [11] we predicted the MOSv score (converted objectively from the PSNR) for the three different content types and was given by equation (1) as:
PSNR = a1 + a2ln(SBR) + a3FR 1 + a4PER + a5(PER)2
42 40 Maximum PSNR
38
Max SBR for GW
Max SBR for RM
36
Table 1 Experimental video scale assignment for SBR
(1)
For simplicity, and to prove the concept, in this paper the videos are not sent over the network, hence PER = 0 and we fixed the frame rate at 10f/s. Also we are using PSNR as the metric to get the values for our coefficients a1, a2 and a3. In this work we are using equation (1) to adapt the video send bitrate for all three content types.
A v e ra g e P S N R
the proposed adaptation scheme. In section 3 the results and analysis are presented, whereas, section 4 concludes the paper and highlights areas of future work.
34
Scale Value
Average Send Bitrate (Kb/s)
1
1 – 43
2
44 – 79
30
3
80 – 127
28
4
128 – 255
5
256 – 339
6
≥340
Minimum Acceptable PSNR
32 Min SBR for RM
Min SBR for GW
26 0
SM GW RM 100 150 200 250 300 350 400 450 500 Send Bitrate(Kb/s) Max SBR for SM
50
Fig. 3 PSNR Vs Send Bitrate for the three contents
In [10] we identified the minimum send bitrates for the three content types for acceptable quality. Also in Fig. 3 we have shown that the minimum PSNR and maximum PSNR for the three content types is very much dependent on the spatio-temporal features of the content. For example, for GW, the SBRmin is 25kb/s and SBRmax is 120kb/s compared to that of RM, where SBRmin is140kb/s and SBRmax is 370kb/s. We found the coefficients a1, a2 and a3 from eq. (1) by regression analysis. Therefore, under no packet loss (assumed for simplicity and to prove the concept), eq. (1) can be re-wrirtten for the three content types as follows: PSNRSM = 27.64 - 0.0065FR + 3.08ln(SBR) (R2=96%, RMSE=0.664)
(2)
PSNRGW = 19.75 + 0.0022FR + 3.76ln(SBR) (R2= 97%, RMSE =0.702)
(3)
PSNRRM = 10.64 - 0.0065FR +4.61ln(SBR) (R2= 96%, RMSE=1.1)
(4)
Table 2 Adapted SBR for all contents PSNR
SBRSM
SBRGW
SBRRM
32
5
26
104
34
8
44
161
36
15
75
247
38
29
126
384
40
56
215
590
42
108
369
907
According to [14] for video applications PSNR between 35-42dB is considered ‘acceptable to good’ for most people Hence the SBR for our video sequences in the three content categories of SM, GW and RM are calculated from eq.s (5)-(7). The estimated values of the SBR for the three content types are for a PSNR range of 32-42dB and are given in Table 2, 32dB being minimum acceptable PSNR. Therefore, the content provider is able to identify an SBR that corresponds to a given quality. Hence, once the content type is established adaptation preference information is used to predict the adaptation operation.
30 25 P re fe re n c e c o u n t
The send bitrate versus PSNR curve is shown in Fig. 3 for all contents. From Fig. 3 we observe that there is a minimum send bitrate for acceptable quality (PSNR>32dB) for all content types. A PSNR value of 35db is considered “good” for streaming applications [14]. Also there is a maximum send bitrate for the three content types that gives maximum quality (PSNR>38db). For example for the content category of SM, send bitrate of 30kb/s or more gives a maximum PSNR of 38dB. However, in RM higher send bitrates are required for maximum quality i.e. > 370kb/s. From Fig. 3 it can be derived that when the send bitrate drops below a certain threshold, which is dependent on the video content, then the quality practically collapses. Moreover, the quality improvement is not significant for send bitrates higher than a specific threshold, which is also dependent on the spatial and temporal activity of the clip.
20 15 10
3. RESULTS & ANALYSIS To show the concept of SBR adaptation from a content providers point of view, we re-write equations (2)-(4) as follows:
5
SBRSM = e (PSNRSM – 27.64 + 0.0065FR)/3.08
0 15
(5)
– 19.75 + 0.0022FR)/3.76
(6)
SBRRM = e (PSNRRM – 10.64 + 0.0065FR)/4.61
(7)
SBRGW = e
(PSNR GW
The quality is specified by the content provider to meet the end customers requirement. The quality in this paper is measured in terms of the PSNR. In today’s network infrastructure the motivation for service providers’ to provide new services to customers is reduced due to low revenue margins. Therefore, it makes sense to optimize existing network infrastructure and provide service differentiation to customer in terms of premium and tailor-made services according to the requirement of the customer. Hence, the motivation to use quality measurement as an input in our model. In future, we will use Mean Opinion Score (MOS) as input as QoS is best captured in the MOS value The SBR calculated from equations (5), (6) and (7) for the three content types is then used to encode the three different video clips. For example, content in the category of SM is acceptable for PSNR≥32dB. Hence we choose a PSNR value of 32dB and from eq. (5), this gives an SBR of 5kb/s.
20
25 30 35 Average PSNR
SM GW RM 40 45
Fig.4 Histogram of the three content types The histogram of objective preference for SBR vs PSNR by counting the preference of different adaptation operation in terms of the PSNR values for all three content types is shown in Fig. 4. The video clips are labeled as SM, GW and RM with low, medium and high complexity, respectively. Fig. 4 shows that each content type has its unique patterns of adaptation preference supporting our adaptation scheme. A clear trend can be seen as the video content complexity increases outlining the adaptation preference as more complex videos need higher send bitrate for acceptable quality. Fig. 5 shows the SBR adaptation for each content type. The video clips chosen for adaptation are different to those used to estimate the SBR values for all content types. Hence, we use unseen dataset to verify our adaptation scheme. We achieved very good correlation (> 90%) for all three content types.
around 95% for all three content types. Future work will extend the proposed adaptation scheme to take network QoS parameters into account. The proposed adaptation scheme will be tested using H264 video codec as well. In addition, extensive subjective testing will be carried out to capture user’s QoE and compare with the PSNR results obtained objectively.
44 42 40 PSNR
38
5. ACKNOWLEDGMENTS
36 34 32 30 28 0
200
SM SM-adapted GW GW-adapted RM RM-adapted 400 600 800 Send Bitrate(Kb/s)
Fig. 5 PSNR vs adapted SBR for SM, GW and RM To further verify our adaptation scheme, Fig. 6 shows the correlation of the three content types for our adaptation scheme in terms of the PSNR value. We achieved above 90% correlation for all three content types.
44 42 P S N R -a d a p te d
6. REFERENCES [1] ITU-T. Rec P.800, Methods for subjective determination of transmission quality, 1996. [2] J. Bosloy, “Building a content-aware network”, CTO, Solace Systems. http://www.althos.com/IPTVArticles/IPTVMagazine_2006_ 10_Content_Aware_Network.htm [3] Video quality experts group, multimedia group test plan, Draft version 1.8, Dec 2005, www.vqeq.org. [4] http://compression.ru/video/index.htm [5] www.pevq.org [6] Y. Wang, M. Schaar and A. Loui, “Classification-based multidimensional adaptation prediction for scalable video coding using subjective quality evaluation”, IEEE transactions on circuits and systems for video technology, Vol. 15, No. 10, Oct. 2005. [7] N. Cranley, L. Murphy and P. Perry, “Content-based adaptation of streamed multimedia, IEEE Int. Conf. on management of multimedia networks and services No. 7, San Diego, CA, 3-6 Oct 2004.
40 38 36
[8] H. Koumaras, A. Kourtis, D. Martakos and J. Lauterjung, “Quantified PQoS assessment based on fast estimation of the spatial and temporal activity level”, Journal of Multimedia Tools and Applications, Springer Editions, Vol. 34, No.3, Sept. 2007.
34 32 30 28 30
The work reported here is supported in part by the EU FP7 ADAMANTIUM project (contract No. 214751).
32
SM-Corr=94% GW-Corr=96.5% RM-Corr=97% 34 36 38 40 42 PSNR-measured
Fig. 6 PSNR-adapted vs PSNR-measured for adapted SBR
4. CONCLUSIONS In this paper we presented a new scheme that can adapt video send bitrate according to the dynamics of the content and the user’s Quality of Experience (QoE) requirement at the preencoding stage. We achieved good correlation for our adaptive scheme with unseen dataset. However, the effectiveness of our classification-based approach depends on whether consistent, distinctive video categories can be defined, and whether accurate classification can be realized. We have achieved correlation of
[9] O. Onur and A. Alatan, “Video adaptation based on content characteristics and hardware capabilities”, Second International workshop on semantic media adaptation and personalization, IEEE computer society press, 2007. [10] A. Khan, L. Sun and E. Ifeachor, “Impact of video content on video quality for video over wireless networks”, Proc. of ICAS Conference, Valencia, Spain, 20-24 April 2009. [11] A. Khan, L. Sun and E. Ifeachor, “Content clustering based video quality prediction model for MPEG4 video streaming over wireless networks”, Proc of IEEE ICC Conference, Dresden, Germany, 14-18 June 2009. [12] S. Chang and A. Vetro, “Video adaptation: concepts, technologies and open issues”, Proc. of IEEE, Vol. 93, No. 1, pp 148-158, Jan. 2005. [13] Ffmpeg, http://sourceforge.net/projects/ffmpeg [14] Telchemy application notes, “Understanding of video quality metrics”, Telchemy, Feb. 2008. http://www.telchemy.com