Context-Aware Active Authentication Using Smartphone Accelerometer Measurements Abena Primo, Vir V. Phoha, Rajesh Kumar, Abdul Serwadda
[email protected],
[email protected],
[email protected],
[email protected] Center for Secure Cyberspace, Louisiana Tech University, Ruston, Louisiana, USA
authentication scheme in which the authentication system first estimates the way in which a phone is held, so as to render a fine-tuned authentication decision that takes into consideration information about the position of the phone. The vast majority of past research on this type of authentication has used a very restrictive experimental setup where performance evaluation was conducted based on a phone being held in a certain way (e.g.[9], [10]). This kind of experimental design helped illustrate the potential of this type of authentication. However, as these technologies advance towards being deployed in the wild (e.g., see DARPA’s anticipated biometric platform [8]), there is need for investigations into how they would perform in a more realistic setting. In practice, a phone could be held in a variety of ways, raising questions as to whether research findings based on a static user template (i.e., a template built from data collected by a phone held in a single preset position) could be indicative of how a real system would perform. This paper takes some steps towards tackling this question as we study the impact of variations in the position of the phone on the performance of a continuous authentication system that uses accelerometer measurements to characterize human body movements. We focus on four of the most common ways in which people carry their phones while they walk: — (1)The phone held in the right hand , (2) The phone held in the left hand, (3) The phone inserted in the left front pocket (of say, the pants or skirt), and (4) The phone inserted in the right front pocket. While there are several other ways in which a phone could be held in practice (e.g., in a bag, shirt pocket, etc.), we believe that an investigation based on these four most common ways of holding a phone will go a long way towards answering the question of how the phone handling method affects classification. Through a combination of supervised learning methods and statistical tests of significance, we show that there are users for whom the position in which a phone is held significantly affects classification performance for a system using accelerometer sensor readings as a basis for authentication. We argue that a practical Active Authentication system using accelerometer measurements should have mechanisms to determine the way in which a user holds the phone and
Abstract—While body movement patterns recorded by a smartphone accelerometer are now well understood to be discriminative enough to separate users, little work has been done to address the question of if or how the position in which the phone is held affects user authentication. In this work, we show through a combination of supervised learning methods and statistical tests, that there are certain users for whom exploitation of information of how a phone is held drastically improves classification performance. We propose a two-stage authentication framework that identifies the location of the phone before performing authentication, and show its benefits based on a dataset of 30 users. Our work represents a first step towards bridging the gap between accelerometerbased authentication systems analyzed from the context of a laboratory environment and a real accelerometer-based authentication system in the wild where phone positioning cannot be assumed. Keywords-gait recognition; context awareness; accelerometers; authentication;
I. I NTRODUCTION The identification of humans or their activities based on body movement patterns has recently attracted a lot of research (e.g., see [1], [2], [3]). The increased interest in this area is largely due to two factors: (1) The proliferation of ubiquitous computing devices (e.g., smartphones) that users carry with them all the time, and (2) the abundance of sensors (e.g., magnetometers, gyroscopes, accelerometers, GPS sensors, audio sensors) built into these devices nowadays. Given a phone that a user carries around while undertaking their daily routine, output from the multitude of sensors can be mined to extract patterns that drive applications spanning domains such as security (e.g., authentication [4]), marketing (e.g., targeted advertisement [5]), and health (e.g., fitness tracking [6]), to mention but a few. Out of this multitude of new exciting applications, the security-related applications have particularly attracted a lot of interest since they could help provide a second layer of defense to the very widely breached PIN lock mechanism [7]. DARPA’s Active Authentication program [8] is perhaps the best evidence of this new wave of interest in sensor-driven smart-phone security. In this paper, we revisit the problem of user authentication based on body movement patterns (as recorded by the accelerometer) and propose a context-aware 98
present our initial results on how such mechanisms could improve classification performance. The contributions of this paper are summarized below:
multiple (i.e., 4 different) positions. We discuss these works here. First amongst these is the work in [1] where six accelerometers were used with the aim of determining the ideal sensor location for the identification of daily living activities such as eating, walking, wiping tables, cooking, vacuuming and lying down. For each subject, a single accelerometer was worn on the chest, arm, wrist, knee, waist and ankle. Using a k-NN and Na¨ıve Bayes classifier on data collected from 11 users, different activities were mapped to their ideal sensor positions, although the authors ultimately concluded that one required as many sensors as possible to have the ability to track subtle changes in body posture. Kupryjanow et al. [14] used four accelerometers, with a sensor located at each of the left and right wrists, left and right ankles and on the chest. The aim of the study was to investigate how the number of sensors and the method of data filtering affects activity recognition accuracy. Based on results obtained when a neural network and k-NN classifier were run on data collected from 16 subjects, the authors concluded that the number of accelerometers and the frequency band used for data filtering had a significant impact on activity recognition. Clearly, the focus of these two papers differs from our work since we study user authentication and particularly a context-aware method that augments the traditional classification approach by leveraging information on how the phone is handled. The two papers use a known position of the accelerometer as input and attempt to determine how these positions correlate with different activity recognition tasks. Our method, on the other hand, uses supervised learning to discover the position of the phone, so as to use this information in the authentication process. Away from the works which were motivated by medical applications, a number of past works on gait authentication (e.g., see [15], [16]) also used wearable accelerometers. Despite not using a phone-based accelerometer for data collection, the investigations performed in these papers were motivated by smartphone-based authentication. Examples of these works are the papers by Mantyjarvi et al. [16] and Gafurov et al. [15] [17] where a stand-alone accelerometer was used for user authentication/identification based on gait patterns. Mantyjarvi et al. [16] used readings from an accelerometer device attached to a belt on 36 subjects (19 males and 17 females) for identification. The accelerometer device was composed of 2 perpendicularly oriented accelerometer sensors. Participants were asked to walk at varied paces and the data was analyzed with several methods including a frequency domain method and a signal correlation method. They found that a signal correlation method worked best with an EER of 7 percent. The results of this work showed that gait recognition from sensors was comparable to gait recognition from video.
1) We analyze the impact of the position of the phone on the performance of an accelerometer-based authentication system on a smartphone and provide empirical evidence of how variations in the locations of the phone affect classification. 2) We propose the notion of context-aware authentication in which the classification system infers and uses information on the location of the phone during authentication. We show that compared to the traditional methods which do not take the phone position into consideration, the classification accuracy of the proposed context-aware system can be over 19% higher. 3) We perform an analysis of how different features perform at recognizing users, the limb on which the phone is located, and the side (left or right) on which the phone is held. This analysis should provide a starting point for future work which will further explore the context-aware methodology proposed in this paper. The rest of the paper is organized as follows: We discuss related work in Section II, our data collection experiments and feature analysis in Section III and the framework of the proposed context-aware design and its performance in Section IV. II. R ELATED W ORK Until recently, research on the use of accelerometer measurements to characterize human body movement patterns was mostly undertaken based on wearable stand-alone accelerometers. With recent advancements in smartphone technologies, accelerometers are now part and parcel of almost all smartphone models being manufactured today. These smartphone-based accelerometers are easily integrated into custom mobile applications, and have paved the way for the emergence of new application areas such as the continuous (or active) authentication of smartphone users. As of today, an increasing number of researchers are using smartphone-based accelerometers to characterize body movement patterns for different applications. To clearly delineate between the two categories of works (i.e., wearable vs smartphone-based accelerometers), we discuss them as two separate sections. A. Wearable Accelerometers A good number of studies that used wearable accelerometers focused on medical applications; such as predicting falls [11], estimating energy expenditure [12] and assessing limb surgery recovery [13], among other applications. While this body of work did not focus on user authentication, there are several papers which used multiple accelerometers in a way which could be compared to our usage of smartphones in 99
In [15], data from normal walking and walking with a backpack was studied. An accelerometer sensor was placed in the right pocket for authentication and identification. Participants of the study were asked to walk 20 meters. The results of this paper showed that from 50 subjects, it is possible to achieve a recognition rate of 86.3 percent from accelerometer sensor for gait based authentication. Meanwhile in [17], arm swing was proposed as a soft biometric for authentication, with a 10 percent EER obtained using frequency domain analysis. The main difference between these works and our paper is again the fact that the notion of using phone usage contexts is not seen in any of these works. This raises questions as to how the results from these studies apply to a real life setting where a phone cannot be expected to be held in a fixed position.
In [10], the aim was to identify a subject irrespective of the pace at which he or she walked. Towards this end, data for this study was collected from 36 subjects (28 males and 8 females). Each subject walked normally and fast for 166 feet. Three experiments were performed using SVM, a time frequency spectrogram model and a cyclo-stationary model. The best results were 99.4 percent verification rate with normal walking and 96.8 percent verification rate with fast walking. This work used both accelerometer and gyroscope data. In [19], the relationship between gait authentication and soft biometrics was analyzed. The soft biometrics considered were gender, age, surface, sensor type, and sensor location. The devices were placed at the waist of 744 subjects where 389 were male and 355 were female. These subjects ranged from ages 2 to 78. They concluded that the performance of gait authentication decreased with age. They also concluded that a sensor located at the waist impacted gyroscope authentication more than accelerometer authentication. Although these studies increase our understanding of the potential of gait-based authentication on smartphones, they differ from our objective, which is to initiate a new paradigm of gait-based authentication that uses information on the position of the phone during the authentication process.
B. Smart-phone Accelerometers One work that used phones with an accelerometer was [18]. They used a data fusion model which fused voice recognition data with hand holding data to produce a continuous identification system. In this study, 31 participants were asked to hold the phone in the hand, hip pocket, and breast pocket. Each participant was asked to walk normally and then quickly for 20 meters. Data was collected in two sessions, each a month apart. Their phone speech recognition model with gait recognition performed better than the speech recognition model alone. The EER ranged from 2 to 12 percent. A second work that used phones with an accelerometer for authentication was [9]. The phone was placed in a horizontal position on the hips during the data collection experiment. Participants were asked to walk normally for 37 meters (indoors) twice on 2 different days. There were 10 females in this experiment. They proposed a feature extraction method that used time interpolation to find the average cycle of a subject for authentication. The results of this study was an EER of 20.1 percent. Another work that used phones with an accelerometer for authentication was [2]. In this work the phone was placed in the front pants pocket of 36 subjects. Subjects were asked to perform multiple activities such as walking, jogging, going up stairs, and going down stairs. Data was collected from subjects as they performed the activity in reallife. Using J48 and Neural Net classifiers, they were able to identify a person walking with 84 and 90 percent accuracy respectively. In [4], focus was on building a feature extraction model based on Fourier transform features. They showed that using these features resulted in improved phone-based gait identification with an accuracy between 45 and 50 percent. The data used in this study came from 58 subjects who held the phone in a hand while walking.
III. E XPERIMENT D ESIGN A. Data Collection After getting IRB approval from our university, we collected data from 30 users who were either faculty, staff or students of the university. Each user participated in two data collection sessions that were at least one day apart. We will refer to these sessions as Session I and Session II. The reason for collecting data over two sessions that were on different days was to ensure that our training and testing datasets were collected at different points in time. Otherwise an experiment in which all data is collected on the same day may not realistically represent the natural variations in walking patterns that an authentication in a practical setting might encounter. Each session comprised two separate experiments. In the first experiment, every participant placed a Google Nexus phone in each of the right and left hand pockets and walked for approximately 2 minutes in a long corridor outside our research lab. In the second experiment, every participant held two Google Nexus S phones (one in each hand) and again walked for approximately 2 minutes in the same corridor. As the participants walked, an application on the phone recorded accelerometer measurements. B. Data Pre-processing and Feature Extraction Accelerometer measurements are of the form (X, Y, Z) where X, Y and Z are respectively the X, Y and Z components of the acceleration relative to the phone. We removed the gravity component from each of the X, Y and 100
Z measurements and converted them to the Earth’s frame of reference using the rotation matrix [20]. p For each point, we then computed the magnitude M = (X 2 + Y 2 + Z 2 ) that we refer to as the fourth component in the rest of the paper for simplicity. Raw accelerometer measurements are quite noisy, since even a phone in a fixed position could return accelerometer measurements depicting bursts of acceleration. To minimize the effect of noise, we used a simple moving average based on a window of 3 points for each of the X, Y, Z and M components. For each component, the smoothed time series after this step was broken into windows, each containing 100 points and having an overlap of 50 points with the next window. From each of these windows, we then computed the 55 features shown in Table I. The table assigns numeric identifiers to each of the
Minimum Maximum Mean Standard deviation First Quartile Second Quartile Third Quartile Power Energy # of Peaks # of Zero Crossings Skewness Kurtosis Avg peak Interval
CDF
2
1
2
0.6 0.4 0.2 0
0
5
10 15 20 25 # of Rejections of Ho
30
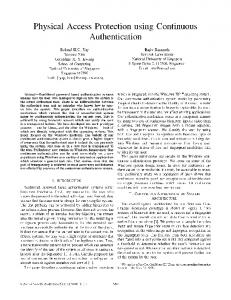
(a) Features extracted when the phone was held in the pocket in Session 1 (P S1 ) compared using the K-S test to those extracted when (i) the phone was held in the pocket in Session 2 (P S2 ), and (ii) when the phone was held in the hands in Session 2 (AS2 ).
Feature Id (F.Id) for Accelerometer Component X Y Z M 1 15 29 43 2 16 30 44 3 17 31 45 4 18 32 46 5 19 33 47 6 20 34 48 7 21 35 49 8 22 36 50 9 23 37 51 10 24 38 52 11 25 39 12 26 40 53 13 27 41 54 14 28 42 55
Table I L IST OF FEATURES EXTRACTED FOR X, Y, Z
1
PS Vs AS
0.8
AS Vs AS
1
1
2
AS1 Vs PS2
0.8 CDF
Feature Name
PS Vs PS
1
0.6 0.4 0.2 0
0
5
10 15 20 # of Rejections of H
25
30
0
AND
M (55 IN TOTAL )
(b) Features extracted when the phone was held in the hands in Session 1 (AS1 ) compared using the K-S test to those extracted when (i) the phone was held in the hands in Session 2 (AS2 ), and (ii) when the phone was held in the pocket in Session 2 (P S2 ).
FROM EACH WINDOW
features since it will be more convenient to refer to these features by their F.Ids (than by their longer names) in the proceeding sections of the paper. For example, the feature with F.Id 1 is the minimum of X, the feature with the F.Id 15 is the minimum value of Y while the F.Ids 29 and 43 are respectively the minimum values of Z and M . Observe that the number of zero crossings for M is not defined since the magnitude feature is always positive and hence does not cross the zero line.
1
CDF
0.8 0.6 0.4 LPS Vs LPS
0.2
C. Could Changes in the Position of the Phone Significantly Change a User’s Features?
1
2
LPS1 Vs RPS2 0
Before discussing the framework and performance of our context-aware authentication system, we first examine the impact that the position of the phone has on a user’s features. We specifically address two questions: (1) Does the position of the phone (i.e., hands or pockets) cause significant changes in a user’s features — e.g., would an arbitrary feature (such as the mean value of X in Table I) change significantly depending on whether it is computed
0
5
10
15
20
25
30
# of Rejections of Ho (c) Features extracted when the phone was held in the left pocket in Session 1 (LP S1 ) compared using the K-S test to those extracted when (i) the phone was held in the left pocket in Session 2 (LP S2 ), and (ii) when the phone was held in the right pocket in Session 2 (RP S2 ). Figure 1. Results of the two-sample Kolmogorov-Smirnov test on the effect of the position of the phone on a user’s feature values.
101
Ranks F.Id Score Ranks F.Id Score
1 29 .057 16 42 .047
2 32 .056 17 22 .047
3 37 .056 18 23 .047
4 36 .053 19 4 .047
5 50 .053 20 2 .047
User Identification 6 7 8 51 18 16 .053 .053 .052 21 22 23 1 21 45 .047 .046 .046
9 46 .052 24 35 .044
10 30 .052 25 48 .044
11 15 .052 26 7 .042
12 44 .051 27 28 .040
13 49 .049 28 8 .040
14 19 .048 29 9 .040
15 33 .047 30 55 .040
12 34 .155 27 8 .080
13 48 .147 28 27 .079
14 38 .146 29 41 .079
15 49 .143 30 9 .077
Table II B EST 30 RANKED FEATURES FOR USER CLASSIFICATION
Ranks F. Id Score Ranks F.Id Score
1 25 .258 16 40 .143
2 29 .256 17 37 .132
3 11 .236 18 36 .120
4 33 .218 19 39 .112
Feature 5 32 .193 20 55 .105
Ranking for Limb Classification 6 7 8 9 10 31 43 47 50 51 .185 .179 .170 .168 .166 21 22 23 24 25 30 44 18 19 42 .100 .100 .088 .087 .087
11 45 .157 26 15 .082
Table III B EST 30 RANKED FEATURES FOR CLASSIFICATION OF THE POSITION OF THE PHONE
a similar vector when the phone was in the pocket. The null hypothesis Ho of the test is that the two feature vectors compared follow the same distribution. Rejection of the hypothesis implies a significant difference in Feature #1 for the two phone locations, which in turn suggests that changes in the phone location could affect classification performance if a good number of features depict this trait.
based on a phone in the hands or the pocket?, (2) Does the side of the body (i.e., left or right) on which the phone is held significantly affect a user’s feature values? There are several ways in which these kinds of questions could be addressed. Here we use a hypothesis testing approach, comparing each user’s features for the two positions (e.g., hands or pockets) to determine if significant differences exist. However, before performing this testing, we first carry out a feature selection step so as to run our tests with a compact but informative feature-set that is in tune with the well known resource constraints of mobile devices1 . While we did not run our classification system on the phone, we still minimize the feature numbers because our design recommendations ought to be suitable for a live smartphone application. We used the correlation based attribute evaluator [21] to rank the 55 features in Table I and selected the top 30 of these features. This method uses a heuristic that assigns a high score to a subset of attributes which have high correlation with the class, yet have low correlation with each other. Table II shows the top ranked features from this analysis. Working with these features, we used the two-sample Kolmogorov-Smirnov (or K-S) test [22] with α= 0.05 to compare each user’s features across different phone positions. Consider a user who has 50 feature vectors each of which containing 30 features numbered # 1 through # 30. Each feature has 50 instances, i.e., each feature can be used to create a 50 dimensional vector. For a feature such as Feature # 1, we use the K-S test to compare the user’s 50 dimensional vector when the phone was held in the hands to
For each user, we carried out this analysis for each of the top 30 selected features and registered the number of features for which Ho was rejected. Figures 1(a) through 1(c) summarize the results from these tests in the form of a CDF plot expressing the number of features for which Ho was rejected across the full user population. In Figure 1(a), the features extracted when the phone was held in the pocket in Session 1 (P S1 ) were compared using the K-S test to those extracted when the phone was held in the pocket in Session 2 (P S2 ), and when the phone was held in the hands in Session 2 (AS2 ) (Review Section III-A for description of data collection sessions). Observe that 80% of the user population had over 15 rejections of Ho for the case P S1 vs AS2 while less than 50% had the same number of rejections for P S1 vs P S2 . Similarly, almost 100% of the population had over 10 rejections of Ho for the case P S1 vs AS2 compared to about 80% for the case P S1 vs P S2 . This trait means that whenever data collected with the phone in the pockets during a given session was compared with data collected with the phone held in the pocket during another session (i.e., P S1 vs P S2 ), a good number of users were more likely to have many of their features matching than when data collected with the phone held in the hands was compared to data collected when the phone was in the pocket. This same trait is also seen in Figure 1(b) as users again see more features
1 A continuous authentication system is expected to run all the time on the smartphone; minimizing the dimensionality of feature vectors is one sure way to reduce resource consumption.
102
exhibiting variations between Session 1 and Session 2 when two different phone holding positions are compared (AS1 vs P S2 ) than when the phone is in the same position (AS1 vs AS2 ). When comparisons were made between different sides (left or right — Figure 1(c)) the difference was not as dramatic as when comparison was between the hands and the pocket. Further analysis indicated minimal impact of the side on which the phone was held, so we focused on the comparison between the hands and the pocket for the rest of the paper. Overall, the results of the significance tests (Figures 1(a) and 1(b)) suggested that information on the location of the phone could significantly impact classification performance. In the following section we present our context-aware classification system and show the performance benefits that it attains as a result of leveraging information about the phone position during classification.
Algorithm 1: Multi-stage Authentication Framework Input: AccReadings(X[],Y[],Z[],M[]) //Phone’s Linear Accelerations (X,Y,Z) Transformed to the Earth Coordinate System, and the Resultant M Input: TemplatePockets //Classifier Template Built from Phone-in-Pocket Readings Input: TemplateHands //Classifier Template Built from Phone-in-Hand Readings Output: ADecision //Authentication Decision AuthenticateUser() begin if IdentifyLimbs() == Hands then ADecision ← Authenticate(TemplateHands, AccReadings[]); end if else if IdentifyLimbs() == Pockets then ADecision ← Authenticate(TemplatePockets, AccReadings[]); end if end
IV. P ERFORMANCE AND D ESIGN OF C ONTEXT- AWARE AUTHENTICATION S YSTEM Given a biometric sample that is to be assigned a class label, our context-aware authentication system first checks whether the sample is from a phone held in the hands or a phone in the pockets2 . Based on the result from this test, user authentication is then carried out based on a comparison with the appropriate template. Algorithm 1 summarizes this process; the function identif yLimbs() checks whether samples are from the hands, and uses the stored template associated with the hands for authentication if samples are found to be from the hands, or a template associated with the pockets if otherwise. While the algorithm itself is quite straightforward, its performance is very heavily reliant on two critical design decisions, namely, the criteria by which a sample can be classified to belong to one of the two phone positions, and the features which are best suited for classifying phone positions (as opposed to classifying users). We next discuss these issues and how we address them:
Observe that a good proportion of the features that were part of the top 30 in Table II are not seen in Table III. This points to the importance of choosing a specialized featureset for the phone position classification problem. B. Mechanism for Determining Phone Positions A simple way to address the question of how to map vectors to phone positions is by using a purely supervised approach, where the authentication system is explicitly trained based on data collected from the phone owner for the two phone positions. In practice though, such an approach would mean that an individual who acquires a new phone would have to go through a dedicated process of inputting labeled samples to the phone; an intrusive process that is unlikely to be embraced by the common user. We propose a semi-supervised approach, where the phone is shipped with labeled samples of these two classes from the population. By comparing a users data to multiple population samples associated with either kind of activity, a classifier can assign the sample to either of the classes. After an individual has used the phone (i.e., successfully authenticated) for sometime, the users own samples can then be used as reference templates for future classification of the phone position. Using a Logistic Regression classifier, we were able to classify a phone position correctly 85% of
A. Features for Determining Phone Positions A feature that is good at separating users is not necessarily as good if used to discriminate between a different category of classes, say, phone positions. To determine which features to be used to separate between phone positions, we again applied the correlation-based feature selection approach that was used in Section III-C. The only difference this time was that the class label was the position of the phone, as opposed to the user Id. Table III shows the features that were selected through this criteria. Again, we only take the top 30 features to minimize the load on the system. 2 As we discussed earlier, we believe it is reasonable to assume that a person who is walking will more than likely have the phone in the pockets or the hands. That said, ours is a generic framework that can be easily extended to accommodate new phone positions if needed.
103
the times when we used population data for training. It is noteworthy that the full benefits of the multi-stage authentication mechanism can only be reaped if the phone position classification accuracy is as close to 100% as possible. We are currently investigating methods that could guarantee a higher classification accuracy than reported here.
[2] J. Kwapisz, G. Weiss, and S. Moore, “Cell phone-based biometric identification,” in Biometrics: Theory Applications and Systems (BTAS), 2010 Fourth IEEE International Conference on, Sept 2010, pp. 1–7. [3] S. L. Lau and K. David, “Movement recognition using the accelerometer in smartphones,” in Future Network and Mobile Summit, 2010, June 2010, pp. 1–9.
C. User Classification Results [4] T. Kobayashi, K. Hasida, and N. Otsu, “Rotation invariant feature extraction from 3-d acceleration signals,” in Acoustics, Speech and Signal Processing (ICASSP), 2011 IEEE International Conference on, May 2011, pp. 3684–3687.
We use the Logistic Regression implementation in Weka [23] to test the performance of our user authentication model. We compute the classification accuracy when data from a phone kept in the pocket (we call this pocket data) was used to train and when data from a phone held in the hands (we call this hand data) was used for training. In both cases we performed tests with both hand data and pocket data. Table IV summarizes the classification results. Observe Training Testing Classification Accuracy
Pocket Data Hand Pocket 61.76%
72.58%
[5] M. Bryant, “If facebook home will track my every move and serve me targeted ads, sign me up now,” http://thenextweb.com/media//2013//04//05//if-facebookhome-will-track-my-every-move-and-serve-me-targetedads-sign-me-up-now/, Apr. 2013, [Online; accessed 31March-2014.
Hand Data Hand Pocket 82.30%
[6] G. M. Weiss and J. W. Lockhart, “Identifying user traits by mining smart phone accelerometer data,” in Proceedings of the Fifth International Workshop on Knowledge Discovery from Sensor Data, ser. SensorKDD ’11. New York, NY, USA: ACM, 2011, pp. 61–69. [Online]. Available: http://doi.acm.org/10.1145/2003653.2003660
62.55%
Table IV I LLUSTRATING PERFORMANCE IMPROVEMENT ARISING OUT OF LEVERAGING PHONE POSITION INFORMATION DURING CLASSIFICATION .
[7] A. Serwadda, V. Phoha, and Z. Wang, “Which verifiers work?: A benchmark evaluation of touch-based authentication algorithms,” in Biometrics: Theory, Applications and Systems (BTAS), 2013 IEEE Sixth International Conference on, Sept 2013, pp. 1–8.
that the classification accuracy increased from 61.76 percent to 72.58 percent when pocket data was used for both training and testing. Also observe that the classification accuracy increased from 62.55 percent to 82.30 percent when hand data was used from both training and testing. While we continue to fine-tune the design of our system, these initial results show the promise that our methodology has.
[8] “DARPA-BAA-13-16 Active Authentication (AA) phase 2,” http://www.darpa.mil/WorkArea/DownloadAsset.aspx?id= 2147486380, Feb 2013, [Online; accessed 31-March-2014]. [9] M. Derawi, C. Nickel, P. Bours, and C. Busch, “Unobtrusive user-authentication on mobile phones using biometric gait recognition,” in Intelligent Information Hiding and Multimedia Signal Processing (IIH-MSP), 2010 Sixth International Conference on, Oct 2010, pp. 306–311.
V. C ONCLUSION In this paper, we have proposed an accelerometer-based gait authentication model that leverages information about the phone position to improve classification performance. Based on a combination of statistical tests and authentication results, we have shown the need for this model and the performance benefits it offers. As gait-based authentication technologies edge closer towards being deployed as a security layer in smartphones, our findings represent an important step towards improving the performance of these systems.
[10] F. Juefei-Xu, C. Bhagavatula, A. Jaech, U. Prasad, and M. Savvides, “Gait-id on the move: Pace independent human identification using cell phone accelerometer dynamics,” in Biometrics: Theory, Applications and Systems (BTAS), 2012 IEEE Fifth International Conference on, Sept 2012, pp. 8–15. [11] A. Bourke, J. OBrien, and G. Lyons, “Evaluation of a threshold-based tri-axial accelerometer fall detection algorithm,” Gait and Posture, vol. 26, no. 2, pp. 194 – 199, 2007. [Online]. Available: http://www.sciencedirect. com/science/article/pii/S0966636206001895
ACKNOWLEDGMENT We thank Sujit Poudel for his help during the design and implementation of the Android data collection application.
[12] J. H. Choi, J. Lee, H. T. Hwang, J. P. Kim, J. C. Park, and K. Shin, “Estimation of activity energy expenditure: Accelerometer approach,” in Engineering in Medicine and Biology Society, 2005. IEEE-EMBS 2005. 27th Annual International Conference of the, Jan 2005, pp. 3830–3833.
R EFERENCES [1] L. Atallah, B. Lo, R. King, and G.-Z. Yang, “Sensor positioning for activity recognition using wearable accelerometers,” Biomedical Circuits and Systems, IEEE Transactions on, vol. 5, no. 4, pp. 320–329, Aug 2011.
[13] L. Atallah, G. G. Jones, R. Ali, J. J. H. Leong, B. P. L. Lo, and G.-Z. Yang, “Observing recovery from knee-replacement surgery by using wearable sensors.” in BSN, 2011.
104
[14] P. Maziewski, A. Kupryjanow, K. Kaszuba, and A. Czyzewski, “Accelerometer signal pre-processing influence on human activity recognition,” in Signal Processing Algorithms, Architectures, Arrangements, and Applications Conference Proceedings (SPA), 2009, Sept 2009, pp. 95–99. [15] D. Gafurov, E. Snekkenes, and P. Bours, “Gait authentication and identification using wearable accelerometer sensor,” in Automatic Identification Advanced Technologies, 2007 IEEE Workshop on, June 2007, pp. 220–225. [16] J. Mantyjarvi, M. Lindholm, E. Vildjiounaite, S.-M. Makela, and H. Ailisto, “Identifying users of portable devices from gait pattern with accelerometers,” in Acoustics, Speech, and Signal Processing, 2005. Proceedings. (ICASSP ’05). IEEE International Conference on, vol. 2, March 2005, pp. ii/973– ii/976 Vol. 2. [17] D. Gafurov and E. Snekkkenes, “Arm swing as a weak biometric for unobtrusive user authentication,” in Intelligent Information Hiding and Multimedia Signal Processing, 2008. IIHMSP ’08 International Conference on, Aug 2008, pp. 1080–1087. [18] E. Vildjiounaite, S.-M. Mkel, M. Lindholm, R. Riihimki, V. Kyllnen, J. Mntyjrvi, and H. Ailisto, “Unobtrusive multimodal biometrics for ensuring privacy and information security with personal devices,” in Pervasive Computing, ser. Lecture Notes in Computer Science, K. Fishkin, B. Schiele, P. Nixon, and A. Quigley, Eds. Springer Berlin Heidelberg, 2006, vol. 3968, pp. 187–201. [Online]. Available: http://dx.doi.org/10.1007/11748625 12 [19] T. T. Ngo, Y. Makihara, H. Nagahara, Y. Mukaigawa, and Y. Yagi, “The largest inertial sensor-based gait database and performance evaluation of gait-based personal authentication,” Pattern Recognition, vol. 47, no. 1, pp. 228 – 237, 2014. [Online]. Available: http://www.sciencedirect. com/science/article/pii/S003132031300280X [20] T. Feng, X. Zhao, and W. Shi, “Investigating mobile device picking-up motion as a novel biometric modality,” in Biometrics: Theory, Applications and Systems (BTAS), 2013 IEEE Sixth International Conference on, Sept 2013, pp. 1–6. [21] M. A. Hall and G. Holmes, “Benchmarking attribute selection techniques for discrete class data mining,” IEEE Trans. on Knowl. and Data Eng., vol. 15, no. 6, pp. 1437–1447, Nov. 2003. [Online]. Available: http: //dx.doi.org/10.1109/TKDE.2003.1245283 [22] M. H. Gail and S. B. Green, “Critical values for the onesided two-sample kolmogorov-smirnov statistic,” Journal of the American Statistical Association, vol. 71, no. 355, pp. pp. 757–760, 1976. [23] I. H. Witten and E. Frank, Data Mining: Practical Machine Learning Tools and Techniques, 2nd ed. San Francisco: Morgan Kaufmann, 2005.
105