sensors Article
Context Relevant Prediction Model for COPD Domain Using Bayesian Belief Network Hamid Mcheick 1, * 1 2
*
, Lokman Saleh 2 , Hicham Ajami 1 and Hafedh Mili 2
Computer Science Department, University of Quebec at Chicoutimi, Chicoutimi, QC G7H 2B1, Canada;
[email protected] Computer Science Department, University of Quebec at Montreal, Montreal, QC H2L 2C4, Canada;
[email protected] (L.S.);
[email protected] (H.M.) Correspondence:
[email protected]; Tel.: +1-418-545-5011 (ext. 5676)
Academic Editor: Francisco Javier Falcone Lanas Received: 1 May 2017; Accepted: 14 June 2017; Published: 23 June 2017
Abstract: In the last three decades, researchers have examined extensively how context-aware systems can assist people, specifically those suffering from incurable diseases, to help them cope with their medical illness. Over the years, a huge number of studies on Chronic Obstructive Pulmonary Disease (COPD) have been published. However, how to derive relevant attributes and early detection of COPD exacerbations remains a challenge. In this research work, we will use an efficient algorithm to select relevant attributes where there is no proper approach in this domain. Such algorithm predicts exacerbations with high accuracy by adding discretization process, and organizes the pertinent attributes in priority order based on their impact to facilitate the emergency medical treatment. In this paper, we propose an extension of our existing Helper Context-Aware Engine System (HCES) for COPD. This project uses Bayesian network algorithm to depict the dependency between the COPD symptoms (attributes) in order to overcome the insufficiency and the independency hypothesis of naïve Bayesian. In addition, the dependency in Bayesian network is realized using TAN algorithm rather than consulting pneumologists. All these combined algorithms (discretization, selection, dependency, and the ordering of the relevant attributes) constitute an effective prediction model, comparing to effective ones. Moreover, an investigation and comparison of different scenarios of these algorithms are also done to verify which sequence of steps of prediction model gives more accurate results. Finally, we designed and validated a computer-aided support application to integrate different steps of this model. The findings of our system HCES has shown promising results using Area Under Receiver Operating Characteristic (AUC = 81.5%). Keywords: context-aware applications; health care system; Bayesian Belief Network; ubiquitous and ambient computing; chronic pulmonary disease
1. Introduction People are currently surrounded by technology increasing their quality of life and facilitating their daily activities. However, there are situations where technology is either difficult to handle or people lack of knowledge about how to use it. Context-aware intelligent systems try to simplify the interaction between technology and people, by predicting and adapting to their needs. These systems are based on context which is defined as any information used to characterize the situation of an entity. An entity can be a person, a place or an object [1]. Thus, the context includes both users and environment information. This information is important to define the interaction between users and the technology that surround them based on the context aware application. One of the most important issues about context-aware systems is the uncertainty of the context and the prediction of relevant attributes. This uncertainty may concern inadequate information such Sensors 2017, 17, 1486; doi:10.3390/s17071486
www.mdpi.com/journal/sensors
Sensors 2017, 17, 1486
2 of 24
as inexactness, unreliability, and border with ignorance [2]. The most used techniques to handle this issue are Naïve Bayesian, Bayesian Belief Network (BBN), decision tree, and neural networks. In this paper, we focus on the Bayesian belief network technique to select relevant attributes and use it to predict e exacerbation that suffers from the uncertainty in COPD area. COPD infections are a combination of small airway obstruction and alveolar destruction, phenomena known as chronic bronchitis and emphysema. Unfortunately, there is no treatment for COPD, or rather there is no cure to reverse the damage done to the airways and lung function, but therapy can slow its progress, reduce complications, improve quality of life [3] and avoid exacerbation that is the main reason leading to rapidly worsening of health conditions [4,5]. Here we will focus on the exacerbation, which does not even have a clear definition because the true relationship between risk factors and the development of exacerbations are not fully understood [6]; each one has different signs and symptoms [7], even biomarkers cannot be relied upon to distinguish between COPD cohort at stable state and at exacerbation [8]. However, generally, exacerbation defined as involves impaired lung function, acute event, or sudden worsening of COPD symptoms likely to cause death [6]. Thus, because the fluctuation and the diversity of exacerbation symptoms, the predicting of frequent exacerbations is needed to plug the uncertainty gap where logical processing (If-Else) does not work, and to select the relevant symptoms or attributes. In this context, Bayesian network has proven its efficiency to handle uncertainty in intelligent environments, more particularly those involving medical applications [8]. Bayesian network has a great reputation; it is used in many sensitive applications, like detecting brain tumors [9], predicting the risk of death among patients waiting for heart surgery [10], and identifying exacerbations of asthma patients [11]. Similarly, National Aeronautics and Space Administration (NASA) has used the Bayesian network in their Vista applications to provide guidance on the possibility of failures in space shuttle propulsion systems [12]. In this setting, and in order to select the relevant attributes, we propose to test four cited algorithms, CFS, Gain Ration, Wrappers-Genetic, and Wrappers-BestFirst. These four algorithms are not used before in the context of COPD based on our review [13,14]. Exacerbation may contribute to dangerous consequences such as premature death [3], degradation of quality of life [12], and deterioration of respiratory function [15]. This situation can last for several days to several weeks [16], which requires immediate hospitalization [17]. That is why we desperately need to prevent exacerbation in COPD. Thus far, no treatment has been found to cure, stop, or prevent exacerbation. The existing medication only dilates the bronchi allowing more air into the alveolus [18]. Therefore, rapid detection of an exacerbation can reduce its effects, facilitate lungs recovery [19], and avoid their transition to the higher level of COPD disease, increasing morbidity and disability [20] in the process. Thus, daily monitoring of COPD by using context aware application is an essential step to prevent the occurrence and the risk of exacerbation. In summary, this article focuses on select the relevant attributes, predict exacerbation, compare different scenarios of selection and prediction algorithms, and create a context aware application that may help both COPD patients and the medical staff. Recently, there has been growing interest in COPD, but all similar proposals still do not provide an effective solution, as we will discuss in Section 2. Section 3 surveys the common existing techniques and algorithms used in context aware systems. Section 4 presents a model and develops computer-aided support, using the Bayesian network based on contextual information, to detect when patient may be prone to exacerbations; it offers a new opportunity for early medical interventions (Doctors, Nurses, etc.). This contextual application will bring many informatics benefits such as executing all aspects of autonomously (using algorithms in many steps instead of pulmonologists consultation) that provide a good predictive capacity using Area Under Receiver Operating Characteristic (AUC = 81.5%), select the relevant attribute and arrange them to promote precision. This application can avoid unexpected medical visits, reducing the cost of hospitalization, making patients feel more involved and in control of their own illness, alleviating overcrowding in emergency rooms, hospitals or clinics [20], and prolonging life [21].
Sensors 2017, 17, 1486
3 of 24
An implementation, validation and results of our model are given in Section 4. We conclude this article and give future perspectives in Section 5. 2. Issues Remote monitoring of COPD patient is an interest topic, but the published works in this domain lack of the automation (automatic data processing) [20,22]. Over the past months, we examined similar types of information system in order to propose a new improved solution. During this review, we distinguished three types of monitoring systems: (i) telehealth communication systems; (ii) automatic alerts systems (automatic data processing); and (iii) systems that address the selection of relevant attributes in COPD. Telehealth technology aims to create better-informed environment of personalized health care. The first COPD monitoring system was implemented by [23], this project was using the traditional telephone line to send oxygen saturation (SAO2) data and heart rate to specialists. In a related works, Vontetsianos et al. [24] proposed a simple model where the nurse visits patients approximately 0.8 times per month equipped with medical and electronic devices to ensure the communication between physicians and patients. In this setting, [22] addressed how patient personally responds to questionnaires on a daily basis by a four-button device called healthBuddy to be evaluated by nurses at the hospital. All these systems do not take the exacerbation problem into consideration, but only focus on COPD generally. The mentioned propositions require a persistent connection to the network and the specialists [22], making treatments quite expensive as a manual analysis is needed to complete the medical test [23,24]. Moreover, Mclean et al. [25], assured that this kind of healthcare was ineffective because the mortality rate has increased with the use of these kind of systems. The emergence of automated systems eliminates the need for physicians’ interference to accomplish the primary tasks of detecting the disease. In this regard, Halpin et al. [26] reported a strong seasonality between meteorological factors and the incidence of exacerbation, but this system lacks an appropriate and immediate response to each patient. On the other hand, Yañez et al. [27] concluded that the rate of respiration increases significantly a few days before the exacerbation, but instrument measuring oxygen consumption rates are usually cumbersome, expensive and difficult to use. In the other side, the predictive capacity of exacerbation in this model is moderate with AUC (Area Under Receiver Operating Characteristic) = 76%. In 2013, Van der Heijden et al. [20] proposed a predictive model using a Bayesian network. This model was not fully autonomous because the authors have recourse to experts (pneumologists) to define the dependency between the attributes, which limit the future evolution of the predictive model. Similarly, Ryynänen et al. [28] developed a Naïve Bayesian to predict the possibility of mortality among COPD’s patients, this model did not consider exacerbation, and the prediction accuracy was very modest and did not exceed 69% by using AUC. The ambiguity and the presence of unknown and large exacerbation factors induce the bioinformatics systems to select relevant factors or attributes. Recently, Himes et al. [13] identified the relevant factors influencing the progression of asthma patients to COPD, using the Bayesian network, K2 [29], and the Markov Blanket. However, these studies do not take into account the exacerbation of COPD. Furthermore, Raghavan et al. [30] have identified a combination of 8 elements of the CAT (COPD Assessment Test) with other known predictors of COPD (age, gender, etc.) to detect the exacerbation of the same accuracy as the spirometry, using Stepwise logistic regression method. The weakness of this model is that the predictive capacity of the final model was moderate, AUC = 77%. In Amalakuhan et al. [14], the authors relied on the Random-Forest (RF) model to determine the factors that strongly correlate with hospital readmissions of COPD’s patients, the AUC of this system was also moderate (0.75%) and it does not deal with exacerbation. Discussion In our previous work [31], we focused on selecting relevant attributes. These attributes are most likely to detect exacerbation in patients with COPD. For that purpose, we used the Naïve Bayesian
Sensors 2017, 17, 1486
4 of 24
classifier. Our result was promising (AUC = 80%) compared to existing work such as [14,27,28,30]. We would like to mention that the area under the receiver operating characteristic curve (AUC) was the metric of evaluation [32]. The main objective of this research work is to detect relevant attributes and predict exacerbation of COPD patients. For this reason primarily, we seek to improve the performance of the prediction by using the Bayesian network. The second step in solving this problem was adopting MDL discretization method of Fayyad and Irani’s to replace the medical experts [13,20,28], such system could work autonomously without any intervention of pneumologists while keeping a high performance of prediction. Thirdly, we selected the relevant attributes based on Bayesian network using Wrapper-BestFirst. Fourthly, we compared TAN and K2 methods to create the belief network from a learning base instead of relying on pneumologists, as we have seen in [20]. Then, we arranged the relevant attributes based on GainRation formula, and we demonstrated the effectiveness of this order to increase the accuracy (AUC) of prediction by observing a new attribute, instead of randomly choosing it. Finally, all of these methods and algorithms mixed together in perfect harmony to form our prediction model (Section 4). The proposed model is a new contribution that can be applied to various types of prediction in different fields. As case study, a contextual application based on the following technologies: Weka, Netica-j, and NetBeans prove the concept of this model. This application can identify the relevant attributes and predict effectively the occurrences of exacerbation of COPD’s patients with an accuracy = 81.5%. 3. Related Works The ubiquitous computing systems, introduced by Mark Weiser in 1993 [33], are based on the notion of context-awareness making devices more intelligent, able to recognize the surrounding entities and to react to changing circumstances and environments. This section summarizes the related works for representing the context, predicting the context-relevant attributes, and surveying reasoning methods. 3.1. Context Aware Systems 3.1.1. The Importance of Context in Healthcare Often, it does not make sense to understand the physical and biological variations that happen to your body isolated from their context; occasionally even those basic processes related to the human genomes require consideration of environmental and social context to discover the real reasons of mutations [34]. The use of context has proven its efficiency for all real-time monitoring system [35] that may provide the proper services to patients and detect the emergency situation when needed [36]. The published works in this domain reveal the existence of hundreds of healthcare systems that depend entirely on context aware models [37]. This feature has been applied to a number of hospital projects, such as Bhattacharyya et al. [38] that discussed the influence of the patient activity, the home environment, and relaxation on the progression of brain tumor which is reflected in the type of provided care. In a related development, Garcia-Valverde et al. [39] proposed a context-aware system that is able to determine the kind of activities that do not pose a grave threat to the lives of heart diseases patients. Similarly, Kennedy et al. [40] addressed how patients manage their conditions according to their local context, socioeconomic circumstances and domestic and family arrangements. In this setting, Bayliss et al. [41] confirmed that consistent attention to contextual factors is an urgent need to enhance health research for persons with multiple chronic conditions to make health care more sustainable, safe, equitable and effective, to reduce suffering, and to improve quality of life. Another important work [42] proposed a medical diagnosis approach to provide tracking services based on contextual information collected by analyzing life habits and bio status to chronic disease patients.
Sensors 2017, 17, 1486
5 of 24
The context has become an integral part of the world of bioinformatics, relying upon context can Sensors 2017, 17,you 1486 the ability to make the suitable decisions. In this study, we are only interested 5 of in 24 always give the medical context, or the contextual factors that affect and guide decision-support system. Medical context is defined as a representation of a disease by investigating a patient’s signs, symptoms, context is defined as a representation of a disease by investigating a patient’s signs, symptoms, syndromes, co morbidities and social issues, characteristics of patient, risk factors and history, which syndromes, co morbidities and social issues, characteristics of patient, risk factors and history, which provide a solid structure for the treatment on individual basis [43]. provide a solid structure for the treatment on individual basis [43]. Hence, in the field of the COPD and according to two statistical surveys [44,45], lung disease Hence, in the field of the COPD and according to two statistical surveys [44,45], lung disease symptoms are closely linked to the demographic features of the patients such as age, gender, country, symptoms are closely linked to the demographic features of the patients such as age, gender, education level, income level, marital status, and occupation. Moreover, in a recent study, Roche et country, education level, income level, marital status, and occupation. Moreover, in a recent study, al. [46] concluded that for a given age and level of airflow obstruction, women with COPD experience Roche et al. [46] concluded that for a given age and level of airflow obstruction, women with COPD different intensity of dyspnea than men. Similarly, age was shown to constitute strong risk factor for experience different intensity of dyspnea than men. Similarly, age was shown to constitute strong risk COPD under the standard diagnostic criteria [47]. Furthermore, according to [48], cold and hot factor for COPD under the standard diagnostic criteria [47]. Furthermore, according to [48], cold and weather, below freezing and above 90 °F (32 °C), are very dangerous. Exposure to air pollutants either hot weather, below freezing and above 90 ◦ F (32 ◦ C), are very dangerous. Exposure to air pollutants indoor or outdoor could irritate the lungs to suddenly flare up [49]. Researchers have found also that either indoor or outdoor could irritate the lungs to suddenly flare up [49]. Researchers have found also anxiety, depression, or the combination of both was significantly associated with poor response to that anxiety, depression, or the combination of both was significantly associated with poor response to treatment in a large sample of COPD patients [50], and so on. treatment in a large sample of COPD patients [50], and so on. Based on this literature review, we can simply deduce the context of the COPD in the meaning Based on this literature review, we can simply deduce the context of the COPD in the meaning of of symptoms, signs, etc. are not bounded, which cannot help us to focus on specified signs or symptoms, signs, etc. are not bounded, which cannot help us to focus on specified signs or symptoms. symptoms. In this case, the context definition is important. In this case, the context definition is important.
3.1.2. Context Context Definition Definition 3.1.2. Why define define context? context? The The definition definition of of context context helps to Why helps to to focus focus attention attention on on the the current current activity, activity, to formalize the concept of the context, and to guide the adaptation mechanism [51]. The idea of context formalize the concept of the context, and to guide the adaptation mechanism [51]. The idea of context dates back backtotothe theearly earlyofof 1993 and more specifically to Weiser [33] when he published a technical dates 1993 and more specifically to Weiser [33] when he published a technical study study describing the context such information that should be taken into consideration for an describing the context such information that should be taken into consideration for an adjustment. adjustment. Today, there are many definitions of context, some are concretes and others are more Today, there are many definitions of context, some are concretes and others are more abstract, but abstract, but the most used definition of this foundofin theetwords Dey et al. [52] the most used definition of this term could be term foundcould in thebewords Dey al. [52]of“Context is any “Context is any information that can be used to characterize the situation of an entity. An entity information that can be used to characterize the situation of an entity. An entity is a person, place,isora person, place, or objectrelevant that is to considered relevant to the interaction between a including user and the an object that is considered the interaction between a user and an application, application, includingthemselves”. the user and applications themselves”. user and applications From our point of view, we we find find that that all all existing existing contextual contextual definitions definitions are are either either very very general, general, From our point of view, making the formalization of the context very difficult, or specific to a particular case study. Therefore, making the formalization of the context very difficult, or specific to a particular case study. Therefore, we propose proposetotoadopt adopt definition al. “any [53]: piece “any of piece of information can represent we thethe definition of LiofetLial.et[53]: information that canthat represent changes changes of the circumstance (either static or dynamic). Further, it could be useful for understanding of the circumstance (either static or dynamic). Further, it could be useful for understanding the current the current situation andpotential predicting potential changes.” This caninbe adapted the case of situation and predicting changes.” This definition candefinition be adapted the case of in this research, this research, because it takes into consideration the prediction process, and the pertinent (useful) because it takes into consideration the prediction process, and the pertinent (useful) information. information. process is important to allow patients and/ordetect medical personnel ofdetect the This process isThis important to allow patients and/or medical personnel the possibility a disease possibility ofthe a disease general or the risk of exacerbation in COPD. in general or risk ofin exacerbation in COPD. Architecture of of Context-Aware Context-AwareSystems Systems 3.1.3. General Architecture general architecture of aa context-aware context-aware system system (Figure 1) is is decoupled decoupled into into the the following following The general subcomponents: context acquisition, representation of context, context reasoning, and context context acquisition, representation of context distribution [53]. [53]. These steps are described described below. below. distribution
Context Acquisition
Context Representation
Context Reasoning
Context Distribution
Figure 1. General architecture of a context-aware context-aware system system [53]. [53].
The acquisition represents the collection of data from both virtual and real application environment. To depict the observable environment, it is necessary to draft a conceptual model that organizes the context in a hierarchical way by describing its related attributes. The reasoning part allows the system not only to detect new context information; it also provides a way to resolve inconsistencies that may appear in the data while the distribution is responsible for disseminating
Sensors 2017, 17, 1486
6 of 24
The acquisition represents the collection of data from both virtual and real application environment. To depict the observable environment, it is necessary to draft a conceptual model that organizes the context in a hierarchical way by describing its related attributes. The reasoning part allows the system not only to detect new context information; it also provides a way to resolve inconsistencies that may appear in the data while the distribution is responsible for disseminating the information to the right application. In this paper, we focus on the representation and reasoning steps to predict the relevant-attributes related to COPD. 3.2. Context Representation Models and Comparison The context representation models refer to the approach that could draw a complete image of complete contextual information, in particular relevant ones. The recent surveys related to context models demonstrate the existence of six to twelve models, which can be found in [54,55]. Below, we give a brief overview of each model. At the end of this section, a brief comparison is given based on five given criteria. Key-value model: It is a classic form of representation where the contextual data could be depicted as numerical value or different attributes. “Key-value coding is a mechanism for accessing an object’s properties indirectly, using strings to identify properties, rather than through invocation of an access method or accessing them directly through instance variables” [56]. Mark-up Scheme Model: In this method, the information of context is reserved within typical tags such as XML. Usually, Mark-up Scheme is used for modeling profiles for example (device capabilities) [57]. Logical model: This model describes the required data as fact, terms and rules using first or second order logic. Logic-based is a special model where logic expressions define the main status which makes the reasoning process much easier [58]. Object Oriented Model: The object-oriented programming that represents data as objects is the main pillar of this model, “The basic idea behind OOP is the combination of data and the functions that operate on that data into one single entity” [59]. Graphical model: The context of this model is represented as graphical diagram whereas the Unified Role Modeling (UML) Entity Relationship Model (ERM) and Object Role Modeling (ORM) are considered the best graphical models [60]. Ontology Model: Ontology is a formal specification of a shared conceptualization of existing things using one of the description languages whether RDF (Resource Description Framework) or OWL (Ontology Web Language) [61]. Domain Focused: This model proposed a simple representation of context through answering the following questions: Who was the user? What was the activity being performed? Where the activity was performed (location)? When the activity was performed (time)? Spatial Representation: Spatial model uses location of people or devices as a single source to represent their contextual information [62]. Usually, there are two kinds of location which are supported by positioning systems: geometric and symbolic coordinates [54]. Multidisciplinary model: The multidisciplinary model is a demonstration of context from multiple disciplines and different points of view [53]. This approach is the best way to address the emanating issues of the transition from traditional static desktop computing to heterogeneous mobile environments [63]. User-centric: This model has been tailored on user’s perspective using 5W1H-tuple: Who, When, Where, What, How, Why to infer user’s intention [55]. Chemistry inspired Model: Chemistry model is similar to chemical reaction; the main feature is the capability to represents the context and triggers the right services dynamically [64]. Hybrid model: The hybrid model is a combination of two or more existing context-representation models in order to get flexible architecture from multi-layer [65].
Sensors 2017, 17, 1486
7 of 24
Analysis of these models: The best representation of context is one that could simulate the realistic picture of targeted attributes. For more information about the advantages and disadvantages of these models, please refer to our previous work [63]. The ubiquitous healthcare systems should ensure the distribution, mobility, reasoning, expressiveness and validation tools, ambiguity and applicability of the existing environment. The table below provides a comparison between all the existing context models based on the information presented in [54,66,67]. In the comparison below, we used “+” to define the characteristic types supported by each model, while we use “++” to denote high degree of support, “-” to denote the kind of characteristic which cannot be supported by this representation scheme, and “o” when it is not clear whether this feature is supported or not. In our comparison (Table 1), it is clear from the Table 1 that performance of ontology exceeds all the others in terms of the requirements mentioned before. Moreover the recent representation of context is moving toward ontology due to its efficiency with data complexity and heterogeneity of sources. Despite its advantages, the ontology cannot handle the uncertainty and evaluate the current state [8]. Table 1. Comparison of identified context models based on five criteria.
Key-value Markup Graphical Object-oriented Logic Multidisciplinary Domain focused User centric Spatial Chemistry Ontology Hybrid
Mobility
Reasoning
Distribution
Expressiveness
Validation Tools
+ ++ -
o + o
+ ++ ++ o
+ + +
o + o -
-
+
o
+
-
+ ++ + +
+ + o ++ ++
o o + ++ ++
+ + + ++ ++
+ -
The problem of ontology: Ontology-based languages and tools are considered key technologies for the development of context-aware systems [68]. However, these languages make it possible to derive new knowledge by inference engines based on first-order logic, temporal logic, and so on [69]. For example, the OWL ontology language, which is much more expressive than other ontology languages such as RDFS, and which represents the semantic web key [70], cannot incorporate probabilities information to represent and manage uncertain events in a given context. However, taking into account uncertainty is an important issue in the exacerbation of COPD because the fluctuation and diversity of observed symptoms of exacerbation that can appear with normal breathing [71]; even there is no biological marker having been reliably demonstrated the difference between stable COPD and an exacerbation [72], making the development pattern in case of exacerbation [73]. Uncertainty was the reason which prompted Gu et al. [74] to extend their ontology model to a probabilistic model using Bayesian network but based on an expert. 3.3. Context Reasoning Algorithms Machine learning is usually divided into two main types: the predictive learning or supervised learning and unsupervised or descriptive. In the case of our research, the classification will be objective because the class of attributes will distinguish between patients who are likely to have an exacerbation and those who are not at risk.
Sensors 2017, 17, 1486
8 of 24
In the next subsections, our review focuses on the algorithms used during the pre-processing and data processing phase, namely the discretization and selection of relevant attributes. We also briefly discuss two algorithms for building a belief network from data in the case of the Bayesian network. The latter is the learning method used in this work. 3.3.1. Bayesian Network The Bayesian network was strongly highlighted in literature [12]. It is often considered as an evolution of the Naïve Bayesian. The Bayesian network is an oriented and acyclic graph, in which the nodes represent attributes while the edges describe the dependency relations. Each node (or attribute) in the Bayesian network can have several states; the states are enumerated in a conditional probability table (CPT), depending on all possible states of their parents. In contrast, the Bayesian network can create a good inference with the available observations. Hence, this network does not require complete and full knowledge of attributes when making inferences. Moreover, the Bayesian network is not limited to recognizing the most probable state of node; it can also find the causes of the state, such as P (cause/state). Formally, a Bayesian network is defined by the pair (G, V), “G” represents a graph, and “V” the set of attributes (V 1 , V 2 ..., Vn ) in the graph G. Inference in the Bayesian network is based on the following joint probability: n
P(V1 , V2 ... , Vn ) =
∏ P(Vi | Pa(Vi ))
(1)
i =1
Pa (Vi) is the set of parents of the node Vi . 3.3.2. The Dependency Structure between Attributes The most common approaches used in machine learning (e.g., Naïve Bayesian, decision tree, etc.) are often limited to a single representation between the attribute class and the predictive variables, while the Bayesian network has the ability to draw complex relationships between attributes to understand their real dependencies. The orientation of Bayesian network provides a simple and effective way for expressing assumptions of dependency between attributes, guiding interpretation, saving enormous computation during inference, and minimizing allocated space in memory [75]. In this context, the causal (cause-effect) relationships can be found in a Bayesian network, but their evidence requires a comprehensive and isolated study by experts (e.g., physicians) to understand relation between attributes. This latter method (based on expert), is the most intuitive way to build the dependency structure, and may suffer from a common problems, such the lack of a standard knowledge between all the experts, depends on the experts experience, inaccurate, manual processing, and inability to provide an in-depth analysis for large domains [76]. To avoid these challenges, the creation of Bayesian network based on data can facilitate and speed up the construction of that hierarchical grid. This methodology is based on probabilistic dependencies which can quantitatively denote the correlation between attributes. The naive idea of building a Bayesian network from the learning base is to browse all possible networks, and to choose the graph with highest score (best network) according to an evaluation method. However, this exhaustive path is super-exponential [77]. Consequently, to carry out the research in a reasonable amount of time, we have to use heuristic technique. Basically, there are two algorithms to identify the probable dependency network from the learning base, namely TAN (Tree Augmented Naïve Bayes) and K2. Algorithm K2 The K2 algorithm is a common and efficient approach [78]. This algorithm uses heuristic analysis to identify the appropriate dependency network based on a learning paradigm. Firstly, K2 assumes a
Sensors 2017, 17, 1486
9 of 24
given (random) order of nodes (attributes); according to the rules of construction, a node cannot be the parent of a preceding one (the first node has no parents). Secondly, this method processes each node separately by adding edges from previous edited nodes to the current one and the Bayesian measure (metric to calculate the network score, assigned by [29]) is counted. Finally, the parents maximizing the network score (Bayesian measure) are chosen. During implementation, a maximum number of parents for each node must be specified. Usually, this number varies within N = 1, 2, or 3. The first Sensors 2017, 17, 1486 9 of 24 parent is an arrow from the attribute class (that means, for N = 1, the Network remains like that of the that of the Naive second or third parentaccording is selectedtoaccording to the scheduling (order) Naive Bayes). The Bayes). second The or third parent is selected the scheduling (order) of the nodesof thethe nodes and the Bayesian measure. For more details, see [29,78]. and Bayesian measure. For more details, see [29,78]. TAN Augmented Naive Bayes) TANAlgorithm Algorithm(Tree (Tree Augmented Naive Bayes) As Asitsitsname nameindicates, indicates,this thismethod methodconsiders considersthe thenetwork networkofofthe thenaive naiveBayes Bayesclassifier classifierand andadds adds additional additionaledges edgesbetween betweenthe thenodes nodesasasa atree treeform. form.This Thismethod methodhas hasshown shownexcellent excellentperformance, performance, despite despiteitsitssimplicity simplicityand andstrong strongunderlying underlyingassumptions assumptionsofofindependence independence[79]. [79].The TheTAN TANnetwork networkisis restricted restrictedby bythe thenumber numberofofparents parentsofofthe theattributes. attributes.To Toclarify clarifythis thisfurther, further,the theattribute attributeclass classhas hasno no parents; parents;all allother otherattributes attributeshave havethe theattribute attributeclass classand andatatmost mostone oneother otherparent. parent.Therefore, Therefore,TAN TANisis obtained obtainedby byfinding findingthe thebest besttree treethat thatconnects connectsthe theobservations observations(attributes (attributeswithout withoutthe theattribute attributeclass) class) using mutual information, which is the evolution of mutual information proposed by [80]. usingconditional conditional mutual information, which is the evolution of mutual information proposed by Then, related observations connect connect to the attribute class. Anclass. example a TAN model is shown [80]. all Then, all related observations to the attribute An of example of a TAN modelinis Figure shown2.in Figure 2.
Figure2.2.Tree Tree Augmented Naive Bayes (TAN) based (Naïve Bayes); = attribute class, Figure Augmented Naive Bayes (TAN) based onon NBNB (Naïve Bayes); C =C attribute class, X1X. 1. .… attributesorornodes, nodes,the thenumber numberbetween betweentwo twonodes nodesisisconditional conditionalmutual mutualinformation. information. XX 3 3==attributes
Then,totobuild buildthe theTree TreeAugmented AugmentedNaive NaiveBayes Bayes(TAN), (TAN), [79] proposes the following procedure: Then, [79] proposes the following procedure: 1. Compute conditional mutual information (based on entropy [81]), between all attribute pairs 1. Compute conditional mutual information (based on entropy [81]), between all attribute pairs given the attribute class (Figure 2a). given the attribute class (Figure 2a). 2. Build a tree that maximizes the mutual information between each two attributes (Figure 2b,c). 2. Build a tree that maximizes the mutual information between each two attributes (Figure 2b,c). 3. Transform the non-directed tree to a directed one, choosing a root variable and the direction of 3. Transform the non-directed tree to a directed one, choosing a root variable and the direction of all all edges outside it (Figure 2d). edges outside it (Figure 2d). 4. Link all the observations to the attribute class (Figure 2e). 4. Link all the observations to the attribute class (Figure 2e). Thus, next section describes the proposed solution to identify relevant attributes and detect Thus, nextlevel section describes the proposed solution to identify relevant attributes and detect exacerbations of COPD’s patients. exacerbations level of COPD’s patients. 3.3.3. Technics and Algorithms to Select Relevant Attributes 3.3.3. Technics and Algorithms to Select Relevant Attributes Intuitively, to choose the relevant attributes, we must evaluate 2N subsets to realize these N Intuitively, choose relevant attributes, we must evaluate realize theseof conditions (the to number “2”the refers to selected or non-selected attribute,2andsubsets N is thetototal number conditions (the number “2” refers to selected or non-selected attribute, and N is the total number of attributes). This method can choose the best subset of attributes but it is exhaustive and very costly in practice [82]. Several methods have been suggested to solve this problem and reduce the complexity of the research. Heuristic research is considered one of the best available methods. In all these suggestions of selecting relevant attributes, we need a starting point, an evaluation strategy and a stopping criterion. These steps are described as follows:
Sensors 2017, 17, 1486
10 of 24
attributes). This method can choose the best subset of attributes but it is exhaustive and very costly in practice [82]. Several methods have been suggested to solve this problem and reduce the complexity of the research. Heuristic research is considered one of the best available methods. In all these suggestions of selecting relevant attributes, we need a starting point, an evaluation strategy and a stopping criterion. These steps are described as follows: 1.
The starting point: It is a set of attributes, from which the selection process can begin to affect the direction of the search, e.g., the search can begin with all existing attributes in the database or Sensorswith 2017, no 17, 1486 10 of 24 attribute. 2. Research organization: It is the strategy that generates a subset of attributes, which will be tested 2. Research organization: It is the strategy that generates subset offeasible attributes, which will be where tested by the evaluation method. Heuristic search strategiesaare more than exhaustive by the evaluation method. Heuristic search strategies are more feasible than exhaustive where they often yield good results [82], e.g., Best-First Heuristic Research. they often yield good results [82], e.g., Best-First Heuristic Research. 3. Evaluation strategy: How to evaluate the selected subsets of attributes? It can be seen as 3. Evaluation strategy: How to evaluate the selected subsets It canis be seen as distinguishing method between the selections algorithms. The of roleattributes? of this function to measure distinguishing method between selections algorithms. role ofstates this function is to measure the discrimination capacity of athe subset attributes in orderThe to tell the of the attribute class, the discrimination capacity of a subset attributes in order to tell the states of the attribute class, e.g., the Gain measure. e.g., the Gain measure. 4. Stop criterion: To stop the search through the space of the attribute subset, this criterion is used. 4. Stop criterion: To stop the search through the space of the attribute subset, this criterion is used. This criterion is defined according to the research procedure and the evaluation strategy. This criterion is defined according to the research procedure and the evaluation strategy. The algorithms for selecting relevant attributes fall into two broad categories: Wrappers that use The algorithms for selecting relevant attributes fall into two broad categories: Wrappers that use the learning algorithm itself, to evaluate the utility of subset attributes and Filters that evaluate the the learning algorithm itself, to evaluate the utility of subset attributes and Filters that evaluate the subsets attributes according to heuristics measurements. subsets attributes according to heuristics measurements. The filtering methods are more used [83], due to its speed compared with wrappers methods, The filtering methods are more used [83], due to its speed compared with wrappers methods, which are used on a large learning base [82]. However, with wrappers, the obtained result is concretely which are used on a large learning base [82]. However, with wrappers, the obtained result is integrated with the classification algorithm. concretely integrated with the classification algorithm. In this Work, we used four algorithms to select the relevant attributes, which are decomposed In this Work, we used four algorithms to select the relevant attributes, which are decomposed into two types, as below: into two types, as below: (1) Wrappers Wrappers Algorithms; Algorithms; and and (1) (2) Filters FiltersAlgorithms. Algorithms. (2) Firstly, what is the idea of Wrappers Wrappers algorithms? algorithms? Figure 3 shows the Wrappers selector algorithms to classify relevant attribute and to evaluate Figure quality of a particular subset. This This subset subset is is chosen chosen by the search algorithm, which is wrapped the quality around the classifier until the most relevant subset of attributes is obtained, while respecting the around stopping criterion.
Figure 3. Architecture of Wrappers selectors relevant attributes [84]. Figure 3. Architecture of Wrappers selectors relevant attributes [84].
Consequently, in whatever Wrappers algorithm, we have to identify two main steps to achieve the selection of relevant attributes. (1) The classifier; and (2) The search algorithm In our case study, the classifier is the Bayesian network, which is built from data base by using
Sensors 2017, 17, 1486
11 of 24
Consequently, in whatever Wrappers algorithm, we have to identify two main steps to achieve the selection of relevant attributes. (1) (2)
The classifier; and The search algorithm
In our case study, the classifier is the Bayesian network, which is built from data base by using TAN (tree augmented naïve Bayes) algorithm, and evaluated by 10 cross validation using AUC (Area under the receiver operating characteristic (ROC) curve) as an evaluation metric. Therefore, the Bayesian network, built by TAN and evaluated by AUC, is used as an evaluator of each subset selected by the search algorithm, in our project. Hence, we left us to select the research algorithm that represent the key factor of Wrappers algorithms and make the different between them. For that, we have identified several search algorithms, but in our project we present those most commonly used by the computer science community, namely the Genetic and the BestFirst algorithms. Genetic Algorithm: The genetic algorithm is able to efficiently explore a large research space [85]. It is a research algorithm inspired by the principle of natural selection and whose basic idea is to evolve an initial population of individuals in order to evaluate the final population and choose the individual with the highest score and represent the solution. In our case, a population will be a set of individuals. An individual is a subset of attributes that represents one of the solutions. A gene will be a part of the solution as an attribute. Thus, generation is an iteration in the algorithm when the following three operators are applied to the population, reproduction, crossing and mutation. This procedure wrapped around a learning algorithm (Bayesian network) until the stop criterion was met. In our work, this criterion corresponds to the number of generations to be evaluated, which is equal to 20. In addition, initially, the population equals 20, and the size of each individual (the number of attributes in a subset) is randomly chosen. Best-First: This is a preferred method for searching with the Wrapper selector [86]. Usually, the Best-First starts with an empty set (Forward Selection) and then generates all the possibilities of the subsets containing a single attribute. Then, the subset with the highest evaluation value is chosen based on the learning method: in this article, we use Bayesian network as a learning algorithm. This subset is expanded in the same way by adding a new attribute, and we do the evaluation with all possibilities of two attributes, and so on. Given enough time, a Best First search will explore the entire search space [78], so it is common to limit the number of subsets expanded that result in no improvement, to avoid exhaustive search. This number is specified as 5 in our case. Secondly, what is the idea of Filters algorithms? Filtering methods are mainly used in practice [83] and are generally much faster than Wrappers, and they are used more for large learning bases [87]. However, with the Wrappers, the result is concretely integrated with the classification algorithm (evaluation method) used, but the Filters algorithms use general heuristics (the Measuring in Figure 4) to evaluate a subset with respect to the attribute class (Target). The evaluation method is the key factor that makes the difference between the Filters algorithms. In this paper, we have discussed the two methods most used in the research market that are: (A) Correlation-based Feature Selection (CFSsubsetEval) and (B) Gain Ratio Attribute Eval. Correlation-based Feature Selection (CFSsubsetEval): As with all filter methods, the core of the CFSsubsetEval algorithm is the evaluation heuristic. This heuristic takes into account the influence of an attribute and the inter-correlation between the attributes on the target class. The hypothesis on which this heuristic is based is as follows: “Good feature subsets contain features highly correlated with (predictive of) the class, yet uncorrelated with (not predictive of) each other” [82].
Filtering methods are mainly used in practice [83] and are generally much faster than Wrappers, and they are used more for large learning bases [87]. However, with the Wrappers, the result is concretely integrated with the classification algorithm (evaluation method) used, but the Filters algorithms use general heuristics (the Measuring in Figure 4) to evaluate a subset with respect to the attribute class (Target). The evaluation method is the key factor that makes the difference between Sensors 2017, 17, 1486 12 of 24 the Filters algorithms.
Figure 4. Architecture Architecture of Filters selectors relevant attributes [84].
In this paper,used we have discussed the two algorithm methods most used inathe research market that are: (A) The formula by the CFSsubsetEval to evaluate subset of continuous attributes Correlation-based Feature Selection (CFSsubsetEval) and (B) Gain Ratio Attribute Eval. (for discrete attributes there is another formula) is as follows: Correlation-based Feature Selection (CFSsubsetEval): As with all filter methods, the core of the krzi CFSsubsetEval algorithm is the evaluation heuristic. This heuristic takes into account the influence rzc = p of an attribute and the inter-correlation between k +the k −attributes (k − 1)riion the target class. The hypothesis on which this heuristic is based is as follows: “Good feature subsets contain features highly correlated where, with (predictive of) the class, yet uncorrelated with (not predictive of) each other” [82]. rThe The “merit” between a subset c containing k attributes, the attribute class z. zc =formula usedcorrelation by the CFSsubsetEval algorithm to evaluate a subset and of continuous attributes k = Number of attributes in the subset. (for discrete attributes there is another formula) is as follows: rzi = Average correlation between attributes and attribute class. rii = Average of the inter-correlation (attribute-attribute). First, CFS calculates the averages and then uses the Best-First search method to find a subset. As discussed in the above section, the stop criterion in this search method is the number of subsets expanded (revise BestFirst Algorithm) and the value of rzc is not improved. This number is 5. Gain Ratio Attribute Eval: The Gain Ratio (GR) measure is used to evaluate each attribute by measuring their rate of gain relative to the attribute class. GR is the modification of the Gain or Gain information to reduce its bias using SplitInfo [88]. GainRatio (T, A) =
Gain( T, A) SplitIn f o ( T, A)
T: Attribute class. A: The selected attribute to measure its gain. GainRatioAttributeEval uses the Ranker search method, which ranks attributes in ascending order, by individually evaluating each attribute based on the GR measure. The low Rank attributes are filtered to form a new reduced subset of the attributes [89]. In our experiment, we propose the threshold to exclude attributes with the GainRatioAttributeEval having a maximum value alpha = Max (Rank)/2. Thus, when an attribute has the value of GainRatio less than alpha, we will eliminate it from the learning base. 3.3.4. The Used Discretization Method According to [90], discretization is defined as follows: “the process of converting the range of possible values associated with a continuous data item (e.g., a double precision number) into a number of sub-ranges each identified by a unique integer label; and converting all the values associated with instances of this data item to the corresponding integer labels”. In fact, the domain expert (e.g., physician) makes the best discretization because it can adapt the data intervals to the context of the study and makes sense for the transformed attributes [91]. However,
Sensors 2017, 17, 1486
13 of 24
with a large learning base, the expert cost would be prohibitive, and, sometimes, the expert is not available. Then, it is necessary to find automated methods to discretize the predictive attributes. We observe some advantages in the literature for discretization methods, which are described as follows: Some learning methods cannot handle continuous attributes, a set of intervals are more cognitive than a series of numbers for human interpretation, the data processing will be faster with a reduced number of states; it is a way to improve the performance of the prediction system. According to Tanagra [91] and Weka [92], the methods of discretization of continuous attributes are divided into two categories: unsupervised and supervised discretization. Lustgarten et al. [93] have shown that, in classification, supervised discretization is more advantageous than unsupervised discretization. Precisely, Kotsiantis [94] found that the Fayyad and Irani’s method [95] can achieve the best result and it is used in this work. 4. Helper Engine Context Model for COPD Domain To resolve the problem described in the Section 2, we designed and validated a helper context engine system through six main steps as shown in Figure 5. All these steps are dedicated to select the relevant attributes and predict the exacerbation in high efficiency. (A) The acquisition of context is a critical step leads to determine the targeted components of context, based on the existing data base. In this study, we consider the exacerbation COPD disease as application domain. The scenario that can design this context aware application is represented by ontology. (B) The supervised Sensors 2017, 17, 1486 13 of 24 discretization method is applied (Fayyad and Irani’s MDL). (C) Relevant attributes are selected using Wrappers-BestFirst. TheThe prediction model was created using Bayesian network and TAN algorithm. Wrappers-BestFirst.(D) (D) prediction model was created using Bayesian network and TAN (E) The performance of the predictive model was evaluated using receiver operating characteristic algorithm. (E) The performance of the predictive model was evaluated using receiver operating (ROC) curves, with 10-Fold Cross Validation stratified. (F) The arrangement of the context characteristic (ROC) curves, with 10-Fold Cross Validation stratified. (F) The arrangementisofvery the important provide a high of precision in an case. context is to very important tolevel provide a high level ofurgent precision in an urgent case.
Figure 5. Prediction Model of our helper engine context system (HCES). Figure 5. Prediction Model of our helper engine context system (HCES).
4.1. The Representation Scenario of the COPD Context Aware Application 4.1. The Representation Scenario of the COPD Context Aware Application Due to the high degree of expressivity and the semantic richness of ontology model [55,96,97], Due to the high degree of expressivity and the semantic richness of ontology model [55,96,97], we we use this model of representation in our case of COPD to propose a general architecture that use this model of representation in our case of COPD to propose a general architecture that describe describe our domain to monitor the COPD exacerbations. Moreover, the ontology can help no our domain to monitor the COPD exacerbations. Moreover, the ontology can help no specialist people, specialist people, such as patient, doctor, etc. to understand where they can use this application. such as patient, doctor, etc. to understand where they can use this application. The creation of ontology: According to our review, we do not find any ontology that realizes a The creation of ontology: According to our review, we do not find any ontology that realizes a contextual framework for a general scenario that detects the exacerbation in COPD. Figure 6 shows contextual framework for a general scenario that detects the exacerbation in COPD. Figure 6 shows the ontology of intelligent system for COPD. In this ontology, circles define concepts, and each arrow the ontology of intelligent system for COPD. In this ontology, circles define concepts, and each arrow defines a relationship between these entities. The rectangles are added to display the relationship defines a relationship between these entities. The rectangles are added to display the relationship names. In addition, we use ∪ for the union of several concepts, and ∩ to make the intersection between names. In addition, we use ∪ for the union of several concepts, and ∩ to make the intersection between them. The ontology is created by Protégé tool. Thus, the ontology language used is OWL (Ontology Web Language). The visualization of the File.owl, is made by VisualOWL [98]. Scenario of ontology: Bob is affected by chronic obstructive pulmonary disease. It would be interesting, if an application offers him the ability to take care of himself by predicting the exacerbation or the pulmonary crisis before its occurrence. As shown in Figure 6, the prediction application must be installed on hospital servers to provide medical staffs (nurses, doctors) with relevant attributes and handle decisions more efficiently. In
Sensors 2017, 17, 1486
14 of 24
them. The ontology is created by Protégé tool. Thus, the ontology language used is OWL (Ontology Web Language). The visualization of the File.owl, is made by VisualOWL [98]. Sensors 2017, 17, 1486 14 of 24
Figure 6. Context ontology described entities to exacerbation detect exacerbation in Obstructive Chronic Obstructive Figure 6. Context ontology described entities to detect in Chronic Pulmonary Pulmonary Disease COPD. Disease COPD.
4.2. Experimentation and Results of the Selected Algorithms Scenario of ontology: Bob is affected by chronic obstructive pulmonary disease. It would be Thisifprediction modeloffers (Figure 5) the hasability been tested oncare contextual application helping and interesting, an application him to take of himself by predicting thepatients exacerbation medical staff to predict the occurrence of exacerbation. Our contribution lies in the creation of an or the pulmonary crisis before its occurrence. autonomous way of prediction. This gives the prediction model the ability to evolve over time by As shown in Figure 6, the prediction application must be installed on hospital servers to using new data base,(nurses, withoutdoctors) interventions of the experts (Pneumologists), based onmore Fayyad and provide medical staffs with relevant attributes and handle decisions efficiently. Irani’s MDL (Minimum Description Length) discretization method that can achieve the best result In addition, this application can monitor the patient at home. Once the application notifies the patient compared to other algorithms [93,94]. In the context of autonomy, and to keep a good precision of of an exacerbation, and the patient is not able to control his exacerbation state at home, the patient prediction (AUC), we compared two algorithms that realize the dependency between relevant can go to the clinic or hospital. In this case, the doctor or nurse can use the application to analyze the attributes TAN and K2, and four algorithms to select the relevant attributes (CFS, Gain Ration, detected observations to understand his condition without applying exhausting diagnostics. In this Wrappers-Genetic, and Wrappers-Best First). These three methods combined are applied to the scenario, the “Doctor” class can make additional examinations, such as X-Ray, PaCO2, etc. to take final Bayesian network to obtain an ideal inference or what we call prediction. decisionDuring or to ensure the result we obtained the application. this experiment, used a by learning base that consists of 61 attributes and 1985 patients suffering from COPD. This learning base is available on the github website [99] from the CrowdANALYTIX source [100]. The latter is a web page that organizes regular contests around the prediction in scientific data. The main disadvantage of this learning base is that the label (name) of
Sensors 2017, 17, 1486
15 of 24
4.2. Experimentation and Results of the Selected Algorithms This prediction model (Figure 5) has been tested on contextual application helping patients and medical staff to predict the occurrence of exacerbation. Our contribution lies in the creation of an autonomous way of prediction. This gives the prediction model the ability to evolve over time by using new data base, without interventions of the experts (Pneumologists), based on Fayyad and Irani’s MDL (Minimum Description Length) discretization method that can achieve the best result compared to other algorithms [93,94]. In the context of autonomy, and to keep a good precision of prediction (AUC), we compared two algorithms that realize the dependency between relevant attributes TAN and K2, and four algorithms to select the relevant attributes (CFS, Gain Ration, Wrappers-Genetic, and Wrappers-Best First). These three methods combined are applied to the Bayesian network to obtain an ideal inference or what we call prediction. During this experiment, we used a learning base that consists of 61 attributes and 1985 patients suffering from COPD. This learning base is available on the github website [99] from the CrowdANALYTIX source [100]. The latter is a web page that organizes regular contests around the prediction in scientific data. The main disadvantage of this learning base is that the label (name) of each attribute is hidden. This learning database contains the following attributes: Exacer (is the attribute class, 1 = exacerbation and 0 = no-exacerbation), Demographics (including age, gender, height, weight, etc.), Lung Function (including 20 continuous attributes that have been derived from spirometry), etc. The evaluation metric used is the area under the receiver operating characteristic (ROC) curve [32], which is summarized by Area under ROC (AUC). AUC is the metric widely adopted in machine learning communities (e.g., [7,13,20,101]). To apply an evaluation metric to a classifier, the learning base must be divided into two parts, Train-Set and Test-Set. In this study, we use 10-Fold CrossValidation stratified [102]. Weka [92] by default uses stratified cross validation. Weka is the software system used during our experimentation as a visualization tool to allow datasets and the predictions of classifiers to be visualized in graphical interface. According to Table 2, we observe that the Wrappers method with best First algorithm, and 10 cross validation, using Fayyad and Irani’s MDL for discretization, provides the best result compared to the other selection algorithms (CFS, Gain Ration and Wrappers-Genetic), AUC = 80%. We start with 60 attributes and AUC = 76.8%, without using selection and discretization method. Then, we identify 11 relevant attributes with AUC = 80%, using the Wrappers-best first method to select the relevant attributes, Fayyad and Irani’s MDL for discretization, and Bayesian network for treatment. This result is important in the field of COPD, which improve the solution from 76.8% to 80%. Table 2. The effect of the Fayyad and Irani’s MDL method on the selection of relevant attributes, and the Bayesian network (K2–1 parent). Mixed Variables (Continuous and Discrete) Discretization → Selection of Attributes
1985 Patients Using weka 10—Cross Validation Stratified, Bayesian Network
Filters Fayyad and Irani’s MDL Wrappers
Algo
AUC
Number of attributes
-
0.768
60
CFS
0.795
14
GainRatio
0.76
14
BestFirst
0.80
11
Genetic
0.80
28
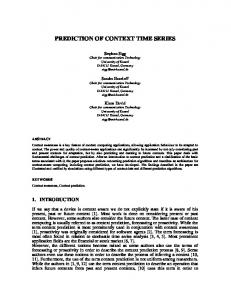
Table 3 shows that, using the Bayesian network, applying the discretization method (Fayyad and Irani’s MDL) and then selecting the relevant attributes (Wrapper-BestFirst) on the learning base, the TAN method can create an autonomous and powerful prediction system to detect exacerbation with AUC = 81.5% (Figure 7).
Mixed Variables (Continuous and Discrete) Discretization Selection of Attributes
1985 Patients Using weka 10—Cross Validation Stratified, Bayesian Network
Sensors 2017, 17, 1486
-
Algo
AUC
Number of attributes
-
0.768
60
CFS
0.795
14
16 of 24
Filters
Table 3. Learn the belief network from the learning by using Weka explorer. GainRatio base,0.76 14 Fayyad and Irani’s MDL BestFirst
0.80
11
Genetic
0.80
28
A- The Variables Are Discrete, with Fayyad and Irani’s MDL. Wrappers B- Selection Using Wrapper with Best First Search Algorithm. 10-Cross Validation
Area Under Roc Curve-AUC
Number of relevant attributes
Table 3 shows that, using the Bayesian network, applying the discretization method (Fayyad BN (K2)—1 parent 80% 11 and Irani’s then selecting the relevant on the learning base, BN MDL) (K2)—2and parents 80.9%attributes (Wrapper-BestFirst) 15 the TANBN method create an autonomous80.20% and powerful prediction system to14detect exacerbation (K2)—3can parents (TAN) 81.50% 17 with AUC = BN 81.5% (Figure 7). Sensors 2017, 17, 1486
16 of 24
Table 3. Learn the belief network from the learning base, by using Weka explorer.
A- The Variables Are Discrete, with Fayyad and Irani’s MDL. B- Selection Using Wrapper with Best First Search Algorithm. 10-Cross Validation BN (K2)—1 parent BN (K2)—2 parents BN (K2)—3 parents BN (TAN)
Area Under Roc Curve-AUC 80% 80.9% 80.20% 81.50%
Number of relevant attributes 11 15 14 17
Figure Evaluating our using Operating Characteristic (ROC) Thus, 7. from 61 attributes at the model beginning, with AUC = 76.8% (without discretization, Figure 7. Evaluating our prediction prediction model using Receiver Receiver Operating Characteristic (ROC) curve curve to to and predict the exacerbation of COPD. Area under ROC (AUC) = 81.5%. selection but only using and K2-1 parent, this is the default predictattributes, the exacerbation of COPD. AreaBayesian under ROCnetwork (AUC) = 81.5%.
configuration of Weka), we arrive at 17 relevant attributes with AUC = 81.5%, using the four essential stepsThus, (Figure 8),61 proposed inat our Engine context (Figure 5). from attributes theHelper beginning, with AUC =aware 76.8%Model (without discretization, and selection The greatest benefits of the discretization method before the selection of relevant attributes can attributes, but only using Bayesian network and K2-1 parent, this is the default configuration of Weka), be summed up in two features: increasing AUC metric and decreasing the number of relevant we arrive at 17 relevant attributes with AUC = 81.5%, using the four essential steps (Figure 8), proposed attributes [31].Engine This is context what we haveModel done in(Figure this experiment (Table 2). in our Helper aware 5). 1. 2. 3. 4.
Supervised discretization, with Fayyad and Irani’s MDL. Select the most relevant attributes (Wrappers-Best First). TAN to create the dependency structure of the learning base. All this is applied to the learning method, Bayesian network
Figure 8. The The four four essential essential steps steps in in proposed proposed model model to to provide provide an autonomous autonomous and efficient prediction method.
4.3. Implementation of the Context Aware Application The greatest benefits of the discretization method before the selection of relevant attributes can be two features: metric and decreasing the number of relevant Tosummed validate up thein feasibility of theincreasing proposed AUC model, a context-aware application is designed and attributes [31]. This is what we have done in this experiment (Table 2). provided. It offers monitoring and self-check services for patients (Figure 10), we implement it to help COPD patients to detect exacerbation at home, as well as it assist doctor or nurse in taking 4.3. Implementation of the Context Aware Application decisions efficiently. To validate the feasibility of the proposed model, a context-aware application In this application, we used Netica-J library, which offers the complete APIisofdesigned Netica, and TM 10), provided. It offers monitoring andfull self-check services for patientsNetica (Figure we implement it to NetBeans which provided us the development environment. is considered the most help COPD patients to detect exacerbation at home, as well as it assist doctor or nurse in taking widely used software in the world to develop the Bayesian network [103]. We also use Weka Explorer decisions to get the efficiently. result of discretization (Fayyad and Irani’s MDL), to select attributes (Wrappers-BestFirst), Increate this application, we used Netica-J library, which and to the dependency between the attributes (TAN).offers the complete API of Netica, and TM is considered the most NetBeans which provided us the full development environment. During this implementation, three main classes are developed Netica and described as follows: widely used software inclass: the world develop Bayesian network [103]. We also use network Weka Explorer CreationNetwork In thistoclass, we the realize the discretization and the belief of the relevant attributes, based on the result obtained from Weka. ApprendCPT class: This class is to learn the network through the learning database using the reviseCPTsByCaseFile method available in Netica-J. Inference class: The third class is the inference class by using the getBelief method available in Netica-J. However, to differentiate patients most likely to have an exacerbation from those who do
Sensors 2017, 17, 1486
17 of 24
to get the result of discretization (Fayyad and Irani’s MDL), to select attributes (Wrappers-BestFirst), and to create the dependency between the attributes (TAN). During this implementation, three main classes are developed and described as follows: CreationNetwork class: In this class, we realize the discretization and the belief network of the relevant attributes, based on the result obtained from Weka. ApprendCPT class: This class is to learn the network through the learning database using the reviseCPTsByCaseFile method available in Netica-J. Inference class: The third class is the inference class by using the getBelief method available in Netica-J. However, to differentiate patients most likely to have an exacerbation from those who do not, we need to specify a better cutoff or threshold for the Bayesian network model. The best cutoff isSensors a point on the ROC curve (Figure 7), which has the minimum distance to the coordinate = (0, 1). 2017, 17, 1486 17 of 24 We can find this point by calculating (1 − sensitivity)2 + (specificity)2 on different points on the curve toformula choose to that has thethe minimum According to Wekaorder and the ROC curveof (Figure 7), we have organize relevantvalue. attributes in descending (Arrangement context-Step F). By specified thisthe point equal to 0.1. As a result, when the probability of exacerbation >0.1, this application this order, accuracy prediction of Bayesian network is increasing by observing a new attribute notifies patient that he is likelyinstead to haveof anrandom exacerbation, and if not, healthguaranty of patienta is good. based the on the GainRatio value, observation thatthe cannot minimum Moreover, we find number of relevant attributes attributes) is too great to becontextual detected precision. Hence, wethat canthe benefit from this idea in the(17 graphical interface of our orapplication, observed by For that, as adiscrimination new idea, wecapacity have proposed to of usethe GainRatio bypatient setting or thephysician. attribute with highest at the top graphical formula to organize the relevant attributes in descending order (Arrangement of context-Step F). this interface; then, we start arranging the remaining attributes according to their GainRatio By values. order, the accuracy prediction of Bayesian network is the increasing by with observing a new attribute based Therefore, the patient or physician starts to observe attributes high discriminate capability. on the GainRatio value, instead of random observation that cannot guaranty a minimum precision. Whenever they observe an attribute, the prediction accuracy improves. The effectiveness of this Hence, weiscan benefit fromin this idea4inwhere the graphical interface our contextual application, setting method demonstrated Table we begin the testofwith the eight most relevantby attributes the attribute with at the top of the interface; then, we start that appeared in highest Figure 9.discrimination We begin withcapacity eight main attributes to graphical ensure a good prediction accuracy arranging the remaining attributes according to their GainRatio values. Therefore, the patient or with AUC = 78% (Table 4). physician to observe attributes with discriminate capability. observe Thisstarts arrangement is athe beneficial way to high guaranty a minimal accuracyWhenever when the they patient or the an attribute,does the prediction accuracy improves. The effectiveness of thisall method is demonstrated physician not have the time (e.g., emergency case) to observe the relevant attributes in (17 Table 4 where we begin the test with the eight most relevant attributes that appeared in Figure attributes). However, this feature is not available in any existing solution. Habitually, the patient 9. or We with eight mainthe attributes ensure arandomly good prediction accuracy with AUC = 78% (Table 4). thebegin physician observes relevantto attribute [13,14,20,22–24,26–28,30].
Figure9.9.The Thearrangement arrangementofofthe therelevant relevantattributes, attributes,based basedon onthe theGainRatio GainRatiovalues. values. Figure Table4.4.The Thevariation variationofofthe theprediction predictionaccuracy accuracyAUC, AUC,asasa afunction functionofofthe thenumber numberofofattribute attributeused. used. Table 8 8 78%
AUC AUC 78%
9 9 78.4%
10 10 79.6%
Number of Attributes Number of Attributes 11 12 13 14 11 12 13 14 79.9% 80.4% 80.5% 81%
78.4%
79.6%
79.9%
80.4%
80.5%
81%
15 15 80.9% 80.9%
16 17 16 17 81.1% 81.5% 81.1% 81.5%
Figure 10 represents the graphical interface of our context aware application. This application changes color of the to yellow we choose a level and on click on the This the arrangement is button a beneficial way when to guaranty a minimal accuracy when the button. patient The or buttons in front ofnot each label (label) theemergency states of each Thus, the relevant labels represent the the physician does have the time are (e.g., case)attribute. to observe all the attributes attribute names in the learning database of COPD disease. We emphasize that the names of attributes used in our experimentation are invisible and anonymous. This application is a prototype application to validate the integration of the different parts of this research project. The first interface of this application contains eight main attributes, which are considered to guarantee a precision at least equal to 78%. Afterwards, if the patient wants to measure more symptoms, he may click “Add more symptoms”, and then with each new observation in order,
Sensors 2017, 17, 1486
18 of 24
(17 attributes). However, this feature is not available in any existing solution. Habitually, the patient or the physician observes the relevant attribute randomly [13,14,20,22–24,26–28,30]. Figure 10 represents the graphical interface of our context aware application. This application changes the color of the button to yellow when we choose a level and on click on the button. The buttons in front of each label (label) are the states of each attribute. Thus, the labels represent the attribute names in the learning database of COPD disease. We emphasize that the names of attributes used in our experimentation are invisible and anonymous. Sensors 2017, 17, 1486
18 of 24
Figure 10. The interface of our application, with the secondary symptoms on the right side.
Figure 10. The interface of our application, with the secondary symptoms on the right side.
Sensors 2017, 17, 1486
19 of 24
This application is a prototype application to validate the integration of the different parts of this research project. The first interface of this application contains eight main attributes, which are considered to guarantee a precision at least equal to 78%. Afterwards, if the patient wants to measure more symptoms, he may click “Add more symptoms”, and then with each new observation in order, the accuracy of the exacerbation detection improves the result to 81.5%. 5. Conclusions and Future Works Context-aware application is still considered as new concept which could facilitate daily life tasks. In this article, we focused on the medical domain to help COPD patients to take decision about their health through using a low-cost, rapid and efficient approach. We have explored many problems in the existing systems that manipulate COPD diseases. These systems: (i) focus on the general aspect of COPD; (ii) have moderate prediction accuracy; (iii) are not autonomous; (iv) select the relevant attributes of COPD with moderate rate in machine learning domain (Markov Blanket, filters methods, etc.); and (v) ignore the arrangement of relevant attributes. To solve these issues, we followed many steps and algorithms (Figure 3): (i) concentrate on pulmonary crises or exacerbations; (ii) our prediction model has an AUC = 81.5%, which is a very good result according to the existing results; (iii) our system is autonomous using Fayyad and Irani’s MDL algorithm to discretization and TAN to create the relations between the attributes, rather than relying on a doctor; and (iv) for the selection of relevant attributes, we have used Wrapper-BestFist, which has a great efficiency in the machine learning algorithms. Finally, we demonstrated the importance of arranging the attributes for observation instead of randomly observing them. Two more tasks have been realized in this research work: (i) choose one algorithm for each step in the prediction model by comparing many algorithms in each step; and (ii) identify which step should be done before the others. For example, should we execute selection step before discretization one? An investigation and comparison of different scenarios of steps are also done to improve the accuracy of the results. As a conclusion, we believe researchers could follow the steps given in Figure 3 to get more precise results. In our comparison, for example, discretization step followed by selection one gives more accurate results. This model could be used by medical personal (physicians and nurses): (i) to decrease the number of attributes to be measured; (ii) prioritize the most important attributes; and (iii) check the level of exacerbations. Moreover, this model can be applied to different kinds of chronic diseases to minimize the list of required attributes and predict the current state of the patient. In future work, we would like to increase the accuracy of prediction by using neural network or deep learning methods. In contrast, these results can be generalized using different sources of databases of COPD disease. The selected algorithms and prediction model will be tested in other diseases such as Parkinson’s disease and diabetes. Author Contributions: Hamid Mcheick, Lokman Saleh, Hicham Ajami and Hefedh Mili are the main contributors of this research work. Hamid Mcheick and Lokman Saleh conceived and designed Helper engine context model. Hamid Mcheick analyzed the state of the arts. Lokman conceived the ontology and analyzed the state of the arts. Also, Lokman Saleh performed the experiments and validation. Hicham Ajami studied and compared context representation models. Hafedh Mili contributed in analysis data and implementation. Conflicts of Interest: The authors declare no conflict of interest. For newly added information, there is also no conflict of interest.
References 1. 2. 3.
Dey, A.K. Understanding and using context. Pers. Ubiquitous Comput. 2001, 5, 4–7. [CrossRef] Funtowicz, S.O.; Ravetz, J.R. Uncertainty and Quality in Science for Policy; Springer Science & Business Media: Dordrecht, The Netherlands, 1990; Volume 15. Québec, A.P.D. MPOC, Bronchite et Emphysème. Available online: http://www.pq.poumon.ca/diseasesmaladies/copd-mpoc/ (accessed on 16 July 2016).
Sensors 2017, 17, 1486
4.
5.
6. 7. 8.
9. 10. 11. 12. 13.
14.
15. 16.
17.
18. 19.
20. 21.
22.
23.
20 of 24
Thoracologie, S.C.D. Le Fardeau Humain et Financier de la MPOC—Une des Principales Causes d’hospitalisation au Canada. Available online: http://www.lignesdirectricesrespiratoires.ca/sites/all/ files/MPOC_report.pdf (accessed on 15 August 2016). Connors, A.F., Jr.; Dawson, N.V.; Thomas, C.; Harrell, F.E., Jr.; Desbiens, N.; Fulkerson, W.J.; Kussin, P.; Bellamy, P.; Goldman, L.; Knaus, W.A. Outcomes following acute exacerbation of severe chronic obstructive lung disease. The SUPPORT investigators (Study to Understand Prognoses and Preferences for Outcomes and Risks of Treatments). Am. J. Respir. Crit. Care Med. 1996, 154, 959–967. [CrossRef] [PubMed] Lareau, S.; Moseson, E.; Slatore, C.G. Patient information series. Am. J. Respir. Crit. Care Med. 2014, 189. [CrossRef] Van der Heijden, M.; Velikova, M.; Lucas, P.J. Learning Bayesian networks for clinical time series analysis. J. Biomed. Inform. 2014, 48, 94–105. [CrossRef] [PubMed] Simões, P.W.; Silva, G.D.d.; Moretti, G.P.; Simon, C.S.; Winnikow, E.P.; Nassar, S.M.; Medeiros, L.R.; Rosa, M.I. Metanálise do uso de redes bayesianas no diagnóstico de câncer de mama. Cadernos de Saúde Pública 2015, 31, 26–38. [CrossRef] [PubMed] Reynolds, G.M.; Peet, A.C.; Arvanitis, T.N. Generating prior probabilities for classifiers of brain tumours using belief networks. BMC Med. Inform. Decis. Mak. 2007, 7, 27. [CrossRef] [PubMed] Verduijn, M.; Rosseel, P.M.; Peek, N.; de Jonge, E.; de Mol, B.A. Prognostic bayesian networks: II: An application in the domain of cardiac surgery. J. Biomed. Inform. 2007, 40, 619–630. [CrossRef] [PubMed] Sanders, D.L.; Aronsky, D. Detecting asthma exacerbations in a pediatric emergency department using a Bayesian network. AMIA Annu. Symp. Proc. Arch. 2006, 2006, 684–688. Naïm, P.; Wuillemin, P.-H.; Leray, P.; Pourret, O.; Becker, A. Réseaux Bayésiens, 3rd ed.; Eyrolles: Paris, France, 2007. Himes, B.E.; Dai, Y.; Kohane, I.S.; Weiss, S.T.; Ramoni, M.F. Prediction of chronic obstructive pulmonary disease (COPD) in asthma patients using electronic medical records. J. Am. Med. Inform. Assoc. 2009, 16, 371–379. [CrossRef] [PubMed] Amalakuhan, B.; Kiljanek, L.; Parvathaneni, A.; Hester, M.; Cheriyath, P.; Fischman, D. A prediction model for COPD readmissions: Catching up, catching our breath, and improving a national problem. J. Commun. Hosp. Intern. Med. Perspect. 2012, 2. [CrossRef] [PubMed] Burt, L.; Corbridge, S. COPD exacerbations. AJN Am. J. Nurs. 2013, 113, 34–43. [CrossRef] [PubMed] Seemungal, T.A.; Donaldson, G.C.; Bhowmik, A.; Jeffries, D.J.; Wedzicha, J.A. Time course and recovery of exacerbations in patients with chronic obstructive pulmonary disease. Am. J. Respir. Crit. Care Med. 2000, 161, 1608–1613. [CrossRef] [PubMed] Seemungal, T.A.; Donaldson, G.C.; Paul, E.A.; Bestall, J.C.; Jeffries, D.J.; Wedzicha, J.A. Effect of exacerbation on quality of life in patients with chronic obstructive pulmonary disease. Am. J. Respir. Crit. Care Med. 1998, 157, 1418–1422. [CrossRef] [PubMed] Canada, S. Le Fardeau Humain et Financier de la MPOC; Société Canadienne de Thoracologie: Ottawa, ON, Canada, 2010. Wilkinson, T.M.; Donaldson, G.C.; Hurst, J.R.; Seemungal, T.A.; Wedzicha, J.A. Early therapy improves outcomes of exacerbations of chronic obstructive pulmonary disease. Am. J. Respir. Crit. Care Med. 2004, 169, 1298–1303. [CrossRef] [PubMed] Van der Heijden, M.; Lucas, P.J.; Lijnse, B.; Heijdra, Y.F.; Schermer, T.R. An autonomous mobile system for the management of COPD. J. Biomed. Inform. 2013, 46, 458–469. [CrossRef] [PubMed] Jensen, M.H.; Cichosz, S.L.; Hejlesen, O.K.; Toft, E.; Nielsen, C.; Grann, O.; Dinesen, B.I. Clinical impact of home telemonitoring on patients with chronic obstructive pulmonary disease. Telemed. e-Health 2012, 18, 674–678. [CrossRef] [PubMed] Trappenburg, J.C.; Niesink, A.; de Weert-van Oene, G.H.; van der Zeijden, H.; van Snippenburg, R.; Peters, A.; Lammers, J.-W.J.; Schrijvers, A.J. Effects of telemonitoring in patients with chronic obstructive pulmonary disease. Telemed. e-Health 2008, 14, 138–146. [CrossRef] [PubMed] Maiolo, C.; Mohamed, E.I.; Fiorani, C.M.; De Lorenzo, A. Home telemonitoring for patients with severe respiratory illness: The Italian experience. J. Telemed. Telecare 2003, 9, 67–71. [CrossRef] [PubMed]
Sensors 2017, 17, 1486
24.
25.
26.
27.
28.
29. 30.
31.
32. 33. 34. 35. 36.
37. 38. 39.
40. 41.
42. 43.
21 of 24
Vontetsianos, T.; Giovas, P.; Katsaras, T.; Rigopoulou, A.; Mpirmpa, G.; Giaboudakis, P.; Koyrelea, S.; Kontopyrgias, G.; Tsoulkas, B. Telemedicine-assisted home support for patients with advanced chronic obstructive pulmonary disease: Preliminary results after nine-month follow-up. J. Telemed. Telecare 2005, 11, 86–88. [CrossRef] [PubMed] McLean, S.; Nurmatov, U.; Liu, J. L.; Pagliari, C.; Car, J.; Sheikh, A. Telehealthcare for chronic obstructive pulmonary disease: Cochrane Review and meta-analysis. Br. J. Gen. Pract. 2012, 62, e739–e749. [CrossRef] [PubMed] Halpin, D.M.; Laing-Morton, T.; Spedding, S.; Levy, M.L.; Coyle, P.; Lewis, J.; Newbold, P.; Marno, P. A randomised controlled trial of the effect of automated interactive calling combined with a health risk forecast on frequency and severity of exacerbations of COPD assessed clinically and using EXACT PRO. Prim. Care Respir. J. 2011, 20, 324–331. [CrossRef] [PubMed] Yañez, A.M.; Guerrero, D.; de Alejo, R.P.; Garcia-Rio, F.; Alvarez-Sala, J.L.; Calle-Rubio, M.; de Molina, R.M.; Falcones, M.V.; Ussetti, P.; Sauleda, J. Monitoring breathing rate at home allows early identification of COPD exacerbations. CHEST J. 2012, 142, 1524–1529. [CrossRef] [PubMed] Ryynänen, O.-P.; Soini, E.J.; Lindqvist, A.; Kilpeläinen, M.; Laitinen, T. Bayesian predictors of very poor health related quality of life and mortality in patients with COPD. BMC Med. Inform. Decis. Mak. 2013, 13, 34. [CrossRef] [PubMed] Cooper, G.F.; Herskovits, E. A Bayesian method for the induction of probabilistic networks from data. Mach. Learn. 1992, 9, 309–347. [CrossRef] Raghavan, N.; Lam, Y.M.; Webb, K.A.; Guenette, J.A.; Amornputtisathaporn, N.; Raghavan, R.; Tan, W.C.; Bourbeau, J.; O’Donnell, D.E. Components of the COPD Assessment Test (CAT) associated with a diagnosis of COPD in a random population sample. COPD J. Chron. Obstr. Pulm. Dis. 2012, 9, 175–183. [CrossRef] [PubMed] Mcheick, H.; Saleh, L.; Ajami, H.; Mili, H. HCES: Helper Context-Aware Engine System to Predict Relevant State of patients in COPD Domain using Naïve Bayesian. In Proceedings of International Conference on Internet of Things and Machine Learning (IML 2017); ACM Digital Library: Liverpool City, UK, 2017. Hanley, J.A.; McNeil, B.J. The meaning and use of the area under a receiver operating characteristic (ROC) curve. Radiology 1982, 143, 29–36. [CrossRef] [PubMed] Weiser, M. Hot topics-ubiquitous computing. Computer 1993, 26, 71–72. [CrossRef] Blazer, D.G.; Hernandez, L.M. Genes, Behavior, and the Social Environment: Moving Beyond the Nature/Nurture Debate; National Academies Press: Washington, MD, USA, 2006. Sannino, G.; De Pietro, G. A mobile system for real-time context-aware monitoring of patients’ health and fainting. Int. J. Data Min. Bioinform. 2014, 10, 407–423. [CrossRef] [PubMed] Wu, W.H.; Batalin, M.A.; Au, L.K.; Bui, A.A.; Kaiser, W.J. Context-aware sensing of physiological signals. In Proceedings of the 29th Annual International Conference of the IEEE Engineering in Medicine and Biology Society (EMBS 2007), Lyon, France, 22–26 August 2007; pp. 5271–5275. Bricon-Souf, N.; Newman, C.R. Context awareness in health care: A review. Int. J. Med. Inform. 2007, 76, 2–12. [CrossRef] [PubMed] Bhattacharyya, S.; Saravanagru, R.; Thangavelu, A. Context aware healthcare application. IJCA Int. J. Comput. Appl. 2011, 22. [CrossRef] Garcia-Valverde, T.; Muñoz, A.; Arcas, F.; Bueno-Crespo, A.; Caballero, A. Heart health risk assessment system: A nonintrusive proposal using ontologies and expert rules. BioMed Res. Int. 2014, 2014. [CrossRef] [PubMed] Kennedy, A.; Rogers, A.; Bower, P. Support for self-care for patients with chronic disease. BMJ Br. Med. J. 2007, 335, 968–970. [CrossRef] [PubMed] Bayliss, E.A.; Bonds, D.E.; Boyd, C.M.; Davis, M.M.; Finke, B.; Fox, M.H.; Glasgow, R.E.; Goodman, R.A.; Heurtin-Roberts, S.; Lachenmayr, S. Understanding the context of health for persons with multiple chronic conditions: Moving from what is the matter to what matters. Ann. Fam. Med. 2014, 12, 260–269. [CrossRef] [PubMed] Kim, S.-H.; Chung, K. Emergency situation monitoring service using context motion tracking of chronic disease patients. Clust. Comput. 2015, 18, 747–759. [CrossRef] Tris, C.R. Ontology-Based Diagnosis and Personalization of Medical Knowledge; Universitat Rovira i Virgili: Tarragona, Spain, 2009.
Sensors 2017, 17, 1486
44. 45.
46. 47. 48.
49. 50. 51. 52. 53. 54. 55. 56.
57. 58. 59. 60. 61.
62. 63. 64.
65. 66. 67.
22 of 24
Kida, K.; Jinno, S.; Nomura, K.; Yamada, K.; Katsura, H.; Kudoh, S. Pulmonary rehabilitation program survey in North America, Europe, and Tokyo. J. Cardiopulm. Rehabil. Prev. 1998, 18, 301–308. [CrossRef] Kim, H.F.S.; Kunik, M.E.; Molinari, V.A.; Hillman, S.L.; Lalani, S.; Orengo, C.A.; Petersen, N.J.; Nahas, Z.; Goodnight-White, S. Functional impairment in COPD patients: The impact of anxiety and depression. Psychosomatics 2000, 41, 465–471. [CrossRef] [PubMed] Murray, C.J.; Lopez, A.D. Global Burden of Disease; Harvard University Press: Boston, UK, 1996; Volume 1. Murray, C.J.; Lopez, A.D. Alternative projections of mortality and disability by cause 1990–2020: Global Burden of Disease Study. Lancet 1997, 349, 1498–1504. [CrossRef] Roche, N.; Deslée, G.; Caillaud, D.; Brinchault, G.; Nesme-Meyer, P.; Surpas, P.; Escamilla, R.; Perez, T.; Chanez, P.; Pinet, C. Impact of gender on COPD expression in a real-life cohort. Respir. Res. 2014, 15, 20. [CrossRef] [PubMed] Crapo, J.D.; Broaddus, V.C.; Brody, A.R.; Malindzak, G. Workshop on lung disease and the environment. Am. J. Respir. Crit. Care Med. 2003, 168, 250–254. [PubMed] Kaptein, A.A.; Dekker, F.W. Psychosocial support. Eur. Respir. Monogr. 2000, 13, 58–69. Brézillon, P. Task-realization models in contextual graphs. In Proceedings of the International and Interdisciplinary Conference on Modeling and Using Context, Paris, France, 5–8 July 2005; pp. 55–68. Dey, A.K. Providing Architectural Support for Building Context-Aware Applications; Georgia Institute of Technology: Atlanta, GA, USA, 2000. Li, X.; Eckert, M.; Martinez, J.-F.; Rubio, G. Context Aware Middleware Architectures: Survey and Challenges. Sensors 2015, 15, 20570–20607. [CrossRef] [PubMed] Bettini, C.; Brdiczka, O.; Henricksen, K.; Indulska, J.; Nicklas, D.; Ranganathan, A.; Riboni, D. A survey of context modelling and reasoning techniques. Pervasive Mob. Comput. 2010, 6, 161–180. [CrossRef] Oh, Y.; Woo, W. User-centric integration of contexts for a unified context-aware application model. In Proceedings of the Joint sOc-EUSAI Conference, Grenoble, France, 12–14 October 2005. Wood, A.D.; Stankovic, J.A.; Virone, G.; Selavo, L.; He, Z.; Cao, Q.; Doan, T.; Wu, Y.; Fang, L.; Stoleru, R. Context-aware wireless sensor networks for assisted living and residential monitoring. IEEE Netw. 2008, 22. [CrossRef] Sielis, G.; Mettouris, C. idSpace D3. 3–Definition and Implementation of Context Awareness v2; Open University of the Netherlands: Heerlen, The Netherlands, 2009. Mühlhäuser, M. Handbook of Research on Ubiquitous Computing Technology for Real Time Enterprises; IGI Global: Hershey, PA, USA, 2008. Tsihrintzis, G.A.; Jain, L.C. Advances in Multimedia Services in Intelligent Environments—Integrated Systems. In Multimedia Services in Intelligent Environments; Springer: Berlin, Heidelberg, 2010; pp. 1–3. Strang, T.; Linnhoff-Popien, C. A context modeling survey. In Workshop Proceedings. First International Workshop on Advanced Context Modelling; Reasoning and Management at UbiComp: Nottingham, UK, 2004. Reichle, R.; Wagner, M.; Khan, M.U.; Geihs, K.; Lorenzo, J.; Valla, M.; Fra, C.; Paspallis, N.; Papadopoulos, G.A. A comprehensive context modeling framework for pervasive computing systems. In Proceedings of the IFIP International Conference on Distributed Applications and Interoperable Systems, Oslo, Norway, 4–6 June 2008; pp. 281–295. Hoareau, C. A Model Checking Based Framework for Building Correct Context-Aware Systems; The Graduate University for Advanced Studie: Hayama, Japan, 2009. Bradley, N.A.; Dunlop, M.D. Toward a multidisciplinary model of context to support context-aware computing. Hum. Comput. Interact. 2005, 20, 403–446. [CrossRef] ElGammal, M.; Eltoweissy, M. Chemistry-inspired, Context-Aware, and Autonomic Management System for Networked Objects. In Proceedings of the Seventh International Conference on Future Computational Technologies and Applications, Nice, France, 22–27 March 2015. Paganelli, F.; Giuli, D. Context-aware information services to support tourist communities. Inform. Technol. Tour. 2008, 10, 313–327. [CrossRef] Khattak, A.M.; Akbar, N.; Aazam, M.; Ali, T.; Khan, A.M.; Jeon, S.; Hwang, M.; Lee, S. Context representation and fusion: Advancements and opportunities. Sensors 2014, 14, 9628–9668. [CrossRef] [PubMed] Strang, T.; Linnhoff-Popien, C. A context modeling survey. In Workshop Proceedings. First International Workshop on Advanced Context Modelling; Reasoning and Management at UbiComp: Nottingham, UK, 2004.
Sensors 2017, 17, 1486
68. 69. 70. 71. 72.
73. 74. 75. 76. 77. 78. 79. 80. 81. 82.
83. 84. 85. 86.
87. 88. 89. 90.
91.
23 of 24
Paganelli, F.; Giuli, D. An ontology-based system for context-aware and configurable services to support home-based continuous care. IEEE Trans. Inform. Technol. Biomed. 2011, 15, 324–333. [CrossRef] [PubMed] Gu, T.; Pung, H.K.; Zhang, D.Q. A service-oriented middleware for building context-aware services. J. Netw. Comput. Appl. 2005, 28, 1–18. [CrossRef] Brickley, D.; Guha, R.V. RDF Vocabulary Description Language 1.0: RDF Schema. Available online: https://www.w3.org/2001/sw/RDFCore/Schema/200203/ (accessed on 15 September 2016). Rodriguez-Roisin, R. Toward a consensus definition for COPD exacerbations. Chest 2000, 117, 398S–401S. [CrossRef] [PubMed] Hurst, J.R.; Donaldson, G.C.; Perera, W.R.; Wilkinson, T.M.; Bilello, J.A.; Hagan, G.W.; Vessey, R.S.; Wedzicha, J.A. Use of plasma biomarkers at exacerbation of chronic obstructive pulmonary disease. Am. J. Respir. Crit. Care Med. 2006, 174, 867–874. [CrossRef] [PubMed] Society, A.T. Standard for the diagnosis and care of patients with chronic obstructive pulmonary disease. Am. J. Respir. Crit. Care Med. 1995, 152, S77–S120. Gu, T.; Pung, H.K.; Zhang, D.Q.; Pung, H.K.; Zhang, D.Q. A Bayesian Approach for Dealing with Uncertain Contexts; Austrian Computer Society: Clementi, Singapore, 2004. Olivier, F. De L’identification de Structure de Réseaux Bayésiensa la Reconnaissance de Formesa Partir D’informations Completes ou Incompletes; INSA de Rouen: Rouvray, France, 2006. Lerner, B.; Malka, R. Investigation of the K2 algorithm in learning Bayesian network classifiers. Appl. Artif. Intell. 2011, 25, 74–96. [CrossRef] Robinson, R.W. Counting unlabeled acyclic digraphs. In Combinatorial Mathematics V; Springer: Berlin, Germany, 1977; pp. 28–43. Witten, I.H.; Frank, E. Data Mining: Practical Machine Learning Tools and Techniques, 3rd ed.; Morgan Kaufmann: Financial District, SF, USA, 2011. Friedman, N.; Geiger, D.; Goldszmidt, M. Bayesian network classifiers. Mach. Learn. 1997, 29, 131–163. [CrossRef] Chow, C.; Liu, C. Approximating discrete probability distributions with dependence trees. IEEE Trans. Inform. Theory 1968, 14, 462–467. [CrossRef] Gama, J.; Porto, L.-I. Bayesian Learning: An Introduction; University of Porto: Porto, Portugal, 2008. Hall, M.A. Correlation-based feature selection of discrete and numeric class machine learning. In Proceedings of the Seventeenth International Conference on Machine Learning (ICML 2000), Stanford University, Stanford, CA, USA, 29 June–2 July 2000. Goswami, S.; Chakrabarti, A. Feature selection: A practitioner view. Int. J. Inform. Technol. Comput. Sci. (IJITCS) 2014, 6, 66. [CrossRef] Cornuéjols, A. Sélection d’attributs. Available online: https://www.lri.fr/~antoine/Courses/DEA-I3/Trselection-attributs.pdf (accessed on 1 May 2016). Karegowda, A.G.; Jayaram, M.; Manjunath, A. Feature subset selection problem using wrapper approach in supervised learning. Int. J. Comput. Appl. 2010, 1, 13–17. [CrossRef] Dougherty, J.; Kohavi, R.; Sahami, M. Supervised and unsupervised discretization of continuous features. In Proceedings of the Twelfth International Conference on Machine Learning, Tahoe City, CA, USA, 9–12 July 1995; Volume 12, pp. 194–202. Hall, M.A. Correlation-Based Feature Selection for Machine Learning; The University of Waikato: Hamilton, New Zealand, 1999. Pawlik, M. Available online: http://www.inf.unibz.it/dis/teaching/DWDM/slides2011/lesson5Classification-2.pdf (accessed on 1 April 2016). Priyadarsini, R.P.; Valarmathi, M.; Sivakumari, S. Gain ratio based feature selection method for privacy preservation. ICTACT J. Soft Comput. 2011, 1. [CrossRef] Wang, J.; Valtorta, M. Using Relative Classification Probability to Increase Accuracy of Restricted Structure Bayesian Network Classifiers. In Proceedings of the 2012 IEEE 24th International Conference on Tools with Artificial Intelligence, Athens, Greece, 7–9 November 2012; Volume 1, pp. 105–113. Rakotomalala, R. TANAGRA: Un logiciel gratuit pour l'enseignement et la recherche. In Proceedings of the Extraction et Gestion des Connaissances (EGC’2005), Actes des Cinquièmes Journées Extraction et Gestion des Connaissances, Paris, France, 18–21 January 2005; Volume 2, pp. 697–702.
Sensors 2017, 17, 1486
92. 93. 94. 95. 96.
97. 98. 99. 100. 101.
102. 103.
24 of 24
Waikato Environment for Knowledge Analysis, version 3.8.0; The University of Waikato: Hamilton, New Zealand, 2016. Lustgarten, J.L.; Gopalakrishnan, V.; Grover, H.; Visweswaran, S. Improving classification performance with discretization on biomedical datasets. AMIA Ann. Symp. Proc. 2008, 2008, 445. Kotsiantis, S.; Kanellopoulos, D. Discretization techniques: A recent survey. GESTS Int. Trans. Comput. Sci. Eng. 2006, 32, 47–58. Fayyad, U.; Irani, K. Multi-Interval Discretization of Continuous-Valued Attributes for Classification Learning; 1993. Available online: http://hdl.handle.net/2014/35171 (accessed on 22 June 2017). Mansoor, W.; Khedr, M.; Benslimane, D.; Maamar, Z.; Hauswirth, M.; Aberer, K.; Chaari, T.; Laforest, F.; Celentano, A. Adaptation in context-aware pervasive information systems: The SECAS project. Int. J. Pervasive Comput. Commun. 2008, 3, 400–425. Baldauf, M.; Dustdar, S.; Rosenberg, F. A survey on context-aware systems. Int. J. Ad Hoc Ubiquitous Comput. 2007, 2, 263–277. [CrossRef] Steffen, L.S.N.; Florian, H.; Thomas, E. Visualizing Ontologies with (VOWL). Available online: http://vowl. visualdataweb.org/webvowl (accessed on 15 June 2016). Rajasekaran, S. Database about COPD Exacerbation. Available online: https://github.com/sibrajas/datapython/blob/master/CAX_COPD_TRAIN_data.csv (accessed on 10 May 2015). Analytix, C. Available online: https://www.crowdanalytix.com/contests/predict-exacerbation-in-patientswith-copd (accessed on 1 May 2015). Van den Berge, M.; Hop, W.C.; van der Molen, T.; van Noord, J.A.; Creemers, J.P.; Schreurs, A.J.; Wouters, E.F.; Postma, D.S. Prediction and course of symptoms and lung function around an exacerbation in chronic obstructive pulmonary disease. Respir. Res. 2012, 13, 44. [CrossRef] [PubMed] Kohavi, R. A study of cross-validation and bootstrap for accuracy estimation and model selection. Ijcai 1995, 14, 1137–1145. Manual Netica.-Java Library, version 4.18; Norsys Software Corp.: Vancuver, BC, Canada, 2012. © 2017 by the authors. Licensee MDPI, Basel, Switzerland. This article is an open access article distributed under the terms and conditions of the Creative Commons Attribution (CC BY) license (http://creativecommons.org/licenses/by/4.0/).