Context Switch Overheads on Mobile Device Platforms [Context Switch Measurement Challenge] Francis M. David
Jeffrey C. Carlyle
Roy H. Campbell
University of Illinois at Urbana-Champaign 201 N Goodwin Ave Urbana, IL 61801-2302
University of Illinois at Urbana-Champaign 201 N Goodwin Ave Urbana, IL 61801-2302
University of Illinois at Urbana-Champaign 201 N Goodwin Ave Urbana, IL 61801-2302
[email protected]
[email protected]
ABSTRACT When threads use context switching, they incur an overhead in addition to the minimum required running time. The source of this overhead is both direct overhead due to running the context switch code and indirect overhead due to perturbation of caches. We calculate indirect overhead by measuring the running time of tasks that use context switching and subtracting the direct overhead. We also measure the indirect overhead impact on the running time of tasks due to processor interrupt servicing. Experiment results are presented for the Linux kernel running on a mobile device platform.
1. INTRODUCTION Context switching is the fundamental mechanism that is used to share a processor across multiple threads of execution. Each thread is associated with a processor state (program counter, data and status registers, etc.). A context switch is the act of saving the processor state of a thread and loading the saved state of another thread. If the threads are run in different virtual address spaces (which in Linux terminology means they belong to different processes) a context switch also involves switching the address translation maps used by the processor. Switching address spaces requires that relevant entries in the processor translation cache (TLB) are invalidated. If the instruction or data caches are tagged using virtual addresses, they would have to be emptied as well. Multitasking processes incur a small performance penalty because of context switching. In addition to the direct overhead associated with the actual context switching code, there are several other factors that contribute to this penalty. The perturbation of processor caches like the instruction, data, address translation and branch-target buffers results in an additional indirect overhead. Yet another possible source of indirect overhead is operating system memory paging. A context switch can result in an in-use memory page being
[email protected]
moved to disk if there is no free memory, thus hurting performance. In this paper, we do not consider overheads due to paging and assume that sufficient main memory is present to avoid thrashing. We have described a context switch as a mechanism used to switch between two threads of execution. We do not consider a system call a context switch. This is like a simple function call and memory maps are not switched. The transition back to userspace from the kernel during the return of the system call is similar to a function call return. On the other hand, a processor interrupt causes the state of the currently executing task to be saved while an interrupt service routine is executed. When the interrupt service routine completes, the saved state is restored. While memory maps are not switched during interrupt servicing, it does perturb cache state and might also contribute some indirect overhead. In this paper, we measure the indirect overhead of context switches inside the Linux kernel using two tasks that perform cooperative multitasking. In a separate set of experiments, we also measure the indirect overhead introduced due to processor interrupt servicing. We do not explore userspace implementations of threads and userspace context switching in this work. The latest versions of the Linux kernel support the Native Posix Threading Library (NPTL) which implements user threads as kernel threads and context switching happens inside the kernel. This study targets mobile device architectures and the hardware platform we use in our experiments is the OMAP1610 H2 Software Development Platform [1] cellular phone reference design from Texas Instruments. The OMAP1610 is powered by an ARM9 processor core. We discuss the relevant aspects of this architecture in section 2. The rest of this paper is organized as follows. Section 2 presents a quick introduction to the hardware platform that we use in our experiments. We discuss the experiment setup and results in section 3. After exploring some related work in section 4, we conclude in section 5.
2.
EXPERIMENT PLATFORM
ARM is a 32-bit RISC architecture. ARM processors are widely used in mobile devices because of their low power consumption. In this section, we briefly describe some features
Context Switches = 1
Context Switches = 3
Task 1 Begin
Task 1 Begin
Time
Task 2 Begin Task 1 End Rtotal CS Time
Task 2 Begin R’total
Task 1 End Task 2 End
Task 2 End
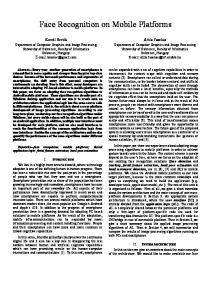
Figure 1: Context Switch Experiment Measurements
of the ARM architecture that are relevant to this research. Our implementations and experiments have been carried out on a processor core which belongs to the ARMv5 architecture generation. The ARM926EJ-S core that we use is part of the OMAP1610 chip from Texas Instruments. Context switches require the saving of 16 general purpose registers (including the program counter) and one status register. A memory management unit (MMU) translates virtual addresses from the processor into physical addresses. A split (Harvard) memory cache is available in the processor, providing a 16 kilobyte, four-way set-associative instruction cache and a 8 kilobyte, four-way set-associative data cache. There are two TLBs - one for data and one for instructions. Each TLB holds 64 entries. TLB entries can be locked down in software, but we do not use any lockdowns for the experiments in this paper. The clock fed to the processor can be configured during boot time. A 120 MHz processor clock is used for our experiments. Direct read access to a 32-bit on-chip timer running at 6 MHz (166.67 nanosecond measurement granularity) is used to measure time. The data cache is configured for write-back caching. 32MB of SDRAM with a 32-bit data path to the CPU is present on the OMAP1610 H2 board. We clock the SDRAM at the same frequency as the processor. Processor performance monitoring counters are not available on the ARM processor we use. We are, therefore, unable to report statistics on the number of instructions executed. Our tests were run on version 2.6.20-rc5-omap1 of the Linux kernel. We modified the kernel to run our experiments as described in section 3.
3. EXPERIMENTS 3.1 Context Switching Overhead We added code into the Linux kernel to measure the running time of tasks performing deterministic computation with a controlled number of context switches and without external interference such as interrupts. In order to accurately measure running time and the effects of a context switch, the task code is built into the kernel and system calls are not used. We, however, configure the task with a unique
mmu struct to ensure that the page table mappings are reset during a context switch. This set up allows us to explore the impact of cache flushes and TLB invalidation during a context switch. All measurements are performed starting with a cold cache and an empty translation cache (TLB). All data points in the graphs we present are an average over five measurements. The maximum (over all data points) coefficient of variation (standard deviation/average) of the running time measurement is marked in each graph as ’Max CV’. In our experiments to measure context switch overhead, we use two such tasks. The code for the tasks is modified to context switch between one another similar to cooperative multithreading. The scheduler is not used and we directly switch between the tasks by invoking the Linux context switch function. The minimum possible combined running time of both tasks (Rtotal ) is obtained when the first task is started and runs to completion, followed by a context switch to the second task which also runs to completion. This is illustrated in figure 1. The direct overhead for a single context switch is constant for all experiments and is measured as C. This is essentially the time taken to execute the context switch function with an empty cache. The Rtotal measurement includes the overhead for one context switch. Rtotal − C is the running time of both tasks without this overhead. The total running time of both tasks with n ′ ′ context switches is measured as Rtotal . Rtotal − (Rtotal − C) is the total overhead due to the context switching. This consists of two parts. The first part is direct overhead due to the actual running time of the context switch code (register set save and restore, MMU switch etc). The second part is indirect overhead because of memory and translation cache pollution. The total direct overhead for an experiment with n context switches is n ∗ C. The indirect overhead experienced by both tasks together due to the n context switches ′ is then obtained as I = Rtotal − (Rtotal − C) − n ∗ C. When ′ n = 1, Rtotal = Rtotal and therefore, I = 0. The tasks we chose for our experiments are processor and memory bound algorithms: bubble sort, deflate compression, AES encryption and CRC computation. These are configured to be non-interactive and use no device I/O. The data set used by the bubble sort algorithm is set to be the
7000 Total Indirect Overhead Sort Time Inflation Deflate Time Inflation Context Switch Time Inflation
Total Indirect Overhead AES Time Inflation CRC Time Inflation Context Switch Time Inflation
6000 Overhead Time (microseconds)
Overhead Time (microseconds)
10000
8000
6000
4000
5000
4000
3000
2000
2000
1000
0
0
20
40 60 Number of Context Switches
80
0
100
0
20
Max CV: 0.005 %
(a) bubble-sort and deflate
40 60 Number of Context Switches
80
100 Max CV: 0.04 %
(b) AES and CRC
6000 Total Indirect Overhead Sort Time Inflation CRC Time Inflation Context Switch Time Inflation
Total Indirect Overhead CRC Time Inflation Deflate Time Inflation Context Switch Time Inflation
8000
Overhead Time (microseconds)
Overhead Time (microseconds)
5000
4000
3000
2000
6000
4000
2000 1000
0
0
20
40 60 Number of Context Switches
80
0
100
0
20
Max CV: 0.008 %
(c) bubble-sort and CRC
40 60 Number of Context Switches
80
100 Max CV: 0.01 %
(d) CRC and deflate 12000
Total Indirect Overhead AES Time Inflation Deflate Time Inflation Context Switch Time Inflation
10000
8000
6000
4000
8000
6000
4000
2000
2000
0
Total Indirect Overhead AES Time Inflation Sort Time Inflation Context Switch Time Inflation
10000 Overhead Time (microseconds)
Overhead Time (microseconds)
12000
0
20
40 60 Number of Context Switches
80
100 Max CV: 0.03 %
(e) AES and deflate
0
0
20
40 60 Number of Context Switches
80
100 Max CV: 0.02 %
(f) AES and bubble-sort
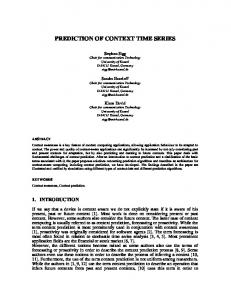
Figure 2: Indirect Context Switch Overhead
same size as the data cache and is aligned to fit completely within the cache. This maximizes data cache locality for the sort task and allows us to explore the impact of data cache pollution. All of the other tasks operate on large data streams and therefore exhibit little data cache locality. The
data set size for each task is chosen such that the task takes between 3 and 4 seconds to complete. The deflate, AES and CRC tasks are based on code libraries already inside the Linux kernel; the bubble sort algorithm was implemented by one of the authors.
1400
500
1200 Indirect Overhead Time (microseconds)
Indirect Overhead Time (microseconds)
600
400
300
200
100
0
1000
800
600
400
200
0
10
20 30 Number of Interrupts
40
0
50
0
10
Max CV: 0.002%
(a) bubble-sort
20 30 Number of Interrupts
40
50 Max CV: 0.02%
(b) deflate 2000
3500
Indirect Overhead Time (microseconds)
Indirect Overhead Time (microseconds)
3000
2500
2000
1500
1000
1500
1000
500
500
0
0
10
20 30 Number of Interrupts
40
50
0
0
Max CV: 0.01%
(c) AES
10
20 30 Number of Interrupts
40
50 Max CV: 0.02%
(d) CRC
Figure 3: Indirect Interrupt Service Routine Overhead
Figure 2 shows the indirect overhead measurements for different pairs of tasks and different values of n. The total indirect overhead measurement is broken down into three components: the indirect overhead of the individual tasks and the inflation in the context switch time because of the need to flush dirty cache lines to memory. The “sort” task measurements have very low variation and show a perfectly constant rate of overhead increase. The variation in the time measurements for the other tasks is higher and the plots are not smooth. However, the general trend for all tasks is an increase in the indirect overhead as the number of context switches increases. The indirect overhead for 99 context switches between bubblesort and deflate adds about 10.3 milliseconds to their combined running time of 7.159 seconds (0.14% increase) For AES and CRC, the indirect overhead adds 6.9 milliseconds to their combined running time of 6.6 seconds (0.10% increase). The maximum increase we observed was with AES and deflate (0.18%). An interesting observation is that the indirect overhead at 99 context switches is larger than the direct overhead (4.75 milliseconds).
Altogether (direct+indirect), the context switching (99 times) adds between 0.17% and 0.25% to the running time for the various pairs of tasks.
3.2
Interrupt Servicing Overhead
In order to measure overheads due to interrupt servicing, we modify the Linux kernel to run a task with context switching disabled and only one interrupt enabled. The interrupt we choose for this set of experiments is a timer interrupt. The actual hardware timer is disabled. We control the interrupts in this experiment by forcing an interrupt to be raised. This is done by writing to a memory-mapped register on the interrupt controller. The interrupt is processed by the standard Linux kernel interrupt handling mechanisms. The handler for the interrupt just increments a counter and returns. We first measure the direct overhead involved in servicing the interrupt as D. The task is configured to periodically request interrupts while running. If the time taken to complete the task without interrupts is Rtask and the time taken ′ to complete the task with n interrupts is Rtask , the indirect
overhead due to the interrupts is obtained by the equation ′ I = Rtask − Rtask − n ∗ D. Figure 3 shows the indirect overhead measurements for different rates of interrupts. The indirect overhead measurements are low and in the order of hundreds of microseconds. Unfortunately, even though the coefficient of variation of the actual measurements is low, the coefficient of variation for these calculated values of indirect overhead is high and only a general trend should be interpreted from all the graphs. A few data points in the graphs have been removed because the variation was extremely high. The “sort” task has the lowest variation and is a more accurate representation of interrupt indirect overhead behavior. For all tasks, the indirect overhead increases as the interrupt frequency is increased. Overheads are generally lower than for context switching because the caches and the TLB are not flushed. The indirect overhead due to servicing 49 interrupts during the execution of “sort” adds 0.01% to its running time of 3.64 seconds. The values for deflate, AES and CRC are 0.02%, 0.09% and 0.05% respectively. For the interrupt experiments, the direct overhead measurements are larger than the indirect overhead measurements. We suspect that this is due to the fact that our timer interrupt experiment does not significantly perturb the cache or the TLB. Altogether (direct+indirect), the interrupt servicing experiments add between 0.28% and 0.38% to the total running time of the tasks for 49 interrupts.
4. RELATED WORK Others have considered the overhead due to context switching in the past. In [2], Ousterhout attempted to measure the overhead associated with context switching by measuring the round trip time for passing a token between two processes using a pipe. The creators of lmbench [3] improved upon this technique by eliminating system call overhead associated with Ousterhout’s measurements. Additionally, the in-memory size of the test processes were varied to determine how processor cache utilization effects context switching times. The relationship between caches and context switching (espicially for real-time systems) was examined in [4] in [5]. Unlike our experiments, none of these experiments attempt to differentiate between the direct cost of a context switch and the indirect costs of a context switch. Researchers have also examined the impact of context switching on branch prediction accuracy and found the effect to be minimal [6]. This finding implies that branch prediction failure is not a significant source of indirect context switching overhead. Context switching overhead numbers have also been used to promote new operating systems. The developers of L4 microkernel used lmbench to show that by using hardware extensions available in the ARMv5 instruction set, the ARM implementation of L4 has a significantly lower context switching overhead than Linux running on ARM [7].
5. CONCLUSIONS The measurements reported in this work are low level measurements of context switch overhead between two threads
inside the operating system kernel and the effect of interrupt servicing code. A context switch between two userspace processes involves both a timer interrupt (for an involuntary switch) and the low level switch measured in this paper. Overhead measurements for userspace process context switching are not reported in this paper. The Linux kernel code used in our experiments is available on our website at http://choices.cs.uiuc.edu/
6.
ACKNOWLEDGMENTS
Part of this research was made possible by grants from DoCoMo Labs USA and generous support from Texas Instruments.
7.
REFERENCES
[1] Texas Instruments OMAP Platform. http://focus.ti.com/ omap/docs/omaphomepage.tsp. [2] John K. Ousterhout. Why aren’t operating systems getting faster as fast as hardware? In USENIX Summer, pages 247–256, 1990. [3] Larry W. McVoy and Carl Staelin. lmbench: Portable tools for performance analysis. In USENIX Annual Technical Conference, pages 279–294, 1996. [4] Jeffrey C. Mogul and Anita Borg. The effect of context switches on cache performance. In ASPLOS-IV: Proceedings of the fourth international conference on Architectural support for programming languages and operating systems, pages 75–84, New York, NY, USA, 1991. ACM Press. [5] Johan St¨ arner and Lars Asplund. Measuring the cache interference cost in preemptive real-time systems. In LCTES ’04: Proceedings of the 2004 ACM SIGPLAN/SIGBED conference on Languages, compilers, and tools for embedded systems, pages 146–154, New York, NY, USA, 2004. ACM Press. [6] M. Co and K. Skadron. The effects of context switching on branch predictor performance. In 2001 IEEE International Symposium on Performance Analysis of Systems and Software, pages 77–84, Nov 2001. [7] L4 Performance. http://ertos.nicta.com.au/research/l4/ performance.pml.