Learning material such as scientific textbooks or visual dictionaries (e.g., [BP96, Doc02]) comprises many ... of labels: internal labels overlay their associated visual object; external labels are placed ..... DK Ultimate Visual Dictionary. Dorling ...
Contextual Grouping of Labels Timo Götzelmann, Knut Hartmann, and Thomas Strothotte Department of Simulation and Graphics Otto-von-Guericke University of Magdeburg PSF 4120, D-39016 Magdeburg, Germany {timo,knut,tstr}@isg.cs.uni-magdeburg.de Abstract Learning materials frequently employ illustrations with many labels in order to coordinate visual and textual elements. The labels in illustrations support mainly two search tasks: learners can determine the graphical reference objects of unknown terms or vice versa (i.e. get textual descriptions for unknown visual objects). In traditional print media, human illustrators often overload an illustration with many labels in order to reduce the printing costs. But such illustrations ignore the limitations of human cognitive processes. Based on the chunking principle, we argue, that interactive 3D visualizations should be carefully adopted to the current search tasks. Therefore, we consider semantical relations to select only those labels which are relevant for the current task and emphasize the associated graphical objects. Finally, we present a novel layout algorithm for label grouping to aid learning.
1
Introduction
Learning material such as scientific textbooks or visual dictionaries (e.g., [BP96, Doc02]) comprises many illustrations to explain complex spatial configurations. Labels, legends, and figure captions smoothly integrate textual information. Illustrations contain two types of labels: internal labels overlay their associated visual object; external labels are placed on background objects and additional meta-graphical objects such as anchor points and connecting lines establish co-referential relations between visual and textual elements. Labels coordinate visual and textual information. Therefore, an effective label layout supports two main search tasks: Term 7→ Visual Object: Visual Object 7→ Term:
To which object does a term refer? What is the denotation of the visual object in a domain-specific or foreign language?
Normally, these search tasks are induced by unknown terms within an accompanying descriptive text. Therefore, a text illustration should contain those terms within its labels. By guiding the viewers attention to relevant graphical objects, emphasis techniques further enhance learning. However, these techniques rely on a visual differentiation between emphasized and de-emphasized objects. Therefore, the effectiveness of graphical emphasis techniques is also affected by the number of objects to be highlighted.
CERABUM
Thalamus DIENCEPHALON
Hypothalamus
Pineal gland Midbrain BRAIN STEM
Pons Medulla oblongata CEREBELLUM
Infundibulum Pituitary gland
Spinal cord
POSTERIOR
ANTERIOR
(a) Brain: Medial view of sagittal section
FRONTAL BONE Crista galli Olfactory foramia
ETHMOID BONE
Cribriform plate Coronal surface Optic foramen Sella turcica
SPHENOID BONE
Foramen ovale Squamus suture TEMPORAL BONE
PARIETAL BONE Foramen magnum Lambdoid suture OCCIPITAL BONE
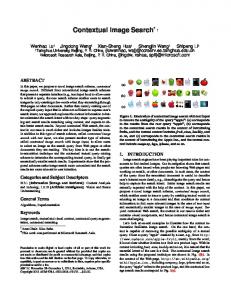
(b) Sphenoid bone: Superior view Figure 1: Label groupings with meta-graphical objects and colors (source [Tor97, p.226] and [Tor97, p.113]).
Human illustrators carefully adopt the number of labeled and emphasized objects to the requirements of the thematic topic of the accompanying text segment. However, they are also forced to insert as many labels as possible into a single illustration in order to reduce the printing costs for textbooks. But this strategy often spoils the learning efficiency. 3D visualizations can increase the learning efficiency of on-line tutoring materials if they support an interactive exploration. Moreover, their renditions can be adopted to the specific requirements of the current learning task. Therefore, we developed a novel interactive 3D browser which guides the attention of the learner to the relevant objects by performing an adaptive label selection and coordinated graphical emphasis techniques. In order to improve the learning efficiency, cognitive psychologists suggest to re-organize unstructured data hierarchically (chunking principle). Hence, labels of semantically related concepts or conceptual groups should be grouped (see Fig. 1). Therefore, our system employs an ontology editor. Human experts can define an ontology (i.e. a formal specification of relevant domain concepts and their relationships [Gru93]). Moreover, they provide media-specific realizations (i.e. graphical objects in 3D models and textual descriptions) for formal domain concepts in order to group related labels into a cluster. Semantic relations and information on media realizations are represented as directed links and form a semantic network. Our interactive 3D browser also supports learners to explore the domain ontology. It employs visualization techniques which human illustrators use to communicate semantic groups within the label layout: meta-objects (braces) and the Gestalt, i.e. the proximity and similarity in visual attributes of labels (see Fig. 1-a) or graphical objects (see Fig. 1-b). In our system all group members are merged within a group label (proximity), are aligned with respect to the label box (alignment), and are drawn with the same color (similarity). Moreover, those graphical objects which are associated with the contextual group in focus should also be visible. Therefore, we employ automatic techniques to determine good views onto a dynamic set of scene elements. This paper is organized as follows: Sec. 2 discusses the related work in contextualized label grouping. Sec. 3 presents the new label grouping algorithm. The determination of good camera positions is discussed in Sec. 4. The results of our work are presented in Sec. 5. Finally, Sec. 6 addresses some open questions and future research directions.
2
Related Work
Chunking: Label Selection and Grouping. Efficient on-line tutoring systems must consider the capacity of human cognitive processes. Psychological experiments suggest that the number of parameters of a single cognitive process or cognitive representation is limited to seven plus minus two [Mil56], five [Sim74], or only four [HBMB05]. Hence, cognitive theories assume that humans organize their mental representations hierarchically, where the number of individual representation units (chunks) does not exceed this limit.
Various memory training systems enhanced the processing speed and efficiency of learning or reading tasks by applying the chunking technique (i.e. a hierarchical reorganization of unstructured data which respects the capacity of the short term memory). However, current interactive labeling systems neither consider the limitation of the human cognitive system nor they apply the chunking technique. In this paper we argue, that a hierarchical label organization should reflect semantic considerations. Learners can select domain concepts or media-specific relations (3D objects or labels) and thus define a semantic context. This selection influences the label grouping and the application of graphical emphasis techniques. Label Layout Algorithms. Guidelines for an effective label layout are rarely found in textbooks for scientific illustrators (see [Hod03]). Frequently, they refer to Imhof’s guidelines to place labels on maps [Imh75]. The transformation of these informal guidelines into formal metrics was pioneered by Christensen and colleagues [CMS95, ECMS97]. Hartmann et al. [HGAS05] first described the conflicting functional and aesthetic constraints for label layouts in interactive 3D visualizations. Their metrics aim at minimizing the movement of layout elements in subsequent frames and were applied in frame-coherent real-time layout algorithms for external labels [AHS05] and within an integrated internal and external label layout [GAHS05b]. Our system extends the latter system with an adaptive label selection and a novel layout algorithm for label groups. Automatic labeling algorithms were also integrated in Virtual or Augmented Reality environments (e.g., [BFH05, AF03]), interactive 3D visualizations (e.g., [PRS97, RSHS03, AHS05, GAHS05b]) or renditions of volumetric data (e.g., [BG05]). However, these systems do not consider the limitations of the human cognitive system within the label selection or the application of graphical emphasis techniques. Only the excentric labeling approach [FP99] in information visualization aims at minimizing the number of additional layout elements by labeling only the members of the cluster in focus. Graphical Emphasis Techniques. Research in non-photorealistic rendering (NPR) [SS02] aims at implementing drawing styles and graphical abstraction techniques used by human illustrators (e.g., [Hod03]). But even the most sophisticated classification schema of these techniques [PR02] ignores the enormous impact of the label layout to focus the viewer’s attention on the graphical objects associated to labels. Hence, this work focuses on the label selection and grouping which considers the chunking principle, whereas an industrial application would have to integrate more elaborate NPR rendering styles. Emphasized objects must be visible and have to be large enough on the projection. Transparency [DWE02] and cutaway views [DWE03] are a very efficient static way to minimize the visual impact of irrelevant occluding objects. These techniques were also applied to emphasize important objects in volumetric data [VKG04]. Dynamic systems determine views which minimizes occlusions or which respect psychological principles [PRC81, BTB99]. Some interactive multi-modal tutoring systems employ pre-computed viewpoints for the most salient visual objects [PRS96, SS99]. Beckhaus et al. [BRS01] automatically plan camera movements in order to guide the interactive exploration. The latter system also incorporates interaction-specific relevance values which are propagated over a formal domain representation.
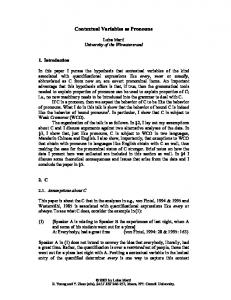
Figure 2: Ontology editor.
3
Layout Algorithms for Label Groups
Modern 3D modeling software employs hierarchical structures (scene graphs) to segment complex models into their components. These hierarchical representations simplify modeling, rendering, and animation tasks, but they do not suffice to represent a domain ontology: Scene graphs can represent the spatial aspect of part-whole relations, however, they are not intended to comprise semantic networks. Moreover, a domain ontology should be mediaand language-independent. In our system, it also links domain concepts to media-specific realizations (object identifiers of 3D models and textual descriptions). Figure 2 presents a screen-shot of the ontology editor which is part of our system. Our system integrates an adaptive label selection and a novel layout algorithm for label groups. Sec. 3.1 describes the layout of label groups and the arrangement of their individual labels inside them. Sec. 3.2 focuses on the appearance and behavior of label groups. Section 3.3 discusses an approach to exclusively label those graphical object which are associated with the current semantic context.
(a) Centroid c
(b) Find a possible label placement
(c) Judge distance to all possibilities
1. Determine the anchor points pi for the visible objects i ∈ g of all groups g ∈ G 2. Calculate the centroid for a group label: centroid(g) = 1n ∑i∈g pi 3. For each centroid(g) and for each direction: search the nearest possibility to accommodate the label group 4. Select the label group with the shortest distance 5. Place the label group Figure 3: Group label layout algorithm.
3.1
Label Layout
Label Group Layout. The label layout is dominated by the calculation of anchor points. As their placement is crucial to prevent co-referential mismatches, the exact object shape has to be considered. Therefore, a color-coded projection of the current view is segmented and skeletonized. Subsequently, the objects skeleton is analyzed in order to choose salient positions as anchor points. The anchor points for contextual groups are determined by computing the centroid of all visible members (see Fig. 3-a). An optimal label placement minimizes the distance between labels and their associated anchor points while preventing label-object overlaps. To determine the optimal distance of the label box for a given direction, we subsequently shift the label box from the centroid outwards (see Fig. 3-b). This process stops when the label box does not overlap any nonbackground pixel in the color-coded image or it leaves the view-port. Finally, we add an additional label separation space. The distance between the label and centroid is then taken as evaluation criteria; label boxes outside the view-port get an infinite score.
(a) Focus on the red group
(b) Focus on the green group
Figure 4: Changing between groups (without transparency).
Our layout algorithm for group labels employs a circular layout style [AHS05]. The potential label positions in a set of directions are evaluated according to their distance. Fig. 3-c presents the label positions and their weights for 3 out of 6 directions. The complete layout algorithm for label groups is presented in Figure 3. Frame-Coherency. In order to minimize the movement of layout elements during user interactions, the layout elements remain on their positions as long as possible. However, if label groups overlap the projection of the 3D model, the label layout has to be re-computed. Therefore, a new centroid and a new position for the colliding group is calculated. For a smooth transition the group is faded between the old and the new position. Layout Inside Groups. We resolve intersections between connecting lines of labels within a group by swapping their positions [GAHS05a]. However this strategy negatively affects the frame coherency. Hence, the user should specify,whether layout aesthetic (few intersections) or layout calmness (few label swappings) is more important to the current task.
3.2
Appearance and Behavior of Groups
In our system only one contextual group achieves the focus. The objects and labels of this active group are emphasized. Therefore, graphical objects, connecting lines, and label boxes are drawn opaque whereas the components of unfocused groups are rendered semitransparently (indirect emphasis). This strategy also reduces the impact of intersections between connecting lines of different label groups. To focus another contextual group, the user has to double click on an appropriate graphical object or its label (see Fig. 4). Alternatively, unfocused groups could be collapsed to a single label. To get a more stable layout throughout user interactions, the groups remain on their calculated positions until they overlap a graphical object. In this case a new position near to the centroid of the anchor point is calculated (see Sec. 3.1)
(a) Arteries
(b) User selected contextual group
Figure 5: Different exclusively labeled contexts.
3.3
Contextual Labeling
According to the chunking principle neither the number of groups nor the total number of labels should exceed the cognitive capacity. Therefore, we implemented an exclusive labeling approach for those objects which are relevant for user-specific search tasks. In this approach only the relevant graphical objects are labeled while the other objects are rendered semi-transparently in order to establish contextual information. Thus, the textual information itself becomes a graphical abstraction technique (see Fig. 5).
4
Determining Appropriate Views for Dynamic Groups
In order to present a contextual group all their associated graphical objects should also be visible. Therefore, this section presents an algorithm to determine the camera parameters for a good view onto a small number of graphical objects. In an optimal view no relevant object is occluded. The choice of a view which is showing as many graphical objects as possible is not trivial and is related to the more global problem to determine “good views” for 3D models. Polonsky [PPB+ 05] described and compared evaluation criteria and algorithms for this classical problem in computer graphics. A simple approach is to store manually selected views for all important object combinations. But even if domain experts are assisted by an automated scene analysis, this approach is normally not feasible due to the combinatoric explosion. Thus, the system either displays an expert-specified view onto the group or determines a potentially good view dynamically.
(1,1,1)
1. Store the old view of the image 2. For each view: • Set the camera parameters • Render a color-coded image • Evaluate the image 3. Select the winner 4. Coherently transit between old and new camera position
(-1,-1,-1)
(a) Evaluated viewpoints
(b) View selection algorithm
Figure 6: Determination of ”good views” onto an object group.
In order to determine views automatically, we analyze a fixed number of views to the scene and evaluate them. In this approach we use the eight corners of the objects bounding box (see Fig. 6-a). We confine to find a view with a maximum of important and visible objects, instead of caring about the fuzzy claim of an aesthetic valuable view. As the label layout system works on the already segmented color-coded projections of the 3D scene, we employ the viewpointentropy of Vázquez [VFSH03] to determine the best view. Thus, for the important objects O we determine the number of visible pixels. In our scenario it is more important to maximize the number of relevant graphical objects which are contained in a single projection than to maximize their size. Therefore, we calculate a weighted sum of both criteria, where wo > w f . Figure 7: Transition to a new evaluated view.
In order to get a coherent transition between the initial view and the desired view, the viewing coordinates of the camera are interpolated (see Fig. 7). Figure 6-b presents the algorithm to determine a good view for an object group dynamically.
Figure 8: Contextual groups of a motor.
5
Results
We implemented an interactive application to explore 3D models which considers the limitations of the human cognitive processes. Domain experts can interactively structure the domain entities by creating groups of related objects. Our interactive system also integrates a drag&drop editor to inspect and define hierarchical structures. The process is also supported by suggesting good views to groups. The domain ontology (entities, groups, relations, and preferred views) is stored in the XML format, which offers a flexible interface to other applications and allows to define multiple contexts of a model. In this paper, we present a novel real-time layout algorithm for label groups. The contextual grouping is exploited to guide the attention by an appropriate choice of emphasized objects and an appropriate label selection. We developed the concept of an exclusive labeling context (see Fig. 8). As the determination and rendering of the label groups is done in a very time-efficient manner, the system performance is equivalent to the base system [GAHS05b].
6
Discussion and Future Work
Domain Ontology. By reducing the number of co-referential search tasks, the contextual labeling eases the understanding of complex spatial configurations. Therefore, on-line tutoring systems with contextualized illustrations should be more effective than pure adaptations of traditional textbooks with generalized illustrations. However, domain experts have to define these contextual groups manually. Therefore, we plan to integrate external applicationindependent ontologies like WordNet [Fel98] or their language-specific variant GermaNet [KL02]. Other application- or domain-specific semantic representations can be employed by converting them to our XML format. We are currently extending our domain ontology to accommodate longer textual descriptions and semantic classifications. The detailed descriptions should control the search for appropriate external documents with information retrieval technologies. Another challenging task is to extract relevant segments in these documents and to assign them to appropriate scene objects. Finally, the camera parameters or the scene have to be adjusted according to the IR result. Label Layout. If the number of concurrent groups exceeds 5-7, the layout gets too complex and the grouping algorithm is not always able to accommodate all the groups, so the label groups are sometimes placed off the view-plane. The same problem arises, if the model is scaled too much, so that there is not sufficient space to place external labels. However, we decided not to constrain the user in interacting with the model. Furthermore, the layout system does not take any priorities into account. The groups are placed in a greedy manner — i.e. if a group has to be rearranged, the layout algorithm searches for an unoccupied position. This heuristics both reduces the complexity of the layout task and minimizes the number of moving layout elements during user interactions. To analyze the usability and acceptance of our approach we plan to perform a user study. Emphasis Techniques. This work employed neither sophisticated emphasize techniques nor it considers the semantic dependencies between relevant objects. Further prototypes will extent Hartmann’s [HS02] approach to select the rendering style and their parameters according to relevance values which are propagated over a formal domain representation.
References [AF03]
R. Azuma and C. Furmanskim. Evaluating Label Placement for Augmented Reality View Management. In IEEE and ACM Int. Symp. on Mixed and Augmented Reality, pages 66–75, 2003.
[AHS05]
K. Ali, K. Hartmann, and Th. Strothotte. Label Layout for Interactive 3D Illustrations. Journal of the WSCG, 13:1–8, 2005.
[BFH05]
B. Bell, S. Feiner, and T. Höllerer. Managing Visual Constraints in 3D User Interfaces. In O. Stock and M. Zancanaro, editors, Multimodal Intelligent Information Presentation, pages 255–277. Kluwers, 2005.
[BG05]
S. Bruckner and E. Gröller. VolumeShop: An Interactive System for Direct Volume Illustrations. In IEEE Visualization, pages 671–678, 2005.
[BP96]
S. Biesty and R. Platt. Stephen Biesty’s Incredible Explosions. Dorling Kindersley Publishing, London, 1996.
[BRS01]
S. Beckhaus, F. Ritter, and Th. Strothotte. Guided Exploration with Dynamic Potential Fields: The CubicalPath System. Computer Graphics Forum, 20(4):201–210, December 2001.
[BTB99]
V. Blanz, M. J. Tarr, and H. H. Bülthoff. What Object Attributes Determine Canonical Views? Perception, 28:575–599, 1999.
[CMS95]
J. Christensen, J. Marks, and S. Shieber. An Empirical Study of Algorithms for Point-Feature Label Placement. ACM Transactions on Graphics, 14(3):203–232, 1995.
[Doc02]
P. Docherty, editor. DK Ultimate Visual Dictionary. Dorling Kindersley Publishing, New York, revised edition, 2002.
[DWE02]
J. Diepstraten, D. Weiskopf, and T. Ertl. Transparency in Interactive Technical Illustrations. Computer Graphics Forum, 21(3):317–325, September 2002.
[DWE03]
J. Diepstraten, D. Weiskopf, and T. Ertl. Interactive Cutaway Illustrations. Computer Graphics Forum, 22(3):523–532, September 2003.
[ECMS97] S. Edmondson, J. Christensen, J. Marks, and S. Shieber. A General Cartographic Labeling Algorithm. Cartographica, 33(4):13–23, 1997. [Fel98]
C. Fellbaum, editor. WordNet: An Electronic Lexical Database. MIT Press, Cambridge, MA, 1998.
[FP99]
J.-D. Fekete and C. Plaisant. Excentric Labeling: Dynamic Neighborhood Labeling for Data Visualization. In SIGCHI Conf. on Human Factors in Computing Systems, pages 512–519, 1999.
[GAHS05a] T. Goetzelmann, K. Ali, K. Hartmann, and Th. Strothotte. Adaptive Labeling for Illustrations. In 13th Pacific Conf. on Computer Graphics and Applications, pages 64–66, 196, 2005. [GAHS05b] T. Goetzelmann, K. Ali, K. Hartmann, and Th. Strothotte. Form Follows Function: Aesthetic Interactive Labels. In Computational Aesthetics 2005. EG WS on Computational Aesthetics in Graphics, Visualization and Imaging, pages 193–200, 2005. [Gru93]
T. R. Gruber. A Translation Approach to Portable Ontologies. Knowledge Acquisition, 5(2):199–220, 1993.
[HBMB05] G. S. Halford, R. Baker, J. E. McCredden, and J. D. Bain. How Many Variables Can Humans Process? Psychological Science, 15(1):70–76, 2005. [HGAS05]
K. Hartmann, T. Götzelmann, K. Ali, and Th. Strothotte. Metrics for Functional and Aesthetic Label Layouts. In 5th Int. Symp. on Smart Graphics, pages 115–126, 2005.
[Hod03]
E. R. S. Hodges, editor. The Guild Handbook of Scientific Illustration. John Wiley & Sons, New York, 2nd edition, 2003.
[HS02]
K. Hartmann and Th. Strothotte. A Spreading Activation Approach to Text Illustration. In 2nd Int. Symp. on Smart Graphics, pages 39–46, 2002.
[Imh75]
E. Imhof. Positioning Names on Maps. 2(2):128–144, 1975.
[KL02]
C. Kunze and L. Lemnitzer. GermaNet - Representation, Visualization, Application. In 3rd Int. Conf. on Language Ressources and Evaluation, pages 1485–1491, 2002.
[Mil56]
G. A. Miller. The Magical Number Seven, Plus or Minus Two: Some Limits on Our Capacity for Processing Information. Psychological Review, 63:81– 97, 1956.
[PPB+ 05]
O. Polonsky, G. Patané, S. Biasotti, C. Gotsman, and M. Spagnuolo. What’s in an Image? The Visual Computer, 21(8–10):840–847, 2005.
[PR02]
B. Preim and F. Ritter. Techniken zur Hervorhebung von Objekten in medizinischen 3d-Visualisierungen. In Simulation und Visualisierung, pages 187– 200, 2002.
[PRC81]
S. E. Palmer, E. Rosch, and P. Chase. Canonical Perspective and the Perception of Objects. In Long J. and Baddeley A., editors, Attention and Performance, volume 9, pages 135–151. Erlbaum, Hillsdale, 1981.
[PRS96]
B. Preim, A. Ritter, and G. Steinecke. Gestaltung von Animationen zur Erklärung komplexer 3D-Modelle. In Simulation und Animation für Planung, Bildung und Präsentation, pages 255–266, 1996.
[PRS97]
B. Preim, A. Raab, and Th. Strothotte. Coherent Zooming of Illustrations with 3D-Graphics and Text. In Graphics Interface, pages 105–113, 1997.
[RSHS03]
F. Ritter, H. Sonnet, K. Hartmann, and Th. Strothotte. Illustrative Shadows: Integrating 3D and 2D Information Display. In Int. Conf. on Intelligent User Interfaces, pages 166–173, 2003.
[Sim74]
H. Simon. How Big is a Chunk? Science, 183:482–488, 1974.
[SS99]
S. Schlechtweg and Th. Strothotte. Illustrative Browsing: A New Method of Browsing in Long On-line Texts. In Computer Human Interaction. Proc. of INTERACT-99, pages 466–473, 1999.
The American Cartographer,
[SS02]
Th. Strothotte and S. Schlechtweg. Non-Photorealistic Computer Graphics: Modeling, Rendering, and Animation. Morgan Kaufman Publisher, Los Altos, 2002.
[Tor97]
G. J. Tortora. Introduction to the Human Body: The Essentials of Anatomy and Psychology. Benjamin Cummings, Menlo Park, CA, 1997.
[VFSH03]
P. P. Vázquez, M. Feixas, M. Sbert, and W. Heidrich. Automatic View Selection Using Viewpoint Entropy and its Application to Image-Based Rendering. Computer Graphics Forum, 22(4):689–700, December 2003.
[VKG04]
I. Viola, A. Kanitsar, and M. E. Gröller. Importance-Driven Volume Rendering. In IEEE Visualization 2004, pages 139–145, 2004.