the adapting grating. For example, Harris (1970) re- ported that color aftereffects were contingent on ret-. Kevin Jordan's mailing address is: Department of ...
Perception & Psychophysics 1983,33 (5),420-424
Contextual influences on a spatial-frequency-contingent color aftereffect KEVIN JORDAN
Quincy College, Quincy, Illinois
and JOHN UHLARIK
Kansas State University, Manhattan, Kansas Spatia}:.frequency-eontin~nt color aftereffects were induced in eight observers in order to examine the role of apparent spatial frequency in the aftereffects. Test stimuli consisted of achromatic gratings presented either with or without the context of a receding pictorial corridor array. A neutral-point procedure was used to assess the strength of the color aftereffects. The results indicated that both retinal and apparent spatial frequency affected the color aftereffects on those test gratings presented in the context of the corridor array. However, the color aftereffects on the test gratings presented without context were affected only by variations in retinal spatial frequency. It is concluded that the stimulus for the color aftereffects is not simply the retinal representation of the test stimulus. Therefore, any description of contingent color aftereffects based on selective chromatic adaptation of retinotopically organized cortical feature detectors is not complete.
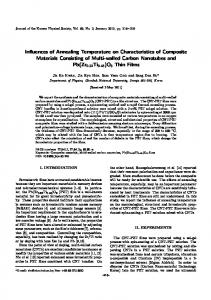
Jordan and Uhlarik (1982) recently reported a color aftereffect contingent on the apparent spatial frequency of test gratings. Subsequent to the induction of color aftereffects, apparent spatial frequency was varied in one instance by placing test gratings of identical retinal spatial frequency in the context of a receding pictorial array (see Figure 1). A test grating in the upper region of this array should appear larger (i.e., to have a lower spatial frequency) than the same grating in the lower region of the array due to implicit depth cues and Emmert's law. Questionnaire responses indicated that the saturation and hue of color aftereffects were contingent on the similarity of the apparent spatial frequency of the test grating to that of the adapting grating: the closer the match between apparent test-grating frequency and the adapting frequency, the more saturated the aftereffect hue. Other investigators have reported color aftereffects contingent on perceptual organization (Uhlarik, Pringle, & Brigell, 1977) and apparent orientation (Mikaelian, 1976) of test gratings. All of these findings are inconsistent with previous observations that aftereffect strength is greatest when the physical parameters of a test grating match those of the adapting grating. For example, Harris (1970) reported that color aftereffects were contingent on retKevin Jordan's mailing address is: Department of Psychology, Quincy College, Quincy, Illinois 62301. Requests for reprints should be sent to John Uhlarik, Department of Psychology, Kansas State University, Manhattan, Kansas 66506.
inal spatial frequency and that variation of apparent spatial frequency did not affect aftereffect strength. The present experiment was designed to resolve the inconsistency of the results of Harris (1970) and Jordan and Uhlarik (1982). One obvious possibility is that both retinal and apparent spatial frequencies affect the strength of color aftereffects. Unfortunately, the nature of the experimental design and the dependent measure (forced-choice questionnaire) used by Jordan and Uhlarik allowed only for an as-
Fllure 1. Example of a reeedlni pictorial corridor array that manifests Emmert's law. The two lratlnls are of Identical retinal spatial frequency.
420
Copyright 1983 Psychonomic Society, Inc.
CONTEXT AND COLOR AFTEREFFECTS
sessment of whether either retinal or apparent spatial frequency was important. Therefore, the present experiment factorially combined retinal and apparent spatial frequency of test gratings and used a more quantifiabledependent measureof aftereffect strength. These methodological changes allowed a statistical test of whether retinal spatial frequency, apparent spatial frequency, or both affect color aftereffect strength. Color aftereffects contingent on spatial frequency were induced by alternately exposing observers to two different chromatic gratings (magenta and green) separated by two octaves of spatial frequency (3 and 12 cycles/deg). Then both retinal and apparent spatial frequencies of test gratings were varied and aftereffect strength was assessed using a neutral-point procedure (Harris, 1970). This neutral-point procedure takes advantage of the finding that a test grating with a spatial frequency intermediate to the adapting frequencies (octave scale) appears colorless, that is, that the aftereffect colors "neutralize" each other (e.g., Stromeyer, 1972). Specifically, the procedure requires observers to adjust their distance from a test grating to that neutral point at which movement toward the grating (decreasing retinal spatial frequency) evokes one aftereffect color and movement away from the grating (increasing retinal spatial frequency) evokes the other aftereffect color. In this experiment, individual neutral points of the color aftereffects were obtained for single test gratings placed in either the lower or the upper region of a receding pictorial corridor array. These two different positions of the test grating on the corridor array produced variations of apparent spatial frequency; a grating in the lower region of the array appeared smaller (i.e., to have a higher apparent spatial frequency) than the same grating in the upper region of the array due to pictorial depth cues and Emmert's law. Thirty-two of the 36 observers in Jordan and Uhlarik's (1982) experiments reported that the bars of a test grating in the upper region of the corridor array appeared thicker (i.e., to have a lower apparent spatial frequency) than the bars of the same test grating in the lower region of the array. In addition to the factor of position of the test grating, which produced variation of apparent spatial frequency, the experimental design included four levels of physical frequency of test gratings. These grating frequencies were specified in terms of retinal spatial frequency at the adapting distance. If the strength of the color aftereffects depended solely on retinal spatial frequency, the neutral-point settings for any test grating in the lower region of the corridor array would not differ significantly from settings for that same grating in the upper region of the array. However, systematic differences in neutralpoint settings would be expected if apparent spatial
421
frequency were involved in contingent color aftereffects because a test grating in the upper region of the array would be perceived as larger than the same grating in the lower region. Specifically, for a test grating of any retinal spatial frequency, the neutral-point settings for that grating in the upper region of the array would be significantly farther from the test array than would the settings for the same grating in the lower region of the array.
METHOD Observen Eight undergraduate students attending Kansas State University participated in the experiment in order to fulfill a psychology course requirement. None of the observers was familiar with pattern-contingent color aftereffects. Normal red-green color vision, as determined by pseudoisochromatic plates (Hardy, Rand, & Rittler, 1946), was a criterion for participation in the experiment. StlmuUand Design All stimuli were 3S-mm slides projected on the rear of a translucent screen. Presentation of the adaptation stimuli was controlled by a two-channel projection tachistoscope (Marietta No. ISS-C). The adaptation stimuli were vertical square-wave gratings photographed on Kodak high-contrast copy film (No. S069). Adaptation consisted of alternately presenting a 3·cycles/deg grating and a 12-cycles/deg grating projected through a magenta (Wratten No. 34a) and a green (Wratten No. S3) gelatin filter. Color and spatial frequency of the adaptation gratings were counterbalanced across observers. The projected image of the adaptation gratings subtended a visual angle of 4 deg horizontally and 2.6 deg vertically at a viewing distance of 2.S m, A composite grating was used to test for the initial presence of a postadaptation spatial-frequency-contingent color aftereffect. This grating contained achromatic vertical 3-cyclesldeg square waves on the left and achromatic vertical 12-cycles/deg square waves on the right. Sixteen 3S-mm slides were used to obtain neutral points of the color aftereffects. Of these 16 test slides, 8 were experimental stimuli and 8 were control stimuli. The 8 experimental test stimuli contained achromatic square-wave gratings of four different retinal spatial frequencies (4.2, 6, 8.S, and 12 cycles/deg at the 2.S-m adaptation distance) presented in either the lower or the upper region of the receding pictorial corridor array shown in Figure I. The 8 control test stimuli consisted of the same four gratings placed in either the lower or the upper region of the slide without the context of the receding corridor array and the accompanying cues to depth. The purpose of these stimuli was to control for the possibility of position in the picture plane per se affecting the strength of the aftereffects. The projected image of an entire test slide subtended a visual angle of 8 deg horizontally and S.2 deg vertically at a viewing distance of 2.S m. However, the squarewave gratings contained on these test slides subtended a smaller visual angle of 2.4 deg horizontally and 1.7 deg vertically. In order to allow the observer to move along the line of sight relative to the viewing screen during the test phase of the experiment, the wheels of a wheelchair were restricted to tracks that extended 2.4 m to either side of the 2.S-m adaptation distance. During the adaptation phase of the experiment, the wheels of the chair were locked in order to keep the observer a constant 2.S-m distance from the viewing screen. Procedure Each observer was adapted individually for 30 min by alternately presenting the two adaptation gratings for 2S sec with inter-
422
JORDAN AND UHLARIK
vening S-sec dark periods. The observer was instructed to maintain a constant upright body position with as little head movement as possible and to allow his or her gaze to wander over the projection area. Ten minutes after adaptation, the observer was tested for the initial presence of spatial-frequency-contingent color aftereffects. The composite test pattern (achromatic vertical gratings 3 cycles/ deg on the left and 12 cycles/deg on the right) was presented on the viewing screen and the observer was instructed to report the presence of any colors on each side of the slide. In order to be included in the neutral-point phase of the experiment, an observer had to report the expected complementary color aftereffect for each side of the composite grating. Thus, an observer adapted to the 3-cycles/deg magenta and 12-cycles/deg green gratings should have reported that the left side of the composite grating (3 cycles/deg) appeared greenish and that the right side of the grating (12 cycles/deg) appeared pinkish. Two observers were replaced in the appropriate adaptation condition for failing to meet this criterion. After the initial screening for the presence of contingent color aftereffects, the neutral-point procedure began. The locks on the wheelchair were released, and one of the 16 test slides was presented on the viewingscreen. The observer was instructed to move forward or backward to a crossover (or neutral) distance at which the grating on the test slide appeared to be one aftereffect color with movement toward the screen and the other aftereffect color with movement away from the screen. In all, the observer was given 24 neutral-point trials consisting of two presentations of each of the eight experimental (context) stimuli and one presentation of each of the eight control (no-context) stimuli.' Order of presentation of the test slides was determined randomly for each observer.
RESULTS
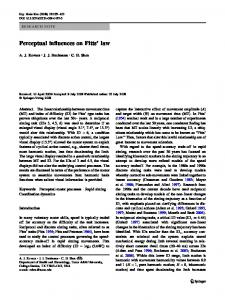
Because there were no significant differences in neutral-point settings across the counterbalanced adaptation conditions, the results were pooled across this factor. There were, however, large and systematic differences in the neutral-point settings among the test stimuli. The mean neutral-point settings for the control stimuli and for the experimental stimuli (pooled over the two replications) are shown in Figure 2. Control Stimuli The systematic decrease in the distances of the mean neutral-point settings with increasing spatial frequency on the abscissa in Figure 2a indicates an effect of retinal spatial frequency. In a 2 (position of the grating on the slide) x 4 (retinal spatial frequency) x 8 (observer) within-subject analysis of variance of the control-stimuli neutral-point settings, the main effect of retinal spatial frequency was statistically significant [F{3,21)=46.7S, p < .01]. However, Figure 2a shows an overlap of the neutral-point settings for the lower and the upper positions of the gratings on the control slides, which indicates that apparent spatial frequency was not involved in control-grating settings. This is supported statistically by the absence of a significant main effect of position on the slide [F{1,7) < 1]. All other main effects and
4.0 A: CONTROL
3.5
POSI TlON: lower -------. up per
3.0
0---0
.5 2.5
... ...... ...'" ... ..... "" ... .""=.. z:
2.0 1.5
z: c::I
z:
z:
.... ""
::E
4.0 B: EXPERIMENTAL
3.5 3.0 2.5 2.0 1.5
L
4.2
6.0
8.5
12.0
RETINAL SPATIAL FREQUE NCY (cycles/deg)
Figure 2. (A) Mean neutral-point settings for the control stimuli. (B) Mean neutral-point settings pooled over tbe two replications of tbe experimental stimuli. The abscissa represents tbe retinal frequency of tbe test gratings at the 2.5-m adaptation distance.
interactions in the analysis also failed to reach statistical significance. Experimental Stimuli The mean neutral-point settings for the experimental stimuli (Figure 2b) show the same systematic decrease with increasing spatial frequency as those of the control stimuli. This decrease indicates an effect of retinal spatial frequency for the test gratings presented in the context of the receding corridor array. The results of a 2 (replication) x 2 (position of the grating on the slide) x 4 (retinal spatial frequency) x 8 (observer) within-subject analysis of variance of the neutral-point settings of the experimental stimuli indicated a significant main effect of retinal spatial frequency [F(3,21)= 142.74, p < .01]. In contrast to the neutral-point settings for the control stimuli, Figure 2b also shows systematic differences between the neutral-point settings for test gratings in the lower and the upper positions on the slide (region of the corridor array). This difference indicates an effect of apparent spatial frequency for the experimental stimuli. This interpretation is supported by a significant main effect of position of the grating on the slide for the experimentalstimuli [F{1,7) = 40.91, p< .01].
CONTEXT AND COLOR AFTEREFFECTS
The critical difference between the experimental and control stimuli was the presence or absence of the context of the receding pictorial corridor array. The results indicate that only retinal spatial frequency influenced color aftereffect strength for the control stimuli, whereas both retinal and apparent spatial frequency systematically influenced the color aftereffects for the experimental stimuli. Finally, the interaction of position of the grating on the slide and retinal spatial frequency was not statistically significant for the experimental-stimuli neutral-point settings [F(3,21) < 1]. Assuming that a neutral-point setting is a linear function of factorial effects and experimental error, the absence of an interaction indicates that retinal and apparent spatial frequency are independent, additive components of the color aftereffects (Winer, 1971, chap. 5). All other main effects and interactions in the analysis also failed to reach statistical significance.
DISCUSSION It has generally been reported that color aftereffects are strongest when the retinal parameters of the adaptation and test patterns match. For example, McCollough (1965) reported that orientation-contingent color aftereffects were most saturated when the retinal orientation of the test grating was identical to the adaptation-grating orientation. Similarly, Harris (1970; see also Harris, 1980) reported that spatialfrequency-contingent color aftereffects were contingent on the retinal size of adaptation and test gratings, and that apparent size was not a factor. These findings constitute support for a popular class of descriptions that postulate that selectivechromatic adaptation of retinotopically organized cortical feature detectors underlies contingent color aftereffects. Thus, McCollough (1965) suggested that selective color adaptation of edge-detecting mechanisms that have been described in cat and monkey (Hubel & Wiesel, 1962, 1968) could account for orientationcontingent color aftereffects. The findings that color aftereffects can be made contingent on perceptual organization (Uhlarik et al., 1977) and on apparent orientation (Mikaelian, 1976) point to the problems associated with any model of contingent color aftereffects that is strictly tied to the retinal parameters of the adaptation and test stimuli. For example, Mikaelian stated that the finding that color aftereffects can be made contingent on apparent orientation "supports the argument that the McCollough effects are not retinally locked, and that the phenomenon may be mediated by central processes; a view that places severe limitations on the commonly proposed explanation in terms of selective chromatic adaptation of simple edge-detectors" (p.462).
423
The effects due solely to differences in apparent size in the present experiment indicate that spatialfrequency-contingent color aftereffects might not be as dependent on the similarities of the retinal parameters of adaptation and test gratings as simple edgedetection models would suggest. For example, at any given level of retinal spatial frequency of the experimental test stimuli, the spatial frequency of the grating in the lower region of the corridor array was identical to that of the grating in the upper region of the array, yet the neutral-point settings were systematically different for these two gratings. The inconsistency of the present results, as well as those of Mikaelian (1976) and Uhlarik et al. (1977), with previous findings on the contingencies of color aftereffects (e.g., Harris, 1970; McCollough, 1965) may be due to the unwarranted assumption that only retinal or apparent spatial parameters of stimuli can influence the nature and magnitude of the aftereffects. Taken together, the results of Harris (1970), of Jordan and Uhlarik (1982), and of the present experiment demonstrate that, under the appropriate conditions, retinal parameters, apparent parameters, or both are involved in the aftereffects, and support the notion that these contingencies need not be mutually exclusive. A similar statement, based on investigations of figural aftereffects, was made by McEwen (1959), who concluded that "both retinal and apparent sizes are effective, and experiments which pit them against one another prove only that there are conditions where the effect of one or other may be concealed" (p. 43). Therefore, the stimulus for the contingent color aftereffects cannot be described solely in terms of its retinal parameters. It follows that any description of color aftereffects based on selective chromatic adaptation of retinotopically organized cortical feature detectors is incomplete. REFERENCES
L., RAND, G., & RI'I'TLER, M. A screening test for defective red-green vision. Journal of the Optical Society ofAmerica, 1946,36,610-614. HARRIS, C. S. Effect of viewing distance on a color aftereffect specific to spatial frequency. Psychonomic Science, 1970, 21, 3S0. (Abstract) HARRIS, C. S. Insight or out of sight?: Two examples of perceptual plasticity in the human adult. In C. S. Harris (Ed.), Visual coding and adaptability. Hillsdale, N.J: Erlbaum, 1980. HUBEL, D. H., & WIESEL, T. N. Receptive fields, binocular interaction and functional architecture in the eat's visual cortex. Journal ofPhysiology, 1962,160, 106-1S4. HUBEL, D. H., & WIESEL, T. N. Receptive fields and functional architecture of monkey striate cortex. Journal of Physiology, 1968,195,21S-243. JORDAN, K., & UHLARIK, J. Color aftereffects contingent on perceived spatial frequency. Bulletin of the Psychonomic Society, 1982, 19,263-266. McCOLLOUGH, C. Color adaptation of edge-detectors in the human visual system. Science, 1965, 149, I11S-1116. HARDY,
424
JORDAN AND UHLARIK
McEwEN, P. Figural aftereffects, retinal size and apparent size. British Journal ofPsychology, 1959,50,41-47. MIKAELIAN, H. H. Plasticity of orientation specific chromatic aftereffects. Vision Research, 1976, 16,459-462. STROMEYER, C. F. Edge-contingent color aftereffects: Spatial frequency specificity. Vision Research, 1972, 12, 717-733. UHLARIK, J., PRINGLE, R., & BRIGELL, M. Color aftereffects contingent on perceptual organization. Perception & Psychophysics, 1977,22,506-510. WINER, B. J. Statistical principles in experimental design. New York: McGraw-HiJI, 1971.
NOTE I. Pilot work had indicated that observers began to fatigue after approximately 25 settings. It was decided to collect as many data as possible in the experimental condition, since the control, nocontext, condition was mainly a replication of Harris (1970; see also Harris, 1980). (Manuscript received August 25, 1982; revision accepted for publication January 21, 1983.)