alternative to batch production in a Controlled Ecological Life Support System. (CELSS). A study was conducted at John F. Kennedy Space Center (KSC).
NASA
Technical
Memorandum
TM
102784
Continuous Hydroponic Wheat Using A Recirculating System
Production
C. L. Mackowiak L. P. Owens C. R. Hinkle The
Bionetics
Corporation,
Kennedy
Space
Center,
and Research
Office,
Florida
R. O. Prince NASA
Biomedical
September
National Space John
Operations
1989
Aeronautics
and
Administration F. Kennedy
Space
Center
Kennedy
Space
Center,
Florida
TABLE
OF CONTENTS PAGE
SECTION TABLE
OF CONTENTS
ABSTRACT
....................................................................................................................
LIST OF TABLES
..........................................................................................................
LIST OF FIGURES
........................................................................................................
ACKNOWLEDGMENTS PRODUCT
...............................................................................................
Objectives
............................................................................................
vi
.....................................................................................................
.................................................................................................................
B. C.
Nutrient Nutrient
D. E. F.
Solution and Air Sampling ........................................................................... Seed Germination ......................................................................................... Harvests ...........................................................................................................
G.
Statistical
Solution Solution
Delivery System ............................................................. ............................................................................................
Analyses
.......................................................................................
III. RESULTS ................................................................................................................. A. Nutrition ........................................................................................................... B. Microflora ......................................................................................................... C. Harvests ........................................................................................................... Tissue
Analyses
iv
V
I1. MATERIALS AND METHODS .............................................................................. A. Environment ....................................................................................................
D.
III
..............................................................................................
DISCLAIMER
INTRODUCTION
,,°
.............................................................................................
1 4 4 4 4 5 11 11 12 12 13 13 28 30 31
IV. DISCUSSION .......................................................................................................... A. Nutrients .......................................................................................................... B. Harvest .............................................................................................................
40 4O 42
V. APPENDIX ............................................................................................................... VI. REFERENCES .........................................................................................................
45 47
ABSTRACT Continuous crop production, where plants of various ages are growing simultaneously in a single recirculating nutrient solution, is a possible alternative to batch production in a Controlled Ecological Life Support System (CELSS). A study was conducted at John F. Kennedy Space Center (KSC) where 8 trays (0.24 m2 per tray) of Triticum aestivum L. "Yecora Rojo" were grown simultaneously in a growth 1000 ppm CO2, continuous light,
chamber at 23oc, 65% relative with a continuous flow, thin film
humidity, nutrient
delivery system. The same modified Hoagland nutrient solution was recirculated through the plant trays from an 80 L reservoir throughout the study. It was maintained by periodic addition of water and nutrients based on chemical analyses of the solution. The study was conducted for 216 days, during which 24 trays of wheat were consecutvely planted (one every 9 days), 16 of which were grown to maturity and harvested. The remaining 8 trays were harvested on day
216.
Grain
yields
averaged
520 g m-2,
and had an average
edible
biomass of 32%. Consecutive yields were unaffected by nutrient solution age. It was concluded that continual wheat production will work in this system over an extended period of time. Certain micronutrient deficiencies and toxicities posed problems in this study and must be addressed in future continuous production systems.
LIST OF TABLES PAGE
TABLE 1 2 3 4 5 6 7 8 9 0 1 2 3
Comparison of Hydroponic Solutions........................................................... 3 Chamber and Environmental Parameters ................................................... 6 ExperimentalSolutionA.................................................................................. 9 Solution Electrical Conductivity/Elemental Correlations ........................... 15 Mass Balance Budget for Entire Study ......................................................... 19 Wheat Harvest Data Summary (per tray) ..................................................... 32 Wheat Harvest Data Summary Continued................................................... 33 Harvest Correlations of Wheat Trays at Maturity......................................... 34 Growth Data From Final Harvest (multiple ages)........................................ 35 Total Dry Matter From Final Harvest (multiple ages).................................. 35 Tissue ProximateAnalyses of Mature Wheat Plants.................................. 38 Tissue Proximate Analyses of Immature Wheat Plants ............................. 39 Comparison of Theoretical and Actual Nutrient Additions ........................ 42
iii
LIST OF FIGURES FIGURE 1 2 3 4 5 6 7 8 9 10 11 12 13 14 15 16 17 18 19 20 21 22 23 24 25 26 27 28 29 30 31
PAGE System Layout................................................................................. 7 Hydroponic Wheat Tray ................................................................. 8 Stand Pipe Level Indicator............................................................ 10 Solution pH...................................................................................... 14 ElectricalConductivity.................................................................... 14 Nitrate-nitrogenConcentrations................................................... 16 Nitrate-nitrogenAcumulations...................................................... 16 Phosphate-phosphorous Concentrations .................................. 18 Phosphate-phosphorous Acumulations ..................................... 18 Potassium Concentrations ............................................................20 Potassium Acumulations ...............................................................20 Calcium Concentrations ................................................................21 Calcium Acumulations ...................................................................21 MagnesiumConcentrations.......................................................... 22 MagnesiumAcumulations............................................................. 22 Iron Concentrations ........................................................................24 Iron Acumulations ........................................................................... 24 Manganese Concentrations .........................................................25 Manganese Acumulations ............................................................25 Copper Concentrations .................................................................26 Copper Acumulations ....................................................................26 Zinc Concentrations .......................................................................27 Zinc Acumulations .......................................................................... 27 Viable Counts of Total Microorganisms and Total Fungi in the Atmosphere of the EGC During the Continuous NFT Hydroponic Cultivation of Wheat................... 28 Viable Counts (nutrient agar) of Total Microorganisms in the NFT Nutrient Solution During the Continuous Hydroponic Cultivation of Wheat..................... 29 Daily Water Usage by the System............................................... 30 Leaf Area Ratio (LAR) Over Time................................................. 36 Single Plant Leaf Area Over Time ............................................... 36 Dry Weight Per Plant Over Time ..................................................37 Plant Height Over Time.................................................................. 37 Photosynthetic Energy Conversion Efficiency Over Time ....... 37
iv
ACKNOWLEDGMENTS This project was conducted under the direction of Dr. William M. Knott III, Biological Sciences Officer, Life Sciences Research Office, and Dr. Albert M. Koller, Jr., Chief Programs and Planning Office, Biomedical Operations and Research Office, John F. Kennedy Space Center under NASA Contract No. NAS10-10285. The authors gratefully acknowledge Dr. John C. Sager, NASA Biomedical Raymond M. Wheeler, of the following people, L. Englert for inorganic programming.
the valuble Operations
comments and suggestions and Research Office, and
of Dr.
The Bionetics Corp. We also appreciated the assistance Dr. Richard F. Strayer for microbial monitoring, Teresa chemical analyses, and Peter V. Chetirkin for computer
PRODUCT
DISCLAIMER
This report, in whole or in part, may not be used to state or imply the endorsement by NASA employees of a commercial product, process or used in any other manner that might mislead.
vi
or service,
I. INTRODUCTION The National Aeronautics and Space Administration (NASA) Controlled Ecological Life Support System (CELSS) Program is a long range program of research and engineering with a goal to understand how life can be maintained in autonomous systems during long duration spaceflights and extraterrestrial habitations. This program draws upon all aspects of the scientific community for information needed to accomplish a working CELSS. It includes the utilization of research data accumulated over the past twelve years by active NASNCELSS grant research efforts and the application of previous biological and physical data collected from various projects. MacElroy and Bredt (1984) described the components of a CELSS and discussed system control and bioregenerative life support in relation to reservoirs and buffers in a space environment. In a conceptual design option study of a CELSS, Oleson and Olson (1986) found that a volume of 56.9 m 3 per crew member will be required for growing crops, support equipment and access. Tibbitts and Alford (1982) compared the uses of various higher plants in a CELSS and developed a list of the most promising crop species. The CELSS Kennedy Space Center Breadboard Project (Biomedical Operations and Research Office, 1986) is designed to provide containment, hardware, subsystems, designs and cultural techniques for the production of biomass and oxygen, the preparation of food and the processing of wastes in a controlled, recycling system. The project as conceived, will test and operate a "breadboard" facility to accomplish proof-of-concept evaluation. It will characterize system operations, mass budgets and energy budgets. The biomass production component is currently receiving major effort in the CELSS Breadboard Project. A large sealed biomass production chamber (BPC) has been constructed to supply information on the following factors: - power requirements - space (area and volume) requirements - atmospheric environment and contaminant control - propagation methods - crop nutrition - delivery and maintenance of hydroponic solutions - root zone environment control - crop production management systems Many of these factors are presently under study. open loop at first, and in a more closed condition permit. The
first crop
to be grown
in the
BPC will be wheat.
The components will function in an as knowledge is gained and funds
There
is extensive
literature
on its
culture and nutritional composition. According to Hoff et al. (1982), it ranks high in both nutritional and cultural criteria in comparison with other conventional ci'ops. There has also been extensive environmental chamber work by Bugbee and Salisbury (1985a, 1985b, 1987a and 1987b) using wheat in hydroponic systems in the areas of photoperiodism, integrated photosynthetic photon flux (PPF) and temperature effects on yield.
Hydroponics is being used in the CELSS Breadboard Project to deliver nutrients to the roots of plants. Jones (1983) defines hydroponics as a nutrient solution delivery system which does not contain any organic or inorganic media for plant support. Hydroponics minimizes problems such as clogged irrigation nozzles, cleaning of culture media between crops and allows for more precise control of the root zone environment. The breadboard project is using nutrient film technique (NFT) for distribution of the nutrients to the crop. Not only does this minimize the total weight of the hydroponic system, the rapid flow of the solution over the roots and the increased surface area also circumvent the need to aerate the hydroponic solution. There are endless numbers of nutrient solutions and modified versions thereof, which have been published in the past 50 years. The University of California (Berkeley) agricultural experimental research station bulletin by Hoagland and Arnon (1938) is recognized as the basis for many formulations currently being used by investigators and commercial firms (Table 1). Depending on the species and environmental conditions, adjustments to the recipe are frequently made for improved growth. Fertilizer mixes, such as Peter's Hydrosol (1987) are commonly used in industry because they are ready-made. The slightly lower salt concentrations in Hydrosol also allow for nutrient manipulation as needed for the culture of a wide variety of plants. However, copper and zinc concentrations are well above the average found in many other nutrient solutions (Table 1). For reasons of quality control and the need to modify constituents, many researchers do not use commercial mixes. Bugbee and Salisbury (1985a) modified the Hoagland/Arnon formula to grow wheat hydroponically under high irradiance and elevated CO2 environments. The relatively low mobility of boron (Baker 1983), calcium and magnesium lead to an increasing of their concentrations in the nutrient solution (Table 1, Column 4). Lowering the phosphorous concentration allowed for an increase in iron uptake by the plants. Bugbee and Salisbury (1985a) added silica to their solution to minimize micronutrient toxicity symptoms. In addition, silica was added to their solution, in part, as a means to minimize micronutrient toxicity symptoms. Vlamis and Williams (1967) mention similar findings in work with other grasses. With these considerations, the breadboard project used a modified nutrient solution recipe following the macronutrient concentrations of Hoagland and Arnon (1938) and the micronutrient concentrations of Bugbee and Salisbury (1985a) Table 1, Column 5. System stability and efficiency are paramount in the functioning of a CELSS system. Continuous use of a recirculating nutrient solution would be an efficient approach and would promote system stability by avoiding large swings in nutrient uptake in response to plant age. In a study using models for a lunar life support ecosystem, Rummel and Volk (1986) concluded that a large number of small batch growouts, started at timely intervals can improve nutrient reservoir stability and CO,water condensate efficiencies. Unfortunately, published research is scarce concerning the effects of using a single nutrient solution with plants of different ages. Prince et al. (1981) successfully grew lettuce in a controlled environment on a continuous basis. However, they replaced the solution at weekly intervals rather than using the same nutrient solution over the course of the experiments. 2
Table
1.
Comparison
Hoagland #1 Element N
of Hydroponic
Peter's Hydrosol
Salisbury Bugbee
Solutions
Experimental Solution
(mM) 15.0
(mM) 3.6
(mM) 15.0
lmM) 15.0
P
1.0
1.5
0.2
1.0
K
6.0
5.4
3.0
6.0
Ca
5.0
*
12.0
5.0
Mg
2.0
1.3
4.0
2.0
S
2.0
1.2
2.0
2.0
(uM) 50.0
(uM) 100.0
(uM) 100.0
300.0
300.0
Fe
(uM) 50.0
Si
........
B
46.0
46,0
80.0
80.0
Mn
9.0
9.0
8.0
8.0
Zn
0.8
2.3
0.8
0.8
Cu
0.3
2.4
0.3
0.3
Mo
0.5
1.0
0.1
0.1
*Ca is added
separately
to desired
concentration
A
as Ca(NO3)2.
Continual reuse of the nutrient solution for cropping is an important means of conserving water in a CELSS since the treatment of spent nutrient solution would be costly in terms of equipment, energy and space. In a recirculating system, water and nutrients need to be replaced as they are removed by the crop but the reservoir volume and constituents should remain constant. As with multi-aged plant systems, there are few accounts in the literature concerning growth and yield effects of using continuously maintained nutrient solutions for successive, long-term cropping. Preliminary, unpublished Breadboard Project studies have found no significant differences in wheat yields when growing three consecutive batches on the same nutrient solution. Many of the Breadboard Project wheat studies have used elevated atmospheric 002 concentrations, i.e. >350 ppm, as a means to increase biomass production. Strain (1978) reported that CO 2 enrichment tends to increase lateral branching and increase 3
seed yield in wheat, while Sionit et al. (1981a) reported increased total dry weight, numbers of tillers and number of heads when CO2 was elevated from 350 ppm to 1000 ppm. In addition the weight and number of seeds grown with elevated CO2 concentrations were significantly greater. Sionit et al. (1981b) studied the effects of elevated CO2 at different levels of mineral nutrition. Wheat grown with 675 ppm CO2 continued increasing in seed weight and number as the Hoagland solution concentration was increased from 1/16 to 1/2 strength. However, no gain resulted in using Hoagland solution at the full strength concentration. In preparation for plant growth experiments inside the BPC, a study was conducted to determine if wheat could be grown hydroponically in a continuous mode of production using an elevated CO2 environment. A recirculating system containing a constant volume of solution, which would be maintained only through replenishment of nutrients and water, was also evaluated. The major objectives
of the study were: 1. Use a hydroponic NFT system to maintain a continuous production of wheat for 216 days (16 cycles). 2. Monitor and control biological conditions in order to determine effects of nutrient solution age on successive wheat yields. 3. Create a plant growth curve and determine water and nutrient budgets associated with the system.
I1.
MATERIALS
A.
Environment
AND
METHODS
A semi-dwarf cultivar of spring wheat (Triticum aestivum L.), 'Yecora Rojo', was used in the study. It is grown commercially in the San Joaquin and Imperial valleys of California and Qualset et al. (1985) mention its good protein content, good milling and excellent baking qualities. Bugbee and Salisbury (1985a, 1985b, 1987a and 1987b) used this cultivar in numerous CELSS related studies. Our study was conducted in a 1.8 m x 2.4 m walk-in growth chamber (EGC) 1. The radiation was provided by a combination of 30 Vitalite fluorescent lamps (F96T12/Vitalite/1500) 2 and 16 standard, frosted incandescent bulbs (60 watt). The atmospheric CO 2 was monitored and controlled at 1000 I_mol mo1-1 using an ANARAD (AR 500) infrared gas system 3. Growth chamber conditions are given (Table 2). B.
Nutrient
Solution
Solution was delivered pumps 4, one for each trapezoidal-shaped reservoir, through
Delivery
System
from a single reservoir utilizing two submersible, centrifugal side of the chamber. Each pump delivered solution to four
PVC trays (51 mm deep). Solution was pumped from the a 64 I_M filter via 1.3 cm ID CPVC pipe, to a manifold which
1Environmental Growth Chambers, Chagrin Falls, OH 2Durotest, North Bergin, NJ 3ANARAD, San Diego, CA 4Dayton Electric Mfg. Co., Chicago, IL
4
distributed flow to the four trays (Fig 1). From the manifold it passed through a valve mounted at the front of each tray, then to an emitter mounted inside the back of each tray. Each emiter consisted of a 1.3 cm ID CPVC pipe with a series of 0.2 cm holes along its length and a cap at the end (Fig 2). The solution entered the tray via these holes and flowed by gravity at a rate of 1.0 L min-1to a drain at the other end of the tray, exited and returned to the reservoir via a 2.5 cm ID PVC pipe. The plant support tops were constructed from extruded "tee" strips of PVC with black/white polyethylene wings (Fig 2). Cages constructed of black plastic netting stretched across a white PVC framework, provided vertical support for the growing plants (Fig 1). C. Nutrient Solution The experimental solution "A" used in this study was a combination of Hoagland's macronutrient concentrations and Salisbury/Bugbee micronutrient concentrations (Table 1). Nutrients were added to the reservoir every three days from stock bottles containing 1M concentrations of the various salts. The replacement of nutrients to the reservoir was based on the estimated millimoles of each nutrient depleted per liter of water used in the system over each 3-day period (Table 3). Iron chelates (Fe-HEDTA and Fe-EDDHA) and the other micronutrients were added at full strength concentrations every 14 days. The estimated daily depletion values of the nutrients were calculated from the solution chemical analysis of wheat grow-out studies done previously for the breadboard project. Concentrations of Mo, B, Si and S were not determined. Ongoing chemical analysis of the solution and general crop appearance were the basis for nutrient adjustments in this study. A chronological listing of the adjustments is given in the Appendix. Control of the solution pH (between 5.5-6.0 units) was automated using a pH controller and 10% (v/v) nitric acid. Daily monitoring of the solution's temperature and the dissolved oxygen (for the first 50 days of the experiment) presented variations of less than 10% per week. It was decided to continue recording these values at weekly intervals, rather than daily. The level of nutrient solution in the reservoir was monitored by using a stand pipe level indicator (transparent siphon tube, Fig 3). The solution volume was maintained by daily addition of deionized water to a predetermined mark on the level indicator. D. Solution and Air Sampling Samples of the nutrient solution were collected for inorganic chemical analyses and bacterial counts. For the chemical analyses, three (125-ml) replicates of nutrient solution were removed from the reservoir prior to and following each replenishing exercise (every three days). Analytic methods were as follows: Parameter
Method
NO3-N, NO2-N pH Conductivity P, K, Ca, Mg, Fe, Cu, B, Mn, Zn
Automated colorimetry Potentiometry Conductimetry Atomic absorption/emission spectrophoto metry
5
Table 2.
Chamber
and Environmental
Chamber
Reading
Parameter
(range)
PPF (umol
Monitor/Control
250
manual
Parameters
Frequency monthly
m-2 s-1 )
Sou rce
i ncandesce fluorescent
Photoperiod
nt
24
automated
1. min-1
23
automated
1- min-1
65
automated
1-rain-1
1000
automated
0.8
manual
5.8
automated
23
manual
Conductivity (umhos cm-1 )
2000
manual
Dissolved
6 - 8
manual
1. week-1
4.17
manual
2 • month-1
(hr) Temperature
(oc) Relative
humidity
(%) Carbon
dioxide
(umol
mol-1 )
1.4
rain-1
Air velocity (m sec-1)
Day
1
SOLUTION PARAMETER pH Temperature (oC)
02
continuous
1. week-1 1.3
days-1
(ppm) Flow
rate
(L m-2 min-1)
6
" "L PAGE IS ORIG;N_-, OF POOR QUALITY ....JI ./
,1 I
I'-,
0 >,, 0
I,IJ I-, >.
m
C,
f
FIG
2.
HYDROPONIC
WHEAT
TRAY
PLEXIGLASS
_""_
SEED
NYLON
SCREEN
(GLUED
INSIDE)
COVER
HOLDER-
SEED
PLASTIC SHEETS PLEXIGLASS
MIL (2)
TRAY EDGE
CLIP
\
_""_
NUTRIENT
DELIVERY
(9 HOLES)
PVC
FROM
RESERVOIR
(WATER TO PUMP AND
RESERVOIR
NUTRIENT
AND SOLUTION)
Table
3.
Experimental
Solution
A
desired concentration element
in
solution
estimated
(mM)
daily
(mmol/L
water)
N P K Ca
15.0 1.0 6.0 5.0
4.50 1.00 2.50 1.00
Mg S
2.0 2.0
0.38 0.38
(IIM) 100.0 300.0 80.0 8.0 0.8 0.3 0.1
Fe Si *B *Mn *Zn *Cu *Mo * Added
as full strength
concentrations
(l_mol/L water) 25.00 90.00 5.70 0.57 0.06 0.02 0.04 every
14 days.
use
Fig
3.
STAND
PIPE
10
LEVEL
INDICATOR
The nutrient delivery system's filters had mesh covered cores, which were cleaned every four weeks. The cores were rinsed with deionized water, to remove particulate matter, before being placed back into the filter bodies. For determination of total viable bacterial counts, the solution was sampled twice a week. A sterile 10 ml test tube was aseptically filled with 5 ml of nutrient solution directly from the reservoir. The sampling procedure entailed three replicates. Serial (ten-fold) dilutions were made into sterile isotonic (phosphate-buffered) saline solution. Subsamples (0.1 ml) of appropriate dilutions were spread onto nutrient agar media for enumeration. Viable counts were made after two to four days of incubation at 28oC. Counts were expressed as colony forming units (CFU) per ml. Atmospheric sampling for bacterial and fungal counts was performed twice per week. A Matson-Garvin slit-to-air (STA) sampler was used to collect air samples directly onto the surface of trypticase soy (TSA), for total viable microorganisms and inhibitory mold (IMA) for total viable fungi agar media. Flow rate of the sampling device was 1 ft 3 min -1. The sampling period lasted five minutes, in which E.
time
Seed
three
replicates
were
collected.
Germination
Four days prior to planting, 'Yecora Rojo' wheat seed were surface sterilized for 15 minutes in a 3000 ppm formalin solution as suggested by Smilanski (1986). The seeds were then cold treated (4 days at 6oC) before planting 350 onto a tray top. The planted tray top was placed into the chamber (position #1, Fig 1 ) and attached to the nutrient delivery system. Two liters of solution were placed in the tray bottom, where it remained for six days. Trays were covered with germination hoods constructed of 0.25 inch white plexiglass. Each hood was 1" deep and had a lip running around the perimeter to overlap the tray bottom (Fig 2). The inside surface was covered by a layer of fiberglass screen. Both seeds and screen were sprayed with deionized water prior to placing the hood on the tray. On Day 4 the germination hood was removed and germination counts recorded. On Day 6 the recirculating solution was started through the tray at 1 L min °1. A support cage was placed on the tray two weeks after planting (Fig 1). A new tray was prepared every nine days in the same manner described above until all eight positions were filled. F. Harvests Harvesting of a tray occurred on Day 72 and every nine days thereafter, (-+ 3 days ). At harvest the solution flow to the tray was turned off. The tray was removed from the chamber. After measuring the canopy height, the root mat was cut off the stems and the number of plants counted. Statistically determined variance from previous "in-house' wheat studies warranted the use of 67% of the plants per tray as a representive tray sample size. The following items were determined from each harvest: -
number number number number
of of of of
primary heads nonprimary heads spikelets per head seeds per head
- seed and straw fresh weights - seed, straw and root dry weights 11
Seed number and dry weights were calculated by taking two 5-gram samples, counting the number of seeds in the samples, drying them at 60oC for 48 hours and reweighing them. All other harvest data were extrapolated from the above values. Individual 100-gram (dried tissue) samples of seed, straw and roots were analyzed by a certified commercial laboratory. The laboratory has approved methods of analysis specified by agencies such as: AOAC, USDA, USP, FDA, NF, EPA, AOCS and AACC. The seeds were analyzed for K, Ca, Mg, Fe, S, P, Cu, Mn, Zn, water soluble vitamins, sugar, amino acids and fiber. Proximate analyses, which included protein, moisture, fat, ash, fiber, carbohydrate and calories were performed on the seeds, straw and roots. The straw and roots were also analyzed for the same elements. Protein was calculated as N x 6.25. Carbohydrates were figured by subtraction. On the last day of the experiment (Day 216) all of the trays were removed from the chamber. Prior to their removal, light photosynthetically activated radiation (PAR) measurments were recorded at canopy level and below the canopy of each tray. The oldest tray (63 days) was harvested in the same manner as the previous trays. In order to harvest all eight trays in a single day, 20% samples were taken rather than 67%. In addition to the aforementioned data, the immature plants had the following data collected; - individual plant height - number of tillers - leaf area G. Statistical
Analysis
Descriptive statistics were calculated with the STAT80 Interactive Statistics Package s . A correlation analysis was performed to test for linear correlation between conductivity and nutrient concentration and Pearson product moment correlation coefficients and t-statistics calculated. A correlation analysis was also run to test for linear correlation between the various harvest parameters. Correlations between water use/conductivity and water use/nutrient use, were also analyzed, although not presented here. Linear regression analyses were run on growth data and confidence bands determined. Linear curves were plotted with Grafit/1000, a graph generation package s . III. RESULTS The results have been separated into phases. Phase I covers the experimental startup (0-72 days), during which time the system was being filled with a seeded tray every nine days until all tray positions were filled. Phase II covers days 73-144, when continuous seeding and harvest (every nine days) occurred. Phase III (145-216 days), was when major changes occurred in the replenishment of Mn, due to the appearance of injury symptoms on the leaves. Phases II and III had some differences in the replenishment of other salts as well. Information concerning nutrient solution constituents, evapotranspiration, plant growth, harvests and tissue analyses is addressed in this section. A. Nutrition
5 Statware 6 Graphic
Inc. Salt Lake City, UT User System,
Inc., Santa
Clara,
CA
12
analyses of the nutrient solution. The 'loss' values were calculated by subtracting the nutrient concentration just prior to replenishment from the nutrient concentration right after the previous replenishment (3 days before). The 'accumulation' values were calculated by subtracting the nutrient concentration just prior to replenishment from the nutrient concentration right after replenishment of that same day. pH The pH controllers kept the pH relatively uniform throughout the entire study. Values recorded daily from the pH controller were closer to the optimum (5.8) than were the values received from the chemistry support laboratory's analyses of the nutrient solution (Fig 4). Conductivity The nutrient solution conductivity was maintained at 2000 _mhos cm -1 throughout the study (Fig 5). Most of the variation was during Phase I, when the system's biomass was increasing. The conductivity correlated best with NO3-N and Ca (CaNO3) 2 concentrations (Table 4). Nitrate-nitrogen Nitrate-nitrogen concentrations fluctuated during Phase I, while the system was gaining biomass (Fig 6). Nitrate was added in the form of nitric acid (HNO3) for pH maintenance, however the amount added in this manner was negligible in relation to the concentration of NO3-N added during replenishments. Although the NO3-N concentration was usually below the desired concentration, it was not considered to affect the plant growth. From looking at the overlapping accumulation and loss data points (Fig 7), the system removed all of the NO3-N that was added as replenishment. A total of 129.11 g of NO3-N removed from the system.
was supplied
during
the study,
with
112.39
g (87%)
being
Phosphate-phosphorous Beginning through reduced (Fig 8).
on Day 40, there
was
a rise in the PO4-P
concentration
which
continued
Phase II (120 mg L -1 by day 160). At Day 166, the PO4-P replenishment was by a third (Appendix), which reduced the solution concentration to 26 mg L -1 As shown in Figure 10, the plants removed all of the PO4-P available to them
until Day 60 and also after Day 190. A total of 75.96 g of PO4-P was added to the nutrient solution. Cumulative loss of PO4-P amounted to 74.12 g (98%, Table 5).
13
Fig
4.
SOLUTION
pH
_ •-0--
D,MLY pH L,m pH
7.5 PHASE I
PHASE
II
PHASE III
7
m
I
6.5
b
.
6 -r_
'_
mA'k_,
(
"--,
"_
=
,_
5
4.5
"
[
4. 0
20
I
40
I
60 Fig
5.
80
I
I
I
I
I
1 O0
120
140
160
180
ELECTRICAL
I
200
220
CONDUCTIVITY -4t--/M='I'ER REPLENISHMENT --O-BEFORE REPLENISHMENT
2700
2400
_
PHASE I
_
I _1_
LPHASE
II
PHASE Iii
1200
-
9006003000
,
0
I
20
I
40
I
60
!
I
I
I
I
I
80
1O0
120
140
160
180
TIME (DAYS) 14
I
200
220
Table
4. Solution
Electrical
*P-values
(2-tailed
Electrical
Conductivity/Elemental
Conductivity Versus
Correlations*
r
NO3-N
0.89
PO4-P
0.32
K
0.43
Ca
0.77
Mg
0.72
Fe
0.71
Mn
0.70
Cu
0.70
Zn
0.70
test)
were
less than
0.01.
15
Fig
6.
NITRATE-NITROGEN
CONCENTRATIONS
AFTER REPLENISHMENT --_
BEFORE REPLENISHMENT
300 275
-
PHASE I
g_
PHASE
II
PHASE
Iii
-
25O
1,50 :_
Z
125
75 5O 25 I
0 0
20 FIG
I
I
I
4O
60
80
7.
I
I
1 O0
120
NITRATE-NITROGEN
,
I
I
I
14.0
160
180
[
200
22O
ACCUMULATIONS --0-
ACCUMULATION
-O-LOSS
1.6E05 PHASE I
1.44E05
PHASE
II
PHASE
III
1.2BE05 1.12E05
E z
9.e o4 8F.04
I 0 Z
4.8F.04 3.2E04 1.6F.04 0 I
0
20
4o
60
80
1O0
120
TildE (:DAYS) 16
140
160
180
I 200
I 220
Potassium The preferred K concentration for this experiment was 234 mg L -1. During Phase I, replenishment of K was too low and resulted in a rapid decrease in solution concentration within the first 40 days (Fig 10). On Day 49, K replenishment increased by 11% (Appendix). Peak concentrations of 319 mg L -1 and 292 mg L -1 occurred on days 64 and 151, respectively. During Phase II and the early part of Phase III large amounts of K were depleted from the solution between replenishment days. After Day 170, the concentration declined once again because of a reduction in the replenishing solution (Appendix). Throughout the entire study, 285.61 g of K were added and 273.19 g (96%) were removed (Table 5). Between Days 20 and 60 not all available K was used (Fig 11 ). For the remainder of the study, the loss was equal to the accumulation curve. The K concentration had a positive correlation with conductivity (Table 4). Calcium Beginning on Day-30, Ca increased from a baseline value of 200 mg L -1 to 300 mg L -1 by day 64 (Fig 12). The replenishment was adjusted frequently to obtain proper concentrations by day 100 (Appendix). Calcium remained near the desired concentration during Phased III (Fig 12). Looking at Figure 13, Ca depletion seemed to have been a function of how much was available, since the system never removed all that was put back by replenishment. The nutrient solution always had more Ca than was removed from the solution. A total of 105.99 g of Ca were added to the solution over time, while 89.67 g (85%) were used (Table 5). The Ca solution concentration had a positive correlation with the conductivity (Table 4). Magnesium The Mg concentration was to be maintained at 49 mg L °1. Figure 14 shows Mg was below the desired level for most of Phase I. Beginning at Day 70, it increased to levels above the baseline during Phase II and remained between 55 and 65 mg L -1 for the remainder of the study. The replenishment concentration was not altered until the last 10 days of the study (Appendix). Uptake of Mg appears to be a function of availability (Fig 15). A total of 27.81 g of Mg was put in to the solution with 23.82 g (86%) being depleted (Table 5). Mg concentration had a positive correlation with the solution conductivity (Table 4). Iron Fe concentrations in the nutrient solution were to be kept at 5.6 mg L -1. Figure 16 shows Fe starting out low and decreasing through Phase I, until Day 90. An increase in the replenisment of chelated Fe-EDDHA and Fe-HEDTA during Phases II and III (Appendix), brought levels closer to the baseline. There were excessive amounts of Fe at times during Phases II and III on days that chelators were added in place of FeCI.. The accumulation and loss curves are fairly equivalent (Fig 17), which implies that the wheat used much of the Fe that was in the solution. A total of 5.75 g was put into the nutrient reservoir while 5.27 g (92%) was depleted (Table 5). The Fe concentration correlated with the solution conductivity (Table 4).
17
Fig
8.
PHOSPHATE-PHOSPHOROUS
CONCENTRATIONS --41-- AFTER REPLENISHMENT --O-- BEFORE REPLENISHMENT
140 PHASE i
PHASE II
PHASE III
120
_,j
8o 8o
0
I
0
20
Fig 9.
I
40
I
60
I
80
I
I
I
I
I
I
100
120
140
1 60
180
200
PHOSPHATE-PHOSPHOROUS
22O
ACCUMULATIONS --'0- ACCUMUI.ATION --O--LOSS
8E04.
PHASE I
PHASE II
PHASE III
7,2E04. 6.4.E04, ,_.
5.6E04.
E +.a_+ o.. I O
4,E04. 3.2E04. 2.4.E04. 1.6E04. 8OOO 0 0
20
40
60
80
1O0
120
TIME (DAYS) 18
140
160
180
200
220
Table
5.
Mass
Amount Nutrient
Total Total
Added
Budget
Amount Removed
4
For
4
Entire
Study
Amount in Plant Tissue 5
(g)
(g)
(g)
P
75.96
74.12
78.09
K
285.61
273.19
319.63
Ca
105.99
89.67
80.86
Mg
27.81
23.82
24.02
Fe
5.75
5.27
5.71
Mn
0.91
0.90
0.76
Cu
0.013
0.013
0.290*
Zn
0.065
0.066
0.241 *
biomass (dry matter) water evapotranspirated
*Excess
Balance
in plant
tissue
may
produced = 8.44 = 2430 L have
been
kg
due to contamination
4 Analyzed by "in-house" laboratory, The Bionetics Corp., KSC, FL. 5 Analyzed by Nutrition International, East Brunswick, NJ. 19
by chamber
humidifiers.
Fig
10.
POTASSIUM
CONCENTRATIONS -O---O-
AFTER REPLENISHMENT BET'OREREPLENISHMENT
4OO PHASE I 350
PHASE
II
PHASE III
-
200 v _o
_
10050
_
l
O
I
0
20
_'_-
40
80 Fig
11.
80
I
1
100
120
POTASSIUM
I
1 40
160
180
200
220
ACCUMULATIONS --.e--
ACCUMULATION
-O-lOSS
3E05
PHASE
I
PHASE
II
PHASE
III
2.7E05 2-4E05 2.1 E05 _'_
OD
1.8F.05
E 1.,._EOS v
1.2E05 9E04 8E04. 3F.04. 0 0
20
40
80
80
100 TIME
120 (DAYS) 20
140
180
180
200
220
Fig. 12.
CALCIUM
CONCENTRATIONS
AFTER --CP-
REPLENISHMENT
BEFORE
REPLENISHMENT
4,5O PHASE I
400-
PHASE II
PHASE Iil
,_, 3oo '_
250
,=_/_
vE 200 o (")
_-
150
- _
a
"
"
-
100 50
_-
0 0
!
I
I
I
!
I
I
I
I
20
40
60
80
100
120
1 40
160
180
Fig
13.
CALCIUM
I
200
220
ACCUMULATIONS ACCUMUtATi0N
-O-LOSS
1.22E05 PHASE
I
PHASE
II
PHASE
III
1.098E05 9.76E04.
oD
E 0 0
8.54E04
m
7.32E04.
m
6.1E04,
m
4.88E04
m
3.66E04
m
2.4.4,1104.
I
1.22E04. 0 I
0
2o
40
60
80
1O0 TIME 21
120 (DAYS)
140
I
I
I
i
160
180
200
220
Fig 14.
MAGNESIUM CONCENTRATIONS AFTER --O--
REPLENISHMENT
BEFORE
REPLENISHMENT
90 PHASE I
8O
PHASE
II
PHASE
III
7O ,_, so
@
3o
,,
20 10
a
0 0
I
I
i
I
I
I
I
I
I
20
40
60
80
1 O0
120
140
160
180
Fig
15.
MAGNESIUM
I
200
ACCUMULATIONS ACCUMULA'II_I
--O-L0SS
3.8E04
PHASE I
PHASE II
3.3F._ 3E_ 2.7E04 2.4EO, t OD 2.1E04 v
E
1.8E04.
(-_ 1.5E04 1.2E04, 9O0O 6000 3O0O m
i
0
2O
TIME (DAYS) 22
PHASE Iil
220
Manganese The Mn concentration in the nutrient solution should have remained near 0.4 mg L-1. Figure 18 shows it starting out low and dropping to 0 mg L-1. The Mn was brought up to 0.55 mg L-1 by replenishing often with MnSO4 (Appendix). For the remainder of Phase II and the first half of Phase III, Mn concentrations (prior to replenishments) were below detection limits. As can be seen in Figure 19, the wheat used all of the Mn available in the solution. From a total of 0.91 g of Mn added to the solution, 0.90 g (99%) were removed (Table 5). The Mn concentration correlated with the conductivity (Table 4). Copper The baseline Cu concentration in the nurient solution should have been 0.02 mg L-1. Cu levels started out three times higher than baseline and remained that way through most of Phase I (Fig. 20). After Day 60, Cu fluctuated near 0.02 mg L-1during Phases II and !11when the system's biomass remained the greatest (Fig. 21). During Phases II and III the solution lost the amounts of Cu that were added through replenishment. Approximately 0.013 g of Cu was added during the study while 0.012 g (94%) were removed (Table 5). The concentration of Cu in solution correlated with the conductivity (Table 4). Zinc The desired concentration of Zn in the nutrient solution was 0.05 mg L-1. It began at 0.11 mg L-_ but declined through Phase I (Fig 22) and remained between 0.001 and 0.01 mg L-_until Day 85. The Zn concentration reached baseline on Day 49 and exceeded it for about 20 days (Day 94-115), due to micronutrient replenishment (Appendix). For the remainder of the grow-out, Zn reached baseline after replenishment and rapidly dropped prior to each new replenishment. Concentrations were below the baseline during much of Phase III. According to Figure 23, the replenished Zn was completely removed from the nutrient solution. The data show that 0.065 B.
g were
added
while
0.066
g (101%)
were
depleted
(Table
5).
Microflora
Viable counts of airborne fungi and total microorganisms (predominantly bacteria) shown in Fig. 24. The total microbial counts were always higher than the fungal counts, and underwent sporadic fluctuations. The range in total counts was similar
are to
counts in EGC chambers during batch growth of wheat (unpublished data). The fungal counts appeared to increase between days 110 and ca. 145. The reason for this nearly four-fold rise or the subsequent decrease are unknown. In past EGC experiments, the growth chamber humidifier was identified as a source for total viable counts in the early stages of wheat seedling growth, before crop evapotranspiration lead to the humidity control system being dominated by dehumidification instead of humidification. This effect was not observed in this experiment, but the cause (presumably, a microbiologically clean water supply for the system humidifier) has little to do with whether the wheat was grown in batch or continuous culture. 23
Fig
16.
IRON
CONCENTRATIONS
AFTER REPt.EN_dENT
-0-
aEFORE REPLEN_HME_rr
10 .
9
PHASE
I
PHASE II
PHASE
III
8 7
,.= 4
-
3 2 1 !
0 0
20
40
60 Fig
80 17.
1O0 IRON
120
1 40
160
180
200
220
ACCUMULATIONS --0-
,¢CUMU_TION
-O--LOSS
6OOO
PHASE I
PHASE: II
55OO
PHASE III
5OOO 4,5OO 4OOO OD 3500
E
v3000 e2500
I,i.
20OO 1500 1000 5oo 0 I 40
I 60
80
100
TIME
120
(:DAYS:) 24
I 140
160
180
200
220
Fig 18.
MANGANESE
CONCENTRATIONS -.0- AF'I1ER REIII.ENISHMI_cr --O.- BIOFORE RI_L.B,e_.t_IEN'r
1.2
PHASE I
PHASE
II
1O0
120
PHASE III
m
.2
0 0
2O
40 Fig
t50 19.
80
MANGANESE
140
180
180
200
ACCUMULATIONS -,0-/¢CUMUIAllON --O--LOSS
PHASE I
1000
PHASE II
PHASE lU
9OO 8OO 700 OD 600
E v ¢: "_
,500 400300200
-
100
-
0 0
20
40
60
80
100 TIME 25
120 (DAYS)
140
160
180
220
Fig 20.
COPPER CONCENTRATIONS •--t,---_
AFTER REPLENISHMENT BEFORE REPLENISHMENT
.12 PHASE
I
PHASE II
PHASE III
.1
.o8 ,EE .06
.04
.02
0 0
I
I
I
I
20
40
60
80
Fig
21.
I
1O0
COPPER
I
120
I
140
I
I
160
180
I
200
220
ACCUMULATIONS --0-- ACCUMULATION --O--LOSS
18
PHASE I
PHASE II
PHASE III
14 12
g, . 4 2 0
0
I 20
I 40
I 60
I 80
I 100
TIME 26
I 120
(DAYS)
I 140
I 160
I 180
I 200
220
Fig
22.
ZINC
CONCENTRATIONS AFTER REPLENISHMENT BEFORE REPLENISHMENT
.12 III
PHASE
I
PHASE
II
PHASE
III
.I -
_
.08
)
0
20
40
60 Fig
80 23.
1O0
ZINC
120
140
1 60
180
200
220
ACCUMULATIONS ACCUMULATION
--O--LOSS
8O
PHASE
I
PHASE II
PHASE
III
70 6O _50 O_
E
v40 c
N
3O 20 10 0 I
0
20
I
40
60
80
1O0
120
TIME (DAYS) 27
140
160
!
!
180
200
220
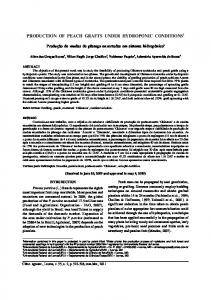
Figure 24. Viable counts of total microorganisms (TSA mean) and total fungi (IMA mean) in the atmosphere of the EGC during the continuous NFT hydroponic cultivation of wheat (Triticum aestivum cv Yecora rojo).
8O IMA mean ----e.---
TSA mean
60
40
2O
0
I
0
100
200
DAYS
The viable counts of total microorganisms in the nutrient solution are presented in Fig 25. Both the low numbers (2 x 10⁴ to 2 x 10 s per mL) and the fluctuations in counts also were observed in other experiments when wheat was grown in batch culture. The enumeration of microorganisms during hydroponic growth of wheat in either batch or coninuous culture has not appeared in the literature, thus comparisons cannot be made. The low values for total counts (ca 105 per mL) indicates the relative unimportance of the solution microbial community in relation to key ecological functions. In general, at least 106 per mL would be needed for any individual microbial species to have a significant impact on functions such as the carbon and nitrogen cycles in solution. The relative constancy of microbial numbers over such a long time is surprising, and suggests that the sources--i.e., root sloughing hardware biofilm sloughing, filter sloughing, and growth--and sinks--i.e., removal by root mats and filters, attachment to inert surfaces, and death--for the solution microbial community are in equilibrium. A complication to this interpretation is that root mats, containing roughly 2 x 10 lo per mL bacteria, were removed from the system at each tray harvest, about every nine days.
28
Figure solution (_
25. Viable counts (nutrient agar) during the continuous hydroponic aestivum cv Yecora rojo).
of total microorganisms cultivation of wheat
in the
10 6
.-I
E
lOS
I
I,I.
10 4 ,
!
0
!
100 DAYS
29
200
NFT
nutrient
Fig
26.
DALLY
WATER
USAGE
BY
THE
SYSTEM
2O 18 t
0
16
0 /
A
14 12
,.I v
I,U ¢/)
0 %00
]
1
3=
6 4
0
0
0
0 O0
O0
0
o
oo
0"
0
00
0
0 0
_
o
,,
0
000
00
0
0
o(_
]
..
00
0
8 I,U I-
0 0
000
o --ecPoO
o
10 J
0
0
o
°
0 000
o
-Io oO 2 0
•
0
|
20
"
I
40
"
I
60
"
I
80
"
I
100 AGE
Mass
Balance
"
I
120
"
I
140
"
I
160
"
I
180
"
|
"
200
220
(days)
Budget
Table 5 summarizes quantities of nutrient elements added to and removed from the solution, and those found in the plant tissue. Nitrogen is not included because it was analyzed for as NO3-N in the solution and TKN in the plant tissue. High values for Cu and Zn in the plant tissue are shown. Other discrepancies concerning the quantities of nutrients found in plant tissue and amounts removed from solution are within the range of experimental and analytical error (approximately 15%). C.
Harvests
Harvest data are summarized in Tables 6 and 7. The edible biomass calculated as seed dry weight/total biomass dry weight. The volume
index (EBI), was calculations were
based on a tray area of 0.24 m 2 and a mean plant height of 0.514 m. The trays were variable in number of plants, yield and the EBI. Average yields for trays 1 through 16 (throughout the study) were 520 g m -2 of seed (dry matter), 1546 g m -2 total plant dry matter and an edible index of 32.4% (Table 6 and 7). Heights averaged 514 mm and plants averaged 1.6 heads per plant with 14 spiklets and 9 seeds per head (Table 6). Non-primary heads were included in the spikelet and seed values• Correlation analyses performed on the harvest data are summarized in Table 8. There were positive correlations in all categories except mass per seed versus total heads and the ratio of non-primary/primary heads versus mass per seed and total seed number. There were also negative correlations between percent root dry matter (DM) with various above-ground parameters (Table 8). The last day harvest data are presented in Tables 9 and 10. No seed yield data were collected on the last day harvest since the wheat heads were not mature. Data collected from immature plants showed less 30
percent root (DM) once tillers and heads began appearing (Table 9). Total dry weight increased substantially during this time (Table 10). Growth curves were developed from the dry weight, plant height and leaf area data that were collected from the harvest of seven trays of wheat at the conclusion of the experiment (Figs 27-31). Each tray was a different age. Figure 27 shows the relationship between plant age and leaf area ratio (LAR). The LAR was calculated with the following equation: LA/total DM, where LA = leaf area. A polynomial equation was used to describe the relationship between age and leaf area (Fig 28). Linear regression equations were developed for the growth curves using dry weight (Fig 29) and plant height (Fig 30) data. These curves were graphed with a 95% confidence interval. The photosynthetic energy conversion efficiency is depicted graphically over time (Fig 31) from the following equation: energy in the total biomass (KJ m-2d-1) divided by energy in the PPF (KJ m-2d-l). D Tissue Analyses The results from the nutritional proximate and mineral analyses performed on the mature wheat tissue (trays 1-16) are given in Table 11. Samples from several trays were combined for analyses. Proximate analyses were also performed on immature wheat plants (Table 12). Plants in trays 17 through 21 ranged in age from 37 to 63 days at time of harvest, while plants in trays 22 through 24 were between 9 and 27 days old. Percent protein was calculated as N x 6.25. The highest protein values were in the roots of all ages and in the straw of plants younger than 28 days. The highest carbohydrate levels were obtained from the seeds of mature plants, 63.1% by weight (Table 11 and 12). Fat levels were generally low in all tissues (less than 5%), while crude fiber was highest in the straw component.
31
Table
6.
Wheat
Harvest
Data Summary
(per tray)
Age (days)
Height (mm)
Total Plants
Total Heads
Total Splkelets
Total Seeds
Total Seed Mass (g)
1" 2* 3 4 *^ 5* 6^ 7^ 8"* 9 10 11 12 13 14 15 16
75 73 72 71 71 72 72 72 73 72 72 71 72 72 72 73
521 521 559 560 508 406 451 508 559 559 508 533 483 510 510 530
226 260 300 258 290 296 299 278 216 261 281 299 230 265 287 282
402 394 436 359 403 615 561 480 372 397 391 383 488 358 400 340
5591 5970 6906 4452 5538 7868 6797 5494 5329 6055 6455 6193 4907 5605 5871 3398
3819 5486 6731 3044 4524 2782 1226 4114 4632 5481 5030 3827 3151 2968 3530 2538
138.68 192.41 236.59 103.48 144.49 49.55 35.86 136.09 111.16 169.81 146.65 121.17 94.82 99.20 122.80 78.46
414 467 623 298 442 289 451 344 330 419 380 366 260 421 354 298
average STD
72 1
514 41
271 27
424 76
5777 1033
3930 1 362
123.83 50.46
371
Tray (#)
*Water
stress
*Micronutrient
stress
(particularly
Mn)
32
Total Biomass (g)
96
Table
7.
Wheat
Harvest
Data
Tray (#)
Nonprimary + Primary Heads * (#)
Seeds per Plant (g)
Mass per Seed (g)
Seed Mass per Plant (g)
1 2 3 4 5 6 7 8 9 10 11 12 13 14 15 16
0.78 0.52 0.45 0.39 0.39 1.08 0.88 0.73 0.72 0.52 0.39 0.28 1.12 0.35 0.39 0.21
16.9 21.1 22.6 11.8 15.6 9.4 4.1 14.8 14.2 21.0 17.9 12.8 13.7 11.2 12.3 9.0
0.036 0.035 0.035 0.034 0.032 0.018 0.029 0.033 0.024 0.031 0.029 0.032 0.030 0.033 0.035 0.031
0.61 0.74 0.79 0.40 0.50 0.17 0.12 0.49 0.34 0.65 0.52 0.41 0.41 0.37 0.43 0.28
average
0.58
14.3
0.031
0.45
*Total number of nonprimary ^Edible biomass index (seed
Summary
Seed Mass per m 2 (g)
Continued
Seed Mass per m 3 (g)
Root Total (% dwt)
EBI (%)^
583 808 994 435 607 208 151 572 467 713 616 509 398 417 516 330
1107 1535 1888 826 1153 395 286 1 086 887 1355 1170 967 757 792 980 626
12 8 6 9 9 10 11 8 8 7 6 8 9 11 9 8
34 41 38 35 33 17 16 40 34 41 37 33 36 23 35 26
532
988
9
32
heads + by the total number of primary dry matter + by the total dry matter)
33
heads
Table
8.
Harvest
Correlations
of Wheat
Trays
at Maturity
Correlation Coefficient VARIABLE mass/seed
plant
Df
(r)
P-value
vs
height
primary seed
PAIRS
head
#
14
-0.57
0.02
plant
height
14
0.55
0.03
seed seed
# mass
14 14
0.58 0.63
0.02 0.01
seed seed EBI
#/pit mass/pit
14 14 14
0.63 0.60 0.69
0.01 0.01 0.00
14 14 14
0.79 0.78 0.90
0.00 0.00 0.00
14
0.20
0.46
14
0.79
0.00
14
-0.70
0.01
14 14 14
-0.58 -0.60 -0.53
0.02 0.01 0.03
vs
head # vs height total biomass seed mass lo EBI
spikelet
vs total
% root
#
biomass/m2
vs seed
#
seed #/pit seed mass total biomass/m2
34
Table Tray
Age
(#) 17 19 20 21 22 23 24 *%root
9.
Growth
Data From
Final Harvest Leaf
(Multiple
area
Root
Ages)
Plant
Height
Tiller
dwt
(days)
(#)
(mm)
(#)
(cm 2)
63
273
494
36
0.37
19.78
6.8
54 46 37 27 18 9
297 237 256 291 294 306
523 512 473 31 7 259 154
58 54 53 ----
0.46 0.52 0.75 0.45 0.39 0.08
22.93 21.33 21.86 13.63 12.98 4.82
7.3 8.9 8.7 16.0 23.0 22.0
(g)
%
root*
= root (dw_ total (dw)
Table
10.
Total
Tray
Age
(#) 17 19 20 21 22 23 24
(days) 63 54 46 37 27 18 9
Dry Matter
DW
per
tray
From
DW
(_) 288 315 240 250 84 56 21
Final Harvest
per (_1) 1.06 1.06 1.01 0.98 0.29 O. 19 0.07
35
plant
DW
(Multiple
per (_1) 1211 1325 1008 1052 357 235 86
m2
DW
Ages)
per (_1) 3149 3444 2621 2735 927 609 224
m3
Fig
27.
LEAF
AREA
RATIO
(LAR)
OVER
TIME
40
3O A
u)
20 n,. J
10
0
l
Fig
I
10
0
28.
"
20
SINGLE
I
"
I
"
30
40
AGE
(days)
PLANT
I
"
50
LEAF
I
"
60
70
AREA
OVER
0.08 O
._,_0.06
0.04
o
0.02
0.00 0
10
20
30 AGE
40 (days)
36
50
60
70
TIME
Fig 29.
DRY WEIGHT PER PLANT OVER TIME
1,6 A
1.4
_"
1.2
k-
Z
. ""
0.2 0.0 -0.2 •
-0.4
I
0
Fig
,
I
10
,
I
20
I
=
40
AGE
(days)
RELATIONSHIP
30.
=
30
I
*
DRY
•
70
60
BETWEEN AND
!
50
PLANT
HEIGHT
WEIGHT
1.6 ---
1.4
""
1.2
Z
1.0
O_
"= 0.8 .,.I L
--I,,-
0.6 0.4
>, m ¢3
0.2 0.0 -0.2 -0.4
I
00
I
200
I
300 HEIGHT
Fig
500
600
(ram)
PHOTOSYNTHETIC EFFICIENCY
31.
I
400
ENERGY CONVERSION OVER TIME
12 11 10 9
g
6
m
3
_
2 1 0
"
0
.
I
10
.
I
20
.
i
.
I
30
40
AGE
(days)
37
,
I
50
,
I
60
,
7O
Table
11.
Tissue
Constituent (_1
g-l)
(n
= 8.14
of Mature
Wheat
Straw
= 5)
(n
= 4)
(n
Mg S Fe Mn Cu Zn Mo
1 490 1590 51 65 0.54 27 0.35
3680 6340 213 776** 47 27 0.65
18.3 1.2 2.2 1.9 63.1
15.4 1.6 15.7 22.1 34.0
27.4 1.3 11.8 13.0 30.1
336
213
242
trays
1 0720 50460 1 4400
= 1)
5190 4710 460
from
8 and 9 contained
_g g-l.
38
Plants
Roots
P K Ca
calories (cal/1009) *N x 6.25
the mean
Analyses
Seeds
protein (%)* fat (%) ash (%) crude fiber (%) carbohydrate (%)
**Sample
Proximate
286 _g g-1 Mn, without
9050 43570 5830 740 3590 5875 143 58 26 2.69
those
trays
Table
12.
Tissue
Constituent (Fg
g-l)
Proximate
Tissue Heads (n
= 3)
P K Ca
6070 9470 1680
Mg S Fe Mn Cu Zn Mo
201 3 1604 65 117 8 27 0.55
protein (%) fat (%) ash (%) crude fiber (%) carbohydrate
Analyses
Age (37-63 Straw (n
of Immature
days)* Roots
= 4)
(n
11 710 51 890 11 830
= 1)
10730 52970 6610
3842 4338 287 178 12 16 0.73
1324 3367 8517 143 28 20 0.53
13.9 3.0 3.7 16.4 51.4
18.8 4.9 15.7 21.4 28.0
289
231
Tissue Straw (n
Wheat
Age
= 1)
1 41 20 52400 6940
Plants
(9-27 days) Roots (n
= 1)
7430 521 30 6040
2250 2740 147 108 10 16 0.77
2178 3594 1624 58 13 16 0.89
25.1 2.7 15.7 18.8 28.0
26.5 6.9 14.4 17.5 22.7
20.5 3.4 14.2 24.8 28.8
237
259
228
(%) calories (cal/lOOg) *The 46 Day tray
(#18)
was
not included
in the analyses._
39
IV. DISCUSSION A. Nutrients The pH, which was recorded daily from the pH readings than the values measured in samples analyses (Fig 5). Wheat grown in past studies pH in the range of 5.0-7.0, so variation was not causes for variations in pH readings (e.g. faulty storage time). There
were
high concentrations
of PO4-P,
controller, had consistantly lower delivered to the laboratory for nutrient at KSC has not shown a sensitivity to a serious concern. There are many equipment, dirty probes, sample
K, Mn, Cu and Mo in the wheat
straw.
The
nutrient solution's PO4-P concentration increased to 70% more than the desired concentration during the study (Fig 8). Phosphorous was being added to the solution as KH2PO 4. Decreasing the KH2PO 4 replenishment would have reduced the K concentration, to lower
unless
the KH2PO
another
K source
4 replenishment
was
substituted,
by 0.5 mmol
such
L -1 water
as KSO 4. It was decided
evapotranspirated
on
Day 166, without supplementing with another K source (Appendix). Even though the K concentration in the solution was often at or below the desired concentration (Fig. 10), the straw contained quantities five times greater than concentrations reported for wheat by Duke and Atchley (1986). Maintenance of the K concentration in the nutrient solution at 6 mmol L -1 water evapotranspirated was apparently too high, as measured by the amount accumulated in the straw. The plants appeared to be deficient in Fe and it was hypothesized that wheat may require large nutrient solution concentrations (100-200 I.[m) to prevent deficiency symptoms. Thus the concentration of Fe in the solution was allowed to increase up to 180 I_M without concern. The wheat straw had concentrations of Fe in excess (Tables 11 and 12) when compared to Duke and Atchley (1986). Even so, Jones (1983) states that it is common to measure tissue Fe in excess of hundreds of parts per million. 'Yecora rojo' wheat appears to be a cultivar which can tolerate a large tissue concentration of Fe. Manganese in the solution was often below the desired concentration, but analyses of the straw tissue revealed high concentrations (Tables 11 and 12). Williams and Vlamis (1957) showed that barley produced Mn toxicity symptoms when grown in a full strength Hoagland's solution (9 _M). When comparing different concentrations of Hoagland's solution and keeping the Mn concentration constant, the severity of the symptoms increased in relation to an increase of the Hoagland's solution concentration. The concentration of Mn in their nutrient solution, which is similar to our concentration, produced moderate to heavy rust-colored spotting in the barley leaves. This is similar to what was seen on the wheat leaves. Williams and Vlamis (1957) suggest a nutrient solution concentration of 0.46 _M as good for barley growth, which is 94% less than what was used in this wheat study. Boron was not measured in the solution nor in the wheat leaves for this study, but Williams and Vlamis (1957) found problems with B toxicity using the Hoagland's concentration. It was suspected that B may have been in excess along with Mn. They suggested using boron nutrient solution concentrations of 2.26 uM for barley, 97% less 40
than what was used in the wheat study. In their barley, B deficiency symptoms never developed, even when it was excluded from the solution. They hypothesized that contamination from unknown sources prevented deficiencies. Although Mo content was high in the straw and roots of both mature and immature plants (Tables 11 and 12), it was normal in the seed. The same was true of Cu. Besides having concern for the nutritional health of the plant, insight into the accumulation of metals in nonedible portions of the plant is very important for a CELSS. These portions normally considered inedible (e.g. leaves, stems and roots) may be processed for consumption by people or other animal systems in CELSS. Micronutrient contamination is a common occurrence in hydroponic systems, especially the metals Cu and Zn. Based on nutrient depletion calculations from our system, 96% of the Cu and 73% of the Zn from the total plant tissue may have come from an outside source (Table 5). The most probable source of the contaminants were brass lined humidifiers, used to humidify the growth chamber air. These humidifiers are commonly used in research facilities. The humidifiers used in this study have since been replaced with plastic fixtures but these still contain some brass components. Tissue analyses indicated that the Zn was equally distributed within the seed, straw and root tissues, whereas the Cu contaminant may have adsorbed to the plant surfaces, rather than enter the tissues. The most obvious example of adsorption to plant tissue was with Fe, which adsorbed readily to the roots (Tables 11 and 12). This was easily seen because the chelator Fe-EDDHA used in the study is dark red, giving the roots a red to red-brown appearance. Many investigators maintain the nutrient concentrations in hydroponic solutions by adjusting the electrical conductivity. Winsor et al. (1979) and Steiner (1980) suggest this method for recirculating systems, while Neilsen (1984) recommends solution maintenance via the conductivity/pH interaction. In this study we monitored both pH and conductivity but relied heavily on the chemical analyses for adjusting the replenishment of the solution (Appendix). Ben-Yaakov and Ben-Asher (1983) found good correlations between the conductivity reading and the concentrations of K+ and NO3- in the solution and were able to determine the uptake rates of those ions by monitoring the conductivity. Correlation of conductivity with (N-NO3)was good in our study (r = 0.89) but there was a poor correlation with the K concentration (r = 0.43). The high correlations between the divalent cations Ca++and Mg++with conductivity were expected but the correlations with the micronutrients were probably coincidental (Table 4). The concentrations of nutrients were determined by measuring ppm in the solution samples. The accumulation curves (Figs 7, 9, 11, 13, 15, 17, 19, 21 and 23) were based on the assumption that 80 L of solution was in the reservoir at the time of sampling. This assumption did not take into account water retained by the roots in each tray. As the plants grew and the root mass expanded, more water was retained. For instance, by Day 80 there may have been 80 L of solution in the reservoir but another 20 L in the trays (100 L total). This discrepancy may explain some of the variations between what was assumed to be added to the solution and what was measured (Table 13).
41
Table 13. Comparison and Actual Nutrient
of Theoretical Additions
Theoretical* Nutrient
Total
NO3-N
*Values were reservoir.
Measu
(g)
Total
red** (g)
158.82
129.11
P
91.01
75.96
K
295.94
285.61
Ca
120.85
105.99
Mg
35.68
27.81
computed
from the amounts
of stock solutions
** Values were computed from the chemistry analyses solution in the reservoir, following replenishments.
which
which
were
were
added
performed
to the
on the
The solution analyses were performed by a different laboratory than were the tissue analyses. In a study by Sterrett et al. (1987) using six reference plant species for tissue sampling of nutrients, 22 different commercial and university laboratories were compared. Agreement was good for N, P and Mg, where 70-80% of the laboratories had values within + 5% of the mean and Mn and Zn were within +10% of the mean. However,
K, S, Fe, Cu and B were
much
lower,
30-48%
of the laboratories
were
within
either 5 or 10% of the mean, depending on the element. In our study, the variations between the tissue concentrations and estimated removal from solution were much lower B.
for P and Mg than
for the other
nutrients
(Table
5).
Harvest
The number of seed per primary head correlated closely with the total seed mass (r = 0.90). This relationship could be used for estimating yields on a per tray basis. However, the number of seed per primary head did not correlate well with spikelet number (r-0.20, Table 10). If there was a high correlation, then it could be hypothesized that the number of spikelets per head was a limiting yields. Since the correlation is low, something other than spikelet number of seed produced per primary head (i.e. fertilization). The
number
of seeds
per primary
head
correlated
(Table 8). Peterson (1965) mentions that the same cm in height, depending upon whether water stress 42
with
plant
height
factor for our wheat number affected the
and total
biomass
wheat variety can vary from 30-90 was a factor in its growth. Meyer
and Green (1981) documented that water stress reduced stem and leaf extension in wheat and soybeans. White (1987) found that spring wheat 'Olaf", produced less straw and grain when roots were constricted or were given a low soil water potential (0.6 MPa). In our study, there were four trays which had particularly low yields (4, 6, 7 and 16). Tray 4 had severe water stress inadvertantly placed on it at day 12 (Tables 6 and 7). Other factors probably contributed to the stress of the plants in this study. Trays 6 and 7 had coinciding leaks in their tray bottoms (30-day-old and 20-day-old, respectively). The leaks were mended with PVC cement, which may have been toxic enough to reduce the wheat yields. The low yield of tray 16 may have been due to nutritional imbalances. Beginning with Day 118, 8 umol of MnSO4 was added to the reservoir every three days. The decision to add Mn was based on the rapid depletion of Mn from the nutrient solution and the appearance of leaf symptoms similar to Mn defficiency (Appendix). As mentioned earlier, Williams and Vlamis (1957), concluded that both Mn and B produce leaf spotting symptoms and reduce yields of barley when supplied at the concentrations of a full strength Hoagland's solution. They found very little spotting when these micronutrients were maintained at 1/20 of the Hoagland's concentration. The wheat in our study had spotting of the leaves which appeared similar to Mn toxicity. The maintained concentration of Mn was usually lower than Hoagland's solution (Fig 18). Referring to the harvest results (Tables 6 and 7), it appears that the last few trays of the study had lower yields than some of the earlier harvested trays. Increasing the Mn addition may have had an influence on the yields. Since shoot tips must be analyzed to accurately characterize Mn in the plant, and tissue analyses were not done on shoot tips, it can not be concluded that Mn toxicity actually occurred in this study. Williams and Vlamis (1957) also deduced that symptoms of these toxicities were reduced when the plants were given a photoperiod, i.e. a dark cycle. The wheat in our study were grown under continuous light, so symptoms may have been reduced if a photoperiod was used. Continuous light in combination with warm temperatures (27oC) hastens the life cycle of wheat, but also reduces yields (Bugbee and Salisbury, 1987a). Thorne and Wood (1987) found warmer temperatures decreased grain number and concluded that the cause was fertilization of fewer florets. These factors may have decreased our overall yields during this study. The PPF exerts a direct influence on wheat growth and yield. Thorne and Wood (1987) found a doubling of radiation increased total dry weight by 80%. Polonskii and Lisovskii (1980) obtained a linear type of relationship between radiation and biomass production for wheat. In addition to high radiation levels, the plant density in their study was quite high (2000 plants m-2), to maximize space by the vertically positioned leaves which intercept light. Polonskii and Lisovskii (1980) had an approximate crop growth rate (CGR) of 123 g m -2 day -1 at a PPF of 1200 _mol m -2 sec -1. Bugbee and Salisbury (1987b) in an similar studies with wheat at high irradiance levels, obtained yields of approximately 95 g m -2 day -1 at the same PPF. The CGR in this study averaged 21 g m -2 day -1 which is similar to results obtained by Bugbee and Salisbury (1987a) of 23 g m -2 day -1 at equivalent PPF. Our energy conversion efficiency averaged 7.3%, which is lower than Bugbee and Salisbury's value of approximately 10%. However, their estimated efficiency was based on an extrapolated portion of their efficiency curve which did not contain data. Using a higher plant density in our study (2000 versus 1000 plants m -2) could have increased both CGR and the energy conversion efficiency, since these values are calculated on an area basis. However, it 43
is likely that the greatest influence on total biomass production, in this study, was the relatively low PPF in the growth chamber, where this in combination with a relatively warm temperature (23oC) produced suboptimal seed yields.
44
Appendix.
Nutrient
Solution
Maintenance
Days into (mmol/L Element
Revisions
Experiment water)
31
49
64
69
82
91
94
97
N P K Ca
7.5 1.5 4.0 2.5
8.0 1.5 4.5 2.5
8.0 1.5 10.5 2.5
3.0 1.5 4.5 0.0
5.0 1.5 4.5 1.0
2.0 1.5 3.5 0.0
4.0 1.5 3.5 1.0
4.0 1.5 3.5 1.0
Mg S
0.68 0.68
0.68 0.68
0.68 3.68
0.68 0.68
0.68 0.68
0.68 0.68
0.68 0.68
0.68 0.68
Fe Si B Mn Zn Cu Mo
43.75 150.00 ..... ..... ..... ..... .....
50.00 **^ 150.00 80.00 *^ 8.00 *^ 0.80 *^ 0.30 *^ 0.10 *^
43.75 150.00
43.75 150.00
43.75 150.00 80.00 8.00 0.80 0.30 0.10
50.00 **^ 150.00 80.00 *^ 8.00 ^ ..... ..... 0.10 *^
43.75 50.00 **^ 150.00 150.00 .................... .................... .................... .................... ....................
*Concentrations were added only on the specified days. **Fe was added as chelated Fe-EDDHA and Fe-HEDTA instead of FeCI3. used on subsequent replenishments. ^Concentrations are given as if they were being added for 80 L of H20.
45
^ ^ ^ ^ ^
FeCI3
was
Appendix.
Nutrient
Days Element
Solution
into
115
160
N P K Ca
4.0 1.5 3.5 1.0
6.0 1.5 3.5 2.0
Mg S
0.68 0.68
0.68 0.68
Fe Si B Mn Zn Cu Mo
Maintenance
Experiment
37.50 50.00 **^ .............................. 80.00 *^ 80.00 *^ 8.00* 8.00* ..... 0.80 *^ ..... 0.30 *^ 0.10 *^ 0.10 *^
*Concentrations **Fe was added
were added as chelated
was used on subsequent ^Concentrations are given
Revisions
(mmol/
166
L water) 172
190
205
5.0 1.0 3.0 1.5
4.5 1.0 2.5 1.5
4.5 0.0 1.5 1.5
5.0 1.0 4.0 1.0
0.68 3.68
0.68 0.68
0.68 0.68
0.25 0.25
37.50
37.50
.......... 8.00* .......... .......... ..........
8.00*
only on the specified days. Fe-EDDHA and Fe-HEDTA
replenishments. as if they were
being
46
added
50.00"**
50.00
**^
80.00"* 8.00 0.80 0.30 0.10
80.00 8.00 0.80 0.30 0.10
*^ ^ *^ *^ *^
instead
^ *^ *^ *^
of FeCI3.
for 80 L of H20.
FeCI3
VI. REFERENCES Baker, D. A. 1983. Uptake of cations and their transport within the plant, pp. 13-15. In: D.A. Robb and W. S. Pierpoint (eds.). Metals and Micronutrients Uptake and Utilization by Plants. Academic Press, New York. Ben-Yaakov, S. and Ben-Asher, J. 1983. A method for estimating K+ and NO3+ uptake rate in hydroponics by a four-electrode conductivity sensor. Scientia Hort. 21:113-122. Biomedical Operations and Research Office. 1986. CELSS "Breadboard" Facility Project Plan. NASA John F. Kennedy Space Center. FL. Bugbee, B. and F. B. Salisbury. 1985a. Personal communication. Plant Science Dept. Utah State University, Logan UT. Bugbee, B. and F. B. Salisbury. 1985b. Wheat production in the Controlled Environments of Space. Utah Science. Winter:145-151. Bugbee, B. and F. Salisbury. 1987a. Studies on the maximum yield of wheat for the controlled environments of space. NASA Technical Memorandum # NCC2-139. Moffett Field CA. Bugbee, B. and F. Salisbury. 1987b. Physiological and genetic studies on wheat for the controlled environments of space. OSSA: Space Life Sciences Symposium. 246248 (abstr). Duke, J. A. and A. A. Atchley. 1986. Table 3 data converted to a zero-moisture basis, p376. In: J. A. Duke and A. A. Atchley (eds.). Handbook of Proximate Analysis Tables of Higher Plants. CRC Press, Boca Raton, FL. Hoagland, D. R. and D. I. Arnon. 1938. The water-culture method for growing plants without soil. Univ. Cal., Col. of Agri. Exper. Sta., Berkeley, CA. pp. 1-38. Hoff, J. E., J. M. Howe and C. A. Mitchell. 1982. Nutritional and cultural aspects of plant species selection for a controlled ecological life support system. NASA Contractor Report # 166324. Purdue University, Purdue IN. Jones, J. B. 1983. Soil and hydroponics, p.13-14. In: A Guide for the Hydroponic and Soiless Culture Grower. Timber Press, Portland, Oregon. MacEIroy, R. D. and J. Bredt. 1984. Current concepts and future direction in CELSS. In NASA Conf. Pub. 2378. Life Support Systems in Space Travel. Meyer, W. S. and G. C. Green. 1981. Plant indicators of wheat and soybean crop stress. Irrig. Sci. 2:167-176. Nielsen, N. E. 1984. Crop production in recirculating nutrient solution according to the principle of Regeneration. ISOSC Proceedings:421-446. 47
Oleson, M. and R. L. Olson. 1986. Controlled Ecological Life Support Systems (CELSS) Conceptual Design Option Study. NASA Contractor Report #177421. Peter's
Fertilizer
Products.
1987.
Personal
communication.
Fogelsville,
PA. In:
Peterson, R. F. 1965. The wheat plant and its morphological development, p. 26. N. Polunin (ed). Wheat--Botany Cultivation and Utilization. Interscience Pub. Inc., New York. Polinskii, V. I. and G. M. Lisovskii. 1980. Net production of wheat crop under high PhAR irradiance with artificial light. Photosynthetica. 14(2):177-181. Prince, R. P., J. W. Bartok and D. W. Protheroe. 1981. controlled environment plant growth unit. Transactions Qualset, C. O., H. E. Vogt, and N. E. Borlaug. wheat. Crop Sci. 25:1130.
1985.
Lettuce production in a of the ASAE. 24 (3):725-730
Registration
of "Yecora
Rojo'
Rummel, J. D. and T. Volk. 1986. A modular BLSS simulation model. COSPAR paper 11.2.2. NASA-Ames Research Center and Dept. of App. Sci., New York Univ. pp. 1-9. Sionit, N., B. R. Strain and H. Hellmers. 1981a. Effects of different concentrations atmospheric CO 2 on growth and yield components of wheat. J. Agric. Sci. Comb. 79:335-339. Sionit, N., D. A. Mortensen, B. R. Strain and H. Hellmers. 1981b. wheat to CO 2 enrichment and different levels of mineral nutrition. Smilanski, 1986. Personal communication. Utah State University, Logan UT.
USDA Agricultural
of
Growth response of Ag. J. 37:1023-1027. Research
Center,
Steiner, A.A. 1980. The selective capacity of plants for ions and its importance composition and treatment of the nutrient solution. SOSC Proceedings:83-95.
for the
Sterrett, S. B., C. B. Smith, M. P. Mascianica and K. T. Demchak. 1987. Comparison of analytical results from plant analysis laboratories. Commun. In Soil Sci. Plant Anal. 18 (3):287-299. Strain, B. R., ed. 1978. Report of the workshop on anticipated plant responses to global carbon dioxide enrichment. Duke Environmental Center, Duke University, Durham, NC. Thorne, G. N. and D. W. Wood. 1987. Effects of radiation and temperature on tiller survival, grain number and grain yield in winter wheat. Ann. Bot. 59:413-426. Tibbitts, T. W. and D. K. Alford. 1982. Controlled of Higher Plants. NASA Conf. Pub. 2231.
Ecological
Vlamis, J. and D. E. Williams. 1967. Manganese Gramineae. Plant and Soil 27,(1):131-139.
and silicon interaction
48
Life Support
System,
in the
Use
White, upper
E. M. roots.
1987.
Spring
Soil Sci.
wheat
at high and low soil water
with
constricted
143, (1):44-49.
Williams, D. E. and J. Vlamis. Plant and Soil. 8, (3):183-193. Winsor,
growth
G. W., R. G. Hurd
Bulletin No. 5. Glasshouse England.
1957.
Manganese
and D. Price. Crops
1979.
Research
toxicity
Nutrient
Institute.
49
in standard
film technique. Littlehampton,
culture
solutions.
Grower's West
Sussex,
Report
Documentation
Page
k.]r* iih ,l, iTi, ir
ik_
1. Report
T
No.
2. Government
Accession
3. Recipient's
No.
Catalog
No.
TH t02784 4. Title
and Subtitle
5. Report
Continuous Hydroponic Wheat a Recirculating System
Production
Using
September
. Author(s)
.Mackowiak, _Owens ?Hinkle, -Prince,
Organization
6. Performing
Organization
Code
8. Performing
Organization
Report
10. Work
Name
15. Supplementary
Name
Unit
11. Contract
No.
or Grant
No.
NAS10-10285 13. Type
Agency
NASA/John
No.
and Address
_The Bionetics Corporation, Mail Code: BIO-3 NASA Biomedical Operations and Research Office John F. Kennedy Space Center, FL 32899 12. Sponsoring
1989
C°L.
Hall, L,Po C.R. R.P.
9. Performing
Date
of Report
and Period
Covered
and Address
Fo Kennedy
Space
Center,
FL
32899
14. Sponsoring
Agency
Code
Notes
16. Abstract
Continuous in a single
crop production, recirculating
where nutrient
plants of solution,
various ages are growing is a possible alternative
production in a Controlled Ecological Life Support System ducted at John Fo Kennedy Space Center (KSC) where 8 trays Triticum aestivum L. "Yecora Rojo" were grown simultaneously
simultaneously to batch
(CELSS)o 2 A study was con(0.24 m per tray) of in a growth chamber at
23°C, 65% relative humidity, 1000 ppm C02, continuous light, with a continuous flow, thin film nutrient delivery system. The same modified Hoagland nutrient solution was recirculated through the plant trays from an 80 L reservoir throughout the study. It was maintained by periodic addition of water and nutrients based on chemical analyses of the solution. The study was conducted for 216 days, during which 24 trays of wheat were consecutively planted (one every 9 days), 16 of which were grown to maturity and harvested. 2The remaining 8 trays were harvested on day 216+ Grain yields averaged 520 g m- , and had an average edible biomass of 32%. Consecutive yields were unaffected by nutrient solution age. It was concluded that continual wheat production will work in this system over an extended period of time+ Certain micronutrient deficiencies and toxicities posed problems in this study and must be addressed in future continuous production systems. 17. Key Words
(Suggested
by Author(s)) 18. Distribution
Hydroponics, production,
recirculating, nutrient film
wheat, technique
Statement
(NFT) _-]J mi ted
19. Security
Classif.
(of this
Unclassified NASA
FORM
report)
21. 20. SecuritYunclassifiedclassif. (of this page)
1626 OCT 86
22. Price
No. of pages
56
I
[