Journal of Experimental Psychology: Learning, Memory, and Cognition 2010, Vol. 36, No. 4, 843– 863
© 2010 American Psychological Association 0278-7393/10/$12.00 DOI: 10.1037/a0019755
Continuous Recollection Versus Unitized Familiarity in Associative Recognition Laura Mickes, Emily M. Johnson, and John T. Wixted University of California, San Diego Recollection has long been thought to play a key role in associative recognition tasks. Evidence that associative recollection might be a threshold process has come from analyses of the associative recognition receiver operating characteristic (ROC). Specifically, the ROC is not as curvilinear as a signal detection theory requires. In addition, the z-ROC is usually curvilinear, as a threshold recollection model requires, not linear, as a signal detection model requires. In Experiment 1, word pairs were strengthened at study, which yielded a curvilinear ROC and a linear z-ROC (in accordance with signal detection theory). This result suggests that associative recognition performance was based on a continuous variable, one that likely consists of either unitized familiarity or continuous recollection. The remember– know procedure and an unexpected cued recall test suggested that the more curvilinear ROC in the strong condition was mainly due to increased recollection. In Experiment 2, word pairs were presented for an old–new recognition decision before being presented for an associative recognition decision. When pairs consisting of items not recognized as having been seen on the list were removed from the analysis, the ROC again became curvilinear, the z-ROC again became linear, and most associative recognition decisions were associated with remember judgments. These findings suggest that the curvilinear z-ROC often observed on associative recognition tests results from noise, as a mixture signal detection model assumes, and that recollection is a continuous process that yields a curvilinear ROC that is well characterized by signal detection theory. Keywords: associative recognition, recollection, familiarity, signal detection theory
study list, whereas rearranged pairs consist of words that appeared on the study list as part of different pairs. Item familiarity is thought to offer no help on this task because, having been seen on a recent study list, the items of both intact and rearranged pairs are, on average, equally familiar. As such, it is often assumed that accurate performance is achieved by recollecting a word’s associate at study. Because of its presumed reliance on recollection, the associative recognition task has been used to address questions about the nature of the recollection process, such as whether recollection is a categorical or a continuous process (Kelley & Wixted, 2001; Yonelinas, 1997). The categorical view holds that a pair of items on the recognition test either occasions recollection (e.g., one item elicits recollection of its paired associate at study) or does not. If it does, a correct intact or correct rearranged decision is made with high confidence and high accuracy. If it does not, the only recourse is to rely on some other process, such as item familiarity (thought to be of little help on this task), or to guess randomly. A continuous view of recollection, by contrast, holds that a pair of items on an associative recognition test can occasion any degree of recollection. The more recollection occasioned by the pair, the higher the confidence and the higher the accuracy (Kelley & Wixted, 2001). Categorical recognition processes are usually conceptualized in terms of high-threshold theory, according to which memory strength either exceeds a threshold or does not exceed a threshold (Green & Swets, 1966; Macmillan & Creelman, 2005). In an associative recognition task, two recollection thresholds would apply, one that can be exceeded only by intact pairs (“recall-toaccept”) and another that can be exceeded only by rearranged pairs
Recognition memory decisions are widely thought to be based either on the recollection of specific contextual details or on a context-free sense of familiarity (Atkinson & Joula, 1973; Jacoby, 1991; Mandler, 1980; Yonelinas, 2002). To investigate the nature of the recollection process, associative recognition procedures are commonly used, and this is true in both experimental psychology (e.g., Clark, 1992; Clark & Hori, 1995; Hockley, 1992; Hockley & Consoli, 1999; Hockley & Cristi, 1996; Nobel & Shiffrin, 2001; Rotello & Heit, 2000; Verde, 2004; Xu & Malmberg, 2007; Yonelinas, 1997) and cognitive neuroscience (e.g., Giovanello, Verfaellie, & Keane, 2003; Habib & Nyberg, 2008; Haskins, Yonelinas, Quamme, & Ranganath, 2008; Sauvage, Fortin, Owens, Yonelinas, & Eichenbaum, 2008; Speer & Curran, 2007; Stark, Bayley, & Squire, 2002; Turriziani, Fadda, Caltagirone, & Carlesimo, 2004). In a typical version of this procedure, participants first study a list of word pairs and then, on a subsequent recognition test, try to discriminate intact pairs from rearranged pairs. Intact pairs consist of words that appeared together on the
Laura Mickes, Emily M. Johnson, and John T. Wixted, Department of Psychology, University of California, San Diego. Some of this work was supported by National Institute of Mental Health Grant R01MH082892. The content is solely the responsibility of the authors and does not necessarily represent the official views of the National Institute of Mental Health or the National Institutes of Health. We thank Drew Hoffman for data collection. Correspondence should be addressed to John T. Wixted, Department of Psychology, 0109, University of California, San Diego, La Jolla, CA 92093-0109. E-mail:
[email protected] 843
844
MICKES, JOHNSON, AND WIXTED
(“recall-to-reject”). This account is known as double-highthreshold theory. By contrast, continuous recognition processes are usually conceptualized in terms of signal detection theory, according to which the memory strengths of targets and lures are represented by normal distributions with different means and, possibly, different variances. In an associative recognition task, these two distributions might represent degrees of recollection associated with intact pairs (the “target” distribution) and rearranged pairs (the “lure” distribution). It has long been known that a categorical process predicts a linear receiver operating characteristic (ROC), whereas a continuous signal detection process predicts a curvilinear ROC (Green & Swets, 1966). An ROC is a plot of the hit rate versus the falsealarm rate across different levels of bias for a single memory strength condition. Multiple pairs of hit and false-alarm rates representing different levels of bias are usually obtained by asking participants to provide confidence ratings for their recognition decisions. A pair of hit and false-alarm rates can be computed for each level of confidence, and those values can be plotted against each other to construct an ROC. Item recognition ROCs are almost invariably curvilinear (e.g., Egan, 1958; Ratcliff, Sheu, & Gronlund, 1992), and this has long been taken to mean that memory strengths are continuously distributed across items. Moreover, item recognition z-ROCs (i.e., a plot of the z-transformed hit rate vs. the z-transformed false-alarm rate) are typically linear, which is also consistent with a Gaussian signal detection account. By contrast, a categorical high-threshold process predicts that the z-ROC will be curvilinear (Macmillan & Creelman, 2005). Yonelinas (1997) reported that unlike an item recognition task, the associative recognition task yields a nearly linear ROC (and a curvilinear z-ROC). Because this was the first linear ROC ever reported for a recognition memory task, and because it occurred for a task that was thought to depend largely on recollection, this finding offered compelling support for the idea that recollection is a categorical process. Moreover, these findings were broadly consistent with the dual-process signal detection (DPSD) model, which applies to a variety of memory tasks and assumes that, depending on the task, performance is supported by a recollection process or a familiarity process, or both (Yonelinas, 1994). Whereas recollection is assumed to be a categorical threshold process, familiarity is assumed to be governed by a continuous equal-variance signal detection (EVSD) model. For a purely recollection-based task, which is what the associative recognition task is sometimes thought to be, this model reduces to doublehigh-threshold theory and predicts a linear ROC.
Accounting for Curvilinear Associative Recognition ROCs Since the original report of a linear ROC, most studies have found that associative recognition procedures yield curvilinear ROCs, not linear ROCs (e.g., Healy, Light, & Chung, 2005; Qin, Raye, Johnson, & Mitchell, 2001; Verde & Rotello, 2004). This is especially true under conditions in which associative memory is strong (Kelley & Wixted, 2001). In a previous experiment that set the stage for the current research, Kelley and Wixted (2001) manipulated the strength of unrelated word pairs by presenting some pairs once and other pairs multiple times during study. The weak pairs yielded the typical pattern. That is, the ROC was
curvilinear, but not as curvilinear as it should be according to a Gaussian signal detection model, and the z-ROC was curvilinear. However, the strong pairs yielded a symmetrically curvilinear ROC and an essentially linear z-ROC that was accurately described by the EVSD model. The reliably curvilinear shape of associative recognition ROCs has been taken as evidence that recollection is a continuous signal detection process after all (Kelley & Wixted, 2001; Wixted, 2007). However, an alternative possibility, originally noted by Yonelinas (1997) and advanced more forcefully in recent years (e.g., Haskins et al., 2008; Quamme, Yonelinas, & Norman, 2007), is that the curvilinearity of the associative recognition ROC instead reflects “unitized” familiarity, that is, the familiarity of the pair considered as a unit. According to this idea, although the individual items of intact and rearranged pairs are equally familiar, intact pairs, having been presented on the study list, have a higher degree of unitized familiarity than rearranged pairs, which have not been previously seen together. If participants relied on the continuous unitized familiarity signal to discriminate intact from rearranged pairs, the DPSD model predicts that the associative recognition ROC will be curvilinear (because familiarity of any kind is construed as a signal detection process in this model). Thus, the notion of unitized familiarity brings the DPSD model into line with curvilinear associative recognition ROCs. With this concept, the DPSD model can even accommodate the symmetrically curvilinear ROC (and linear z-ROC) that is sometimes observed when associative memory is strong (Kelley & Wixted, 2001). For that result, the explanation would be that performance was based almost exclusively on unitized familiarity, in which case the model reduces to an EVSD model and predicts precisely that outcome. The first goal of the research we present here was to discriminate between these two interpretations (i.e., the continuous recollection vs. unitized familiarity interpretations) of curvilinear associative recognition ROCs and linear z-ROCs that are particularly evident when associative recognition memory is strong.
Accounting for Curvilinear Associative Recognition z-ROCs In most associative recognition studies, overall memory strength is relatively weak (e.g., the pairs are presented once each at study), and the z-ROC is more reliably curvilinear. This result indicates that the ROC is not as curvilinear as it should be, according to signal detection theory. Accounting for that phenomenon is a second matter of debate. The standard Gaussian signal detection model cannot accommodate this result because it predicts that the ROC will be distinctly curvilinear and the z-ROC will be linear. Moreover, a pure double-high-threshold model, which does predict a curvilinear z-ROC, cannot account for the fact that the ROC is also typically curvilinear (not linear) when memory is weak. However, the full DPSD model can account for all these ROC and z-ROC patterns by assuming that both threshold recollection and unitized familiarity play a role in associative recognition. That is, if unitized familiarity plays a role for some pairs on the recognition test, then it would impart some degree of curvilinearity to the ROC. If a threshold recollection process plays a role for other pairs, then it would impart some degree of curvilinearity to the z-ROC as well. Thus, the DPSD model can generally fit weak associative recognition ROCs better than a pure signal detection
CONTINUOUS RECOLLECTION VERSUS UNITIZED FAMILIARITY
model can. If the ROC is more in accordance with signal detection theory when memory is strong, the DPSD model can accommodate that result by assuming that decisions are largely based on unitized familiarity (a signal detection process). An alternative interpretation holds that the z-ROC is curvilinear when memory is weak because associative information is simply not available for some of the pairs, perhaps because the information for those pairs was not encoded at study. The standard two-distribution signal detection model has no provision for a subset of intact and rearranged test pairs without any associative information. If associative information is not encoded for some of the pairs, then the relevant signal detection model would be a “mixture” model involving (at least) three Gaussian distributions (cf. DeCarlo, 2002): one for intact pairs, one for rearranged pairs, and one for intact and rearranged pairs for which no associative information was encoded. The third distribution is, in essence, a noise distribution. Such a model predicts a curvilinear z-ROC even though the memory strength signal is always construed as a con-
tinuous process (DeCarlo, 2003). Note that the mixture signal detection (MSD) model does not require a fundamentally different theoretical interpretation than the standard two-distribution signal model. It merely allows for the possibility that some pairs were not encoded at study—an idea that makes no new theoretical claim about the nature of memory. The second goal of the research we conducted was to discriminate between these two interpretations (i.e., the MSD vs. categorical recollection interpretations) of the relatively linear associative recognition ROCs and curvilinear z-ROCs that are reliably observed when memory is weak. Figure 1 illustrates how the two competing models explain a too-linear ROC and a curvilinear z-ROC for the weak condition (the typical result) and a symmetrically curvilinear ROC and linear z-ROC for the strong condition, which is what Kelley and Wixted (2001) observed. The continuous recollection account assumes that a mixture model applies in the weak condition (Figure 1A) and that a standard signal detection model applies in the strong condition (Figure 1B). A standard signal detection model would apply in the
Continuous Recollection MSD Model
DPSD Model
R
A
Weak
845
High-Confidence Recollection
C
Weak
IntactRearr1-R Intact
Rearr
"Rearranged"
"Intact"
"Rearranged"
"Intact" Unitized Familiarity
Recollection
B
Strong
Intact
Rearr
D
Strong
Intact
Intact Rearr
Rearr
"Rearranged"
"Intact" Recollection
"Rearranged"
"Intact" Unitized Familiarity
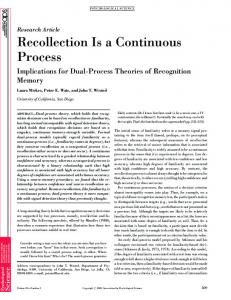
Figure 1. An illustration of the competing models of associative recognition receiver operating characteristic (ROC) data. The mixture signal detection (MSD) model assumes that the decision axis represents associative recollection and that some intact pairs and some rearranged pairs are drawn from a nondiagnostic noise distribution (labeled Intact⫺, Rearr⫺) in the weak condition (A). If a symmetrical curvilinear ROC (and linear z-ROC) is observed in the strong condition, this model assumes that all items are drawn from diagnostic intact (Intact) or rearranged (Rearr) distributions (B). The dual-process signal detection (DPSD) model assumes the decision axis represents unitized familiarity and that some intact pairs and some rearranged pairs are associated with threshold recollection (which occurs with probability R) in the weak condition (C). In the strong condition, all pairs are drawn from the unitized familiarity distributions (D).
846
MICKES, JOHNSON, AND WIXTED
strong condition if study time were such that at least some associative information was encoded for all the pairs on the list. In the weak condition, the noise distribution is represented by a dotted curve, and it represents intact and rearranged pairs for which no associative information was encoded (denoted Intact⫺ and Rearr⫺, respectively). The key theoretical consideration is that the memory strength axis in this version of the MSD model always reflects a continuous memory signal, which was assumed by Kelley and Wixted to reflect continuous recollection. This differs from the interpretation offered by the DPSD model, which is illustrated in Figures 1C and 1D. To account for the curvilinear z-ROC seen when memory is weak, the DPSD model assumes that a probabilistic recollection process plays a role. With probability R, an intact pair or a rearranged pair elicits recollection, in which case a highconfidence correct decision is made (Figure 1C). The probability of recollection can differ for intact and rearranged pairs, but this illustration assumes a common recollection probability for the sake of simplicity. With probability 1 ⫺ R, the decision is based on unitized familiarity, which is governed by an EVSD model. The contribution of unitized familiarity accounts for the fact that weak ROCs are usually somewhat curvilinear. In the strong condition, responding is based solely on unitized familiarity (Figure 1D). That is, R would equal 0 to yield a perfectly linear z-ROC and a symmetrically curvilinear ROC (though R would be greater than 0 if the z-ROC had any degree of curvilinearity in the strong condition or if the ROC were at all asymmetrical). In our first experiment, we investigated why the associative recognition ROC becomes more curvilinear (and the z-ROC more linear) as memory strength is increased. More specifically, the first experiment tested whether strengthening pairs on an associative recognition task results in decisions based on continuous recollection (as in Figure 1B) or unitized familiarity (as in Figure 1D). We did this by combining the strength manipulation used by Kelley and Wixted (2001) with the remember– know procedure (cf. Hockley & Consoli, 1999; Verde, 2004) and with an unexpected cued recall test administered after the recognition test. The second experiment was designed to shed light on why associative recognition ROCs have the shape they do when memory is relatively weak. More specifically, Experiment 2 was designed to assess whether the shape of the ROC typically associated with that condition (i.e., a curvilinear z-ROC) reflects the inclusion of pairs for which no associative information is available (as in Figure 1A) or whether it reflects categorical recollection (as in Figure 1C). We did this by asking for old–new judgments for the pairs before asking for an intact–rearranged decision, which allowed us to construct multiple associative recognition ROCs that were conditional on confidence in the old–new decision (cf. Slotnick & Dodson, 2005). If an MSD model applies, then it should be possible to isolate the no-information pairs and exclude them from the analysis. In particular, word pairs consisting of items that are not even recognized as having appeared on the study list are unlikely to contain any information about whether the pair is intact or rearranged. Once those pairs are excluded, the remaining pairs should yield a symmetrically curvilinear ROC and a linear z-ROC (which is the prediction made by the model shown in Figure 1A when the noise distribution is removed). The remember– know procedure was also employed in this experiment to help determine
whether the items remaining in the analysis involved decisions based on recollection or on unitized familiarity.
Experiment 1 In Experiment 1, the strength of word pairs was manipulated within list by presenting some pairs once and other pairs five times. At test, participants were asked to indicate confidence in their intact–rearranged decisions and to indicate subjectively whether their decisions were based on recollection or on familiarity using the remember– know procedure. If the ROC data replicate the results reported by Kelley and Wixted (2001), then the weak condition will yield a relatively linear ROC (and curvilinear z-ROC) that is poorly described by signal detection theory, whereas the strong condition will yield a curvilinear ROC that is accurately described by an EVSD model. Note that the strong ROC is not required by any model to be symmetrically curvilinear. Indeed, item recognition ROCs are generally asymmetrically curvilinear, and the reason for the asymmetry is not well understood (Heathcote, 2003). One possibility is that on an item recognition task, memory strength is added only to the target items during study. If added strength varies across items (e.g., due to varying attention), and if added strength is not correlated with baseline strength (or if any such correlation is sufficiently low), then both the mean and the variance of the memory strength variable would be greater for targets than lures (Wixted, 2007). In an associative recognition procedure, however, varying degrees of memory strength may be added at study whether the pairs later end up as being intact or rearranged. Thus, for example, an intact pair that was well encoded might be associated with a stronger recall-to-accept signal than one that was more poorly encoded. Similarly, a rearranged pair consisting of items taken from two pairs that were well encoded might be associated with a stronger recall-to-reject signal than a rearranged pair consisting of items taken from two pairs that were more poorly encoded. Because varying degrees of memory strength are added to both intact and rearranged pairs, the intact and rearranged distributions might be more likely to have similar variability (and to yield therefore a more symmetrically curvilinear ROC) than target and lure distributions in item recognition tasks. In any case, our investigation capitalizes on the fact that strong associative recognition ROCs are sometimes symmetrically curvilinear, as it was for the random word pairs used by Kelley and Wixted (2001) and for the associatively related word pairs used in the present experiments. Under those conditions, the competing models offer very different interpretations based on either unitized familiarity or continuous recollection. According to one common view, remember responses reflect recollection-based responding, whereas know responses reflect familiarity-based responding (Bodner & Lindsay, 2003; Eldridge, Sarfatti, & Knowlton, 2002; Rajaram, 1993; Yonelinas & Jacoby, 1995). If so, and if the more curvilinear ROC in the strong condition reflects decisions based primarily on unitized familiarity (see Figure 1D), then the strong condition should be associated with a higher proportion of know judgments relative to the weak condition. If, instead, the more curvilinear ROC in the strong condition reflects decisions based on increased continuous recollection (see Figure 1B), then the strong condition should be asso-
CONTINUOUS RECOLLECTION VERSUS UNITIZED FAMILIARITY
ciated with a higher proportion of remember judgments relative to the weak condition. The logic of this analysis rests on the assumption that the usual process-pure interpretation of remember– know judgments is correct (i.e., that remember responses reflect recollection and know responses reflect familiarity). However, much recent evidence suggests that they actually reflect different degrees of memory strength (Donaldson, 1996; Dunn, 2004, 2008; Wixted & Stretch, 2004). According to this idea, when memory strength exceeds a high remember criterion, a remember judgment is made, but if it exceeds only a lower know criterion, a know judgment is made. Even if this interpretation is correct, it is still likely that remember judgments indicate more recollection than know judgments. Wais, Mickes, and Wixted (2008), for example, recently reported that source recollection associated with remember judgments was higher than that associated with know judgments (even though source accuracy associated with know judgments was also above chance). The question of whether know judgments largely reflect familiarity is more controversial, so the prediction that know judgments will increase with unitized familiarity stems from one particular perspective, which holds that know judgments reflect familiarity and that this holds true for unitized familiarity. Even though the different accounts agree that remember judgments reflect a higher degree of recollection than know judgments, a test of the validity of that assumption was included in this experiment. Specifically, to determine whether recollection was greater for remember judgments than for know judgments, we also gave participants an unexpected cued recall test after the recognition test was completed. This test allowed us to determine not only whether remember judgments were, in fact, associated with higher degrees of associative recollection than know judgments but also whether confidence in the intact-versus-rearranged recognition decisions was in any way related to later cued recall success. If associative recognition decisions in the strong condition are based largely or exclusively on continuous recollection, one would predict that confidence in the recognition decision would be directly related in continuous fashion to later cued recall accuracy, and this should be true for both intact and rearranged pairs. If recognition decisions in the strong condition are instead based on unitized familiarity, which is typically modeled as being independent of recollection (e.g., Haskins et al., 2008), then no such relationship would be required.
Method Participants. Fifteen undergraduates from the University of California, San Diego, participated for psychology course credit. Materials. The words were drawn from 28 categories taken from category norms provided by Van Overschelde, Rawson, and Dunlosky (2004). Both intact and rearranged pairs were constructed with words from the same semantic categories (e.g., ruby was paired with diamond, violin with cello, dentist with lawyer, etc.). The number of pairs on the list drawn from a given category ranged from two to six. Within-category pairs were used to facilitate the formation of associations during study and to determine whether the effects reported by Kelley and Wixted (2001), who used unrelated word pairs, would generalize to related materials. The intact or rearranged status of the word pairs was counterbalanced across participants. Instructions and stimuli were displayed
847
for each participant on a 17-inch (43.18-cm) monitor powered by a desktop computer. The presentation of stimuli and the recording of responses was controlled with E-Prime software (Psychology Software Tools, Pittsburgh, PA; http://www.pstnet.com). Procedure. After consenting, participants were given instructions, presented with a list of word pairs to study, and completed the recognition test. During the study phase, 112 semantically related word pairs were randomly presented for 2 s either one time (56 pairs in the weak condition) or five times (56 pairs in the strong condition). The repetitions were randomly distributed throughout the list. During the subsequent recognition test, 112 pairs were shown, 56 of which were intact and 56 of which were rearranged (28 weak pairs and 28 strong pairs in each case). The rearranged words were coupled with another semantically related word of equal strength (e.g., two words pairs, flamingo–penguin and vulture–eagle, would be presented once and then at test rearranged with one another: flamingo–eagle). The words always maintained their original left–right positions. Participants indicated on a 6-point scale whether each pair was intact or rearranged (i.e., 1 ⫽ definitely rearranged, 2 ⫽ probably rearranged, 3 ⫽ maybe rearranged, 4 ⫽ maybe intact, 5 ⫽ probably intact, and 6 ⫽ definitely intact). Next, participants indicated whether they remembered or knew whether the word pairs were intact or rearranged. The instructions for making these judgments were adapted from Gardiner, Ramponi, and Richardson-Klavehn (1998). Participants were instructed to make a remember judgment when they consciously recollected details of the study episode, whereas a know judgment was to be made when the decision was based on a sense of familiarity in the absence of recollection. We did not specifically draw their attention to the difference between recallto-accept (for an intact pair) and recall-to-reject (for a rearranged pair). However, participants were given a surprise cued recall test in which they were provided with one of the words of a pair (always the left word) and asked to type in its original associate. This test allowed us to verify their understanding of a remember judgment for both intact and rearranged pairs.
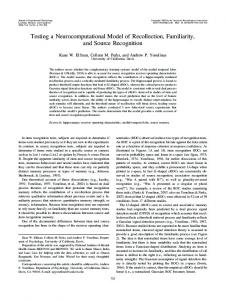
Results Two participants performed at chance levels in the weak condition but were retained in the following analyses because, in both cases, their performance was above chance in the strong condition (excluding the two participants who performed at chance in the weak condition had a negligible effect on the results). The basic hit, miss, correct rejection, and false-alarm rates are considered first, followed by an analysis of the ROC data and then by an analysis of the remember– know and cued recall data. An alpha level of .05 was used for all statistical tests. Hit, miss, correct rejection, and false-alarm rates. The hit rate (defined as the probability of correctly declaring an intact pair to be intact) increased with strength (see Figure 2A), t(14) ⫽ 6.42, but the false-alarm rate (the probability of incorrectly declaring a rearranged pair to be intact) was unaffected by strength (Figure 2B), replicating a pattern that has been repeatedly observed in the past (Buchler, Light, & Reder, 2008; Gallo, Sullivan, Daffner, Schacter, & Budson, 2004; Jones & Jacoby, 2001; Kelley & Wixted, 2001; Malmberg & Xu, 2007; Verde & Rotello, 2004). The miss rate (equal to 1 minus the hit rate; Figure 2A) and correct rejection rate (equal to 1 minus the false-alarm rate; Figure 2B) for
MICKES, JOHNSON, AND WIXTED
848
A
B Proportion of Rearranged Pairs
Proportion of Intact Pairs
1.0
Intact 0.8 Weak Strong
0.6
0.4
0.2
0.0
Hit
1.0
Rearranged 0.8
0.6
0.4
0.2
0.0
Miss
CR
FA
Figure 2. Hit, miss, correct rejection (CR), and false-alarm (FA) rates obtained in the weak and strong conditions of Experiment 1. The hit rate is defined as the proportion of intact pairs that were correctly declared to be intact, whereas the FA rate is defined as the proportion of rearranged pairs that were incorrectly declared to be intact. The miss rate is 1 minus the hit rate, and the correct rejection rate is 1 minus the FA rate. Error bars represent standard error of the mean.
reflected in the quadratic coefficients as well. For the ROC data, the quadratic coefficients for the weak and strong functions were ⫺0.95 and ⫺4.64, respectively (negative values indicate an inverted U-shaped function, and values closer to 0 indicate a more linear function). For the z-ROC data, the corresponding values were 0.36 and 0.06, respectively (positive values indicate a U-shaped function, and, again, values closer to 0 indicate a more linear function). These findings also replicate the results reported by Kelley and Wixted (2001). Next, we performed model-based analyses by fitting the MSD model and the DPSD model (both of which are illustrated in Figure 1) to the ROC data by means of maximum likelihood estimation. Each model was fit simultaneously to the data from the weak and the strong conditions, and we fit them to both the group and individual participant data. The purpose of this model-fitting exercise was to reveal how each model interprets the change in the shape of the ROC as strength increases. A question that might be
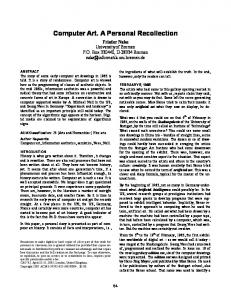
the weak and strong conditions are redundant but are shown to facilitate comparison with the remember– know results presented later. ROC analyses. The group ROC data (see Figure 3A) and z-ROC data (Figure 3B) were first analyzed in theory-neutral fashion by fitting second-order polynomials to the data via least squares. A linear function would have a quadratic coefficient of 0, whereas a curvilinear function would have a quadratic coefficient different from 0. Because the least squares method minimizes error in the vertical direction, whereas ROC and z-ROC data are associated with error in both the vertical and horizontal directions, we performed each fit twice, reversing the axes for the second fit, and then averaged the absolute values of the resulting quadratic coefficients. It is visually apparent that the strong ROC data are more curvilinear than the weak ROC data (Figure 3A), whereas the reverse is true of the z-ROC data (Figure 3B). These trends are
B 1.0
2.5
0.8
2.0 z-Hit Rate
Hit Rate
A
0.6 0.4 Weak Strong
0.2
0.2
0.4
0.6
FA Rate
0.8
1.0 0.5 0.0
0.0 0.0
1.5
1.0
-0.5 -2.5 -2.0 -1.5 -1.0 -0.5 0.0
0.5
z-FA Rate
Figure 3. Receiver operating characteristic (ROC) data (A) and z-ROC data (B) for the weak and strong conditions of Experiment 1. The curves represent least squares fit of a second-order polynomial. FA ⫽ false alarm.
CONTINUOUS RECOLLECTION VERSUS UNITIZED FAMILIARITY
asked at the outset is whether the MSD model or the DPSD model is really needed to fit associative recognition ROC data. Would the traditional unequal-variance signal detection model suffice? The answer is no because its ability to describe the group ROC data was very poor, 2(11) ⫽ 69.93. As described below, both the MSD model and the DPSD model provide much better fits. The MSD model has four main parameters that are scaled with respect to the mean and standard deviation of the noise distribution (arbitrarily set to 0 and 1, respectively): Rearr is the mean of the rearranged Gaussian distribution, Intact is the mean of the intact Gaussian distribution, is the standard deviation of the intact and rearranged distributions, and (which was constrained to vary between 0 and 1) is the probability that associative information was encoded for an intact or rearranged pair. Thus, represents the probability that a memory strength value for an intact pair is drawn from the intact distribution and the probability that a memory strength value for a rearranged pair is drawn from the rearranged distribution, whereas 1 ⫺ is the probability that a memory strength value for a test pair (whether intact or rearranged) is drawn from the noise distribution. As approaches 1 (as it might in the strong condition and as illustrated in Figure 1B), this model reduces to the EVSD model and predicts a symmetrically curvilinear ROC and linear z-ROC. Although the intact and rearranged distributions illustrated in Figure 1A have the same standard deviation as the noise distribution, there is reason to believe that they will differ in practice. Kelley and Wixted (2001) included new pairs on a recognition test, which are conceptually similar to pairs that were not encoded, and found that the standard deviation of the intact and rearranged pairs based on ROC analysis was much greater than that of the new pairs. Thus, the parameter was included to allow for that possibility here. In addition to estimating the four theoretically significant parameters mentioned above, we estimated the locations of five confidence criteria (which must be done no matter which model is fit to the data). For both the group and the individual fits, the confidence criteria estimates were fixed across strength conditions because the weak and strong pairs were intermixed at test. One participant was excluded from the group ROC analysis because of an extreme response bias (e.g., in the strong condition, this participant’s hit and false-alarm rates were 1.0 and 0.82, respectively). For the individual fits, one participant did not use one of the confidence ratings for either intact or rearranged pairs in either the weak condition or the strong condition, so adjacent confidence categories were collapsed, and degrees of freedom were reduced accordingly. Based on the group ROC analysis, the interpretation of the ROC data in terms of the MSD model is as expected in light of the polynomial regressions described earlier. Specifically, according to the MSD model, the effect of the strength manipulation was mainly to decrease the proportion of pairs drawn from the noise distribution, thereby resulting in a more curvilinear ROC and more linear z-ROC as strength increased (see Table 1). For the group ROC fits, the estimates of Rearr and Intact did not differ systematically as a function of strength. Indeed, constraining their values to be constant across conditions did not significantly worsen the fit, 2(2) ⫽ 3.19. The same was true of (i.e., constraining its value to be equal across strength conditions did not significantly affect the quality of the fit), 2(1) ⫽ 3.19. By contrast, the estimate of differed considerably as a function of strength, and constrain-
849
Table 1 Maximum Likelihood Parameter Estimates and Chi-Square Goodness-of-Fit Statistics Based on a Fit of the Mixture Signal Detection Model to the Weak and Strong Receiver Operating Characteristic Data From Experiment 1 Level of analysis
Rearr
Intact
weak
strong
2
df
Group Individual
⫺2.08 ⫺1.86
4.78 4.53
3.09 2.63
.62 .55
1.00 .96
22.9 176.8
10 147
Note. Rearr ⫽ rearranged.
ing its value to be constant across strength conditions did significantly worsen the fit, 2(1) ⫽ 29.69. Table 1 shows the estimated parameter values for the most parsimonious fit of the MSD model. In this model, only varies as a function of strength (with the values of the other parameters being the same in the weak and strong conditions). The same basic story emerges for the individual fits. To prevent runaway estimates that would otherwise occur in a few cases, Rearr was limited to a minimum ⫺4.0 for these fits (this limit was reached for four participants in the weak condition and for two in the strong condition), and Intact was limited to a maximum of 7.0 (this limit was reached for two participants in the weak condition and for two in the strong condition). These limits were chosen in light of the estimates obtained for these values in the group fits. Compared with a fit of the full model (with all parameters free to vary across strength), constraining all the parameters except for to be the same across strength conditions did not significantly worsen the fit, 2(46) ⫽ 30.72. By contrast, constraining to be the same across strength conditions while leaving all other parameters free to vary did significantly worsen the fit, 2(15) ⫽ 47.48. Thus, as with the group fits, the most parsimonious MSD model involves two levels of (one for the weak condition and one for the strong condition), with all other parameters fixed across strength conditions. The average parameter estimates for this model are shown in Table 1, and it is clear that both the group and individual fits suggest that the role of the noise distribution is negligible in the strong condition (because is close to 1.0). Thus, according to the MSD model, the primary effect of strengthening word pairs at study was to reduce to approximately zero the proportion of pairs at test for which no associative information was available. This has the effect of creating a more curvilinear ROC (and more linear z-ROC) in the strong condition compared with the weak condition. The effect of strength on was as expected, but the absence of an effect of strength on Intact, Rearr, and was somewhat unexpected. It seems natural to assume that the standardized distance between the means of the intact and rearranged distributions (a measure of associative strength) would increase with strength, just as does. One possible explanation for the absence of an effect of strength is suggested by Malmberg and Shiffrin’s (2005) “one-shot” hypothesis. According to this idea, a fixed amount of context is stored when an item is initially studied, but further increases in study time do not further increase the amount of context that is stored. Adapted to the associative recognition paradigm, the one-shot hypothesis might be that the associative strength between the two words of a pair is established by the
850
MICKES, JOHNSON, AND WIXTED
initial presentation with some probability but that further presentations have little or no effect on associative strength (perhaps because participants pay relatively little attention to repeats of pairs that were already encoded and instead attend selectively to repeated presentations of pairs that were not encoded). Whatever the reason, the mixture model suggests that the main effect of repeated presentations was to increase the probability that associative information was encoded. As a pure mathematical account, the mixture model assumes that associative memory strength is a continuously distributed variable, but it does not necessarily specify what that variable might be in terms of dual-process theory (and its validity does not depend on the validity of the distinction between recollection and familiarity). Kelley and Wixted (2001) argued that the diagnostic memory strength variable in an associative recognition task reflects recollection, and that idea was further tested in the present experiment with both the remember– know procedure and cued recall tests (the results of which are presented below). For the moment, the point is that the MSD model interprets a curvilinear z-ROC to reflect the contribution of a noise distribution, and it interprets the change in the shape of the z-ROC from a curvilinear shape to a more linear shape to reflect a reduced contribution a noise (in the manner depicted in Figure 1B). The DPSD model was fit to the group and individual ROC data in the same way that the MSD model was fit. The interpretation of the ROC data in terms of the DPSD model is also as expected in light of the polynomial regressions described earlier. For a single strength condition, the DPSD model has three parameters of interest—RIntact, RRearr, and d⬘—where RIntact represents the probability of above-threshold recollection for an intact pair, RRearr represents the probability of above-threshold recollection for a rearranged pair, and d⬘ represents unitized familiarity. More specifically, d⬘ in this model represents the distance between the means of the intact and rearranged unitized familiarity distributions (which are assumed to be Gaussian in form and to have the same variance). If d⬘ is close to 0 (as might be the case in the weak condition), then this model reduces to the double-high-threshold model and predicts a linear ROC. If d⬘ increases (as it might for the strong condition), then the model predicts a more curvilinear ROC. Because d⬘ in this model represents the standardized distance between the means of the intact and rearranged unitized familiarity distributions, there are four Gaussian distributions altogether when strength is manipulated within list (two for the weak condition and two for the strong condition). The mean and standard deviation of the rearranged unitized familiarity distribution in the weak condition were set to 0 and 1, respectively, and the other familiarity distributions were scaled with respect to those values. The standard deviation of the intact familiarity distribution was also set to 1 in the weak condition (i.e., the weak condition was represented by an equal-variance familiarity model), and its estimated mean is represented by d⬘weak. The standard deviations of the strong intact and rearranged unitized familiarity distributions were represented by the parameter . Thus, the strong condition was also represented by an equal-variance familiarity model, but the strong distributions were not required to have the same standard deviation as the weak distributions. Two additional parameters were needed to specify the means of the intact and rearranged distributions in the strong condition, and these were defined by the parameters ␦ (the mean of the strong rearranged distribution) and d⬘strong (the mean of the
strong intact distribution minus the mean of the strong rearranged distribution divided by ). These four parameters (d⬘weak, d⬘strong, , and ␦), plus the four recollection parameters (RIntact–strong, RRearranged–strong, RIntact–weak, and RRearranged–weak), plus the five confidence criteria, made for a total of 13 parameters. However, in practice, only 10 were needed to fit the ROC data (because a single recollection parameter sufficed), which is the same number of parameters as in the MSD model. According to the fit of the DPSD model to the group ROC data, the effect of the strength manipulation was to greatly increase unitized familiarity (as measured by the model’s d⬘ parameter) while having no discernable effect on recollection. Indeed, compared with the fit of the full model, the quality of the fit was not significantly affected when the four recollection parameters (which were all limited to the range of 0 –1) were constrained to a single recollection value, 2(3) ⫽ 4.97. The single recollection parameter is hereafter denoted R. If R is constrained to equal 0, the fit becomes much worse, 2(1) ⫽ 26.62, so the model does suggest that recollection occurred even though it did not differ significantly for intact or rearranged pairs or for the weak and the strong conditions. In contrast to the recollection parameters, when the familiarity parameter was constrained to be equal across conditions (i.e., d⬘weak ⫽ d⬘strong), with all other parameters free to vary, the fit was dramatically worse, 2(1) ⫽ 27.75. Thus, two d⬘ values are needed for an adequate fit, one for each strength condition. The value of (the standard deviation of the strong intact and rearranged distributions relative to the weak intact and rearranged distributions) was estimated to be 1.61. When its value was constrained to equal 1, the fit was significantly worse, 2(1) ⫽ 10.39. Thus, according to this model, the strong intact and rearranged distributions had a higher variance than the corresponding weak distributions. The value of ␦ (the mean of the strong rearranged distribution) was estimated to be ⫺0.15, which did not differ significantly from 0. Table 2 shows the parameters of the most parsimonious DPSD model (in which only the d⬘ parameter differs as a function of strength). The upshot of this model-fitting exercise is that the main effect of the strength manipulation, according to the DPSD model, was to greatly increase the role played by unitized familiarity. Similar conclusions were reached when the full model was fit to the individual ROC data. Compared with a fit of the full model, constraining the four recollection parameters to a single value (R) while allowing d⬘ to vary across strength conditions did not significantly worsen the fit, 2(45) ⫽ 50.53. By contrast, constraining d⬘ be the same across strength conditions while leaving the recollection parameters free to vary (and to differ for intact and rearranged pairs) did significantly worsen the fit, 2(15) ⫽ 47.48.
Table 2 Maximum Likelihood Parameter Estimates and Chi-Square Goodness-of-Fit Statistics Based on a Fit of the Dual-Process Signal Detection Model to the Weak and Strong Receiver Operating Characteristic Data From Experiment 1 Level of analysis
R
␦
d⬘weak
d⬘strong
2
df
Group Individual
.37 .30
⫺0.26 ⫺0.04
1.61 1.75
0.20 0.35
1.33 1.62
27.6 176.0
10 146
CONTINUOUS RECOLLECTION VERSUS UNITIZED FAMILIARITY
Thus, as with the group fits, the most parsimonious DPSD model involves parameters that are fixed across strength conditions, except for d⬘, which varies across strength. The average parameter estimates based on the individual fits for this model are shown in Table 2. As with the group fit, the individual fits suggest that the effect of strengthening word pairs at study was to increase unitized familiarity while having a negligible effect on associative recollection. This has the effect of creating a more curvilinear ROC (and more linear z-ROC) in the strong condition compared with the weak condition. As a final check, we examined the parameter estimates obtained from fitting the full DPSD model (with all parameters free to vary) to the individual subject data. Although this model is clearly overparameterized, we used it to look for any trends that might be evident in the recollection parameters. According to the individual fits, the average estimate of RIntact decreased nonsignificantly as strength increased (from .33 to .30), whereas the average estimate of RRearr increased significantly with strength (from .31 to .48), t(14) ⫽ 2.34. The increase in RRearr reflects the fact that the strong ROC is slightly more asymmetrical than the weak ROC. When RIntact and RRearr were averaged together for each participant to estimate the overall proportion of test pairs that involved recollection, the estimate increased with strength from .32 to .39, a difference that did not approach significance. By contrast, the familiarity parameter (d⬘) exhibited a highly significant increase, t(14) ⫽ 4.89. Indeed, the estimated increase in familiarity as a function of strength was dramatic, as the magnitude of d⬘ was more than 5 times higher in the strong condition compared with the weak condition. We also analyzed the group and individual ROC data with simpler versions of the MSD and DPSD models. In these models, was set to 1. In addition, for the DPSD model, ␦ was set to 0. Although the fits were worse, the conclusions were unchanged. That is, in both cases, the ROC data are interpreted by the MSD model to mean that strengthening word pairs at encoding reduced the contribution of the noise distribution and by the DPSD model to mean that strengthening word pairs at encoding substantially increased unitized familiarity while having a much lesser effect on recollection. Conceivably, an effect of strength on recollection
B 1.0
Proportion of Intact Pairs
could have been detected had more observations been obtained for each participant (thereby increasing statistical power), but it is worth noting that the number of observations was sufficient to detect a highly significant effect of strength on familiarity. Remember– know judgments. The MSD and DPSD models agree that in the strong condition, performance was governed in a more pronounced way by two continuous distributions— one for intact pairs and one for rearranged pairs—than in the weak condition. According to one view, these two distributions reflect associative recollection (Kelley & Wixted, 2001); according to the other, they reflect unitized familiarity (Haskins et al., 2008). If the strengthening of word pairs at encoding increased recollection at retrieval (by decreasing the contribution of the noise distribution, as the MSD model assumes), then, according to a standard interpretation of remember– know judgments, the remember hit rate should increase as well. If the strength manipulation instead increased unitized familiarity (while having a much lesser effect on recollection, as the fit of the DPSD model suggests), then the know hit rate should increase with strength. Similar predictions apply to the rearranged pairs. For the intact pairs, the remember hit rate increased significantly as strength increased, t(14) ⫽ 6.01, whereas the know hit rate decreased slightly (see Figure 4A). For the rearranged pairs, the remember correct rejection rate also increased significantly as strength increased, t(14) ⫽ 3.71, whereas the know correct rejection rate decreased significantly, t(14) ⫽ 4.10 (Figure 4B). This outcome is more consistent with the idea that recollection was higher in the strong condition than the weak condition than with the idea that unitized familiarity selectively increased with strength. Recollection and familiarity are often estimated with the independence remember– know method. This method provides valid estimates if recollection is a threshold process, if remember and know judgments are process pure, and if recollection and familiarity are independent processes. Recollection is estimated by subtracting the remember false-alarm rate from the remember hit rate (for the intact pairs) and by subtracting the remember miss rate from the remember correct rejection rate (for the rearranged pairs). With that method, the mean estimate of recollection increased as a
Intact 0.8 Weak Strong
0.6
0.4
0.2
0.0
R-hit
K-hit
R-miss
K-miss
Proportion of Rearranged Pairs
A
851
0.8
Rearranged 0.6
0.4
0.2
0.0
R-CR
K-CR
R-FA
K-FA
Figure 4. Hit, miss, correct rejection (CR), and false-alarm (FA) rates associated with remember judgments (R– hit, R–miss, R–CR, and R–FA, respectively) and know judgments (K– hit, K–miss, K–CR, and K–FA, respectively) in the weak and strong conditions of Experiment 1, with the appropriate measures shown separately for intact pairs (A) and rearranged pairs (B). Error bars represent standard error of the mean.
852
MICKES, JOHNSON, AND WIXTED
function of strength from .39 to .64 for the intact pairs and from .34 to .58 for the rearranged pairs. Overall, this method estimates that the proportion of decisions based on recollection for all test pairs (intact and rearranged) increased significantly from .36 to .61, t(14) ⫽ 4.93. Thus, the interpretation of the data in terms of the remember– know procedure is that performance in the strong condition was largely based on associative recollection for both intact and rearranged pairs. This result is in accordance with the continuous recollection interpretation of the MSD model and is somewhat harder to reconcile with the unitized familiarity interpretation provided by the DPSD model (particularly for the intact pairs). However, the familiarity estimates computed with the independence remember– know method did accord reasonably well with the unitized familiarity estimates provided by the DPSD model. Specifically, familiarity d⬘ value was estimated to be 0.67 in the weak condition (averaged across estimates obtained from intact and rearranged pairs) and 1.40 in the strong condition (values that are not far from the values obtained by fitting the DPSD model, as shown in Table 2). Note that the estimated increase in familiarity does not mean that, according to the independence remember– know method, familiarity was actually used on a greater proportion of trials in the strong condition. Instead, it means that familiarity was a more diagnostic signal on those occasions when recollection failed. As indicated above, the independence remember– know method— but not the DPSD model— estimates that recollection was used for 36% of the pairs in the weak condition and 61% of the pairs in the strong condition. The effect of the strength manipulation on remember– know judgments made to rearranged pairs (see Figure 4B) is interesting in light of the fact that the manipulation had no measurable effect on the overall correct rejection and false-alarm rates (see Figure 2B). The most common interpretation of that result is that associative recollection and item familiarity were both higher in the strong condition compared with the weak condition. The increased associative recollection acts as a force to declare correctly the pair to be rearranged; the increased item familiarity acts as a force to declare incorrectly the pair to be intact (even though there is no reason why it should). These two opposing forces effectively cancel each other, thereby accounting for the fact that the strength manipulation appears to have no effect on responses to rearranged pairs. In agreement with this interpretation, Buchler et al. (2008) found that the false-alarm rate to rearranged pairs increased dramatically with strength when the two items of the strong rearranged pairs had been repeated five times, but always as part of different pairs. This would serve to greatly increase item familiarity without increasing the ability to confidently recollect the original pairing for the items (because they were previously paired with so many different items). As such, the false-alarm rate should—and did—increase. Despite the fact that the false-alarm rate remained unchanged as a function of strength in the present experiment, the remember– know data show that the manipulation did have an effect after all, and the increased proportion of remember responses to correct rejections in the strong condition is consistent with the idea that associative recollection was, indeed, higher in that condition. However, item familiarity is also presumably higher in that condition, which would serve to offset the effect of increased recollection if high item familiarity is inappropriately taken by the participant to indicate that the pair is intact.
Cued recall. For intact and rearranged pairs, cued recall for the originally paired item was higher in the strong condition (M ⫽ .76 and .66, respectively) than in the weak condition (M ⫽ .57 and .44, respectively). An analysis of variance performed on these data yielded significant effects of strength, F(1, 14) ⫽ 59.6, and pair status, F(1, 14) ⫽ 24.1, but the interaction was not significant. The fact that cued recall was higher for items that had earlier appeared as part of intact pairs suggests that recall performance for rearranged pairs may have suffered interference because participants saw the incorrect associate during the recognition test (indeed, the incorrect associate was mistakenly recalled for 13% of the rearranged pair cues) and/or that recall performance for intact pairs was facilitated because participants saw the correct associate during the recognition test. However, these effects did not interact with strength. In both the weak condition and the strong condition, cued recall was higher for correct remember judgments than for correct know judgments, and this was true for both intact pairs (R– hit vs. K– hit; see Figure 5A) and rearranged pairs (R–CR vs. K–CR; Figure 5B). An analysis of variance performed on the data for the intact pairs yielded a significant effect of type of judgment (remember vs. know), F(1, 11) ⫽ 17.9, but no effect of strength. Thus, although remember hits were more common in the strong condition (and know hits less common) compared with the weak condition, the cued recall advantage for remember hits was similar in both conditions. An analysis of variance performed on the data for the rearranged pairs yielded a significant effect of type of judgment (remember vs. know), F(1, 13) ⫽ 5.1, and a significant effect of strength, F(1, 13) ⫽ 6.4, but no hint of an interaction. That is, remember judgments were associated with higher cued recall accuracy than know judgments for rearranged pairs, but cued recall accuracy for both remember and know judgments was higher in the strong condition compared with the weak condition. The effect of strength in this case could mean that a rearranged pair had to achieve a higher degree of recollection to be given a remember or a know judgment in the strong condition than in the weak condition because, in the strong condition, recollection was working against the opposing force of increased item familiarity. The fact that cued recall accuracy was substantially higher for remember judgments than for know judgments validates the notion that remember judgments made during the recognition test reflect greater recollection than know judgments, and it is consistent with the idea that recollection was higher in the strong condition relative to the weak condition (because remember judgments increased as strength increased). This validity test is important because a common concern is that inadequate instructions could lead participants to say “remember” when familiarity is strong instead of when the recognition decision is based on recollection. These findings are consistent with the idea that a remember judgment was made when recollection was strong. Cued recall performance was generally low for remember and know misses (see Figure 5A), though it was relatively high for remember and know false alarms (Figure 5B). This asymmetry may again reflect the fact that high item familiarity is taken by the participant as evidence that a rearranged pair is intact. Thus, even though recollection for some of those pairs is reasonably high (encouraging a rearranged decision), strong item familiarity for those same pairs may have induced the participant to respond “intact” anyway.
CONTINUOUS RECOLLECTION VERSUS UNITIZED FAMILIARITY
A
B 1.0
Intact 0.8 Weak Strong
0.6
0.4
0.2
Proportion Recalled
1.0
Proportion Recalled
853
0.0
Rearranged 0.8
0.6
0.4
0.2
0.0
R-hit
K-hit
R-miss
K-miss
R-CR
K-CR
R-FA
K-FA
Figure 5. Proportion of items recalled on an unexpected cued recall test administered after the associative recognition test. The recall data are shown separately for hits, misses, correct rejections (CR), and false alarms (FA) associated with remember judgments (R– hit, R–miss, R–CR, and R–FA, respectively) and know judgments (K– hit, K–miss, K–CR, and K–FA, respectively) in the weak and strong conditions of Experiment 1, with the appropriate measures shown separately for intact pairs (A) and rearranged pairs (B).
A question of particular interest concerns the relationship between confidence in the intact-versus-rearranged recognition decision and the probability of later successful cued recall. If associative recognition decisions are based on continuous recollection, one would expect that relationship to be strong. Figure 6A shows the relationship for the intact pairs, and Figure 6B shows the relationship for the rearranged pairs. The data were collapsed across adjacent confidence ratings to reduce variability. For the statistical analysis of these results, the data were also collapsed across the weak and strong conditions because a more fine-grained analysis would have too many missing values. For the intact pairs (Figure 6A), higher confidence that the pair was intact was associated with greater cued recall performance, F(2, 26) ⫽ 32.83. For the rearranged pairs (Figure 6B), the highest levels of confidence that the pair was rearranged were also
A
associated with the highest cued recall accuracy, but the relationship was somewhat flatter thereafter. Still, the effect of confidence was significant, F(2, 28) ⫽ 4.14, reflecting the fact that recall accuracy was highest for the most confident rearranged decisions. Once again, the flattening of the confidence– accuracy function (relative to the relationship obtained for intact pairs) may reflect the fact that high item familiarity is inappropriately interpreted by the participant as evidence that the pair is intact. If so, then recollection could be fairly strong for some rearranged pairs (which, alone, might support a confidence rating of 1, 2, or 3), but the effect is offset by high item familiarity (leading to a rating of 4, 5, or 6). Whether or not that explanation is correct, the main point is that confidence in an intact-versus-rearranged recognition decision for a test pair is clearly related to the degree of later recollection for that pair.
B 1.0
1.0
0.8
Rearranged
Weak Strong
Proportion Recalled
Proportion Recalled
Intact
0.6
0.4
0.2
0.0
0.8
0.6
0.4
0.2
0.0
1-2
3-4
5-6
Intact/Rearranged Recognition Confidence
1-2
3-4
5-6
Intact/Rearranged Recognition Confidence
Figure 6. Proportion of items recalled on an unexpected cued recall test administered after the associative recognition test as a function of confidence in the intact-versus-rearranged recognition decision for intact pairs (A) and rearranged pairs (B) for the weak and strong conditions of Experiment 1. To reduce variability, the data were averaged over adjacent values on the 6-point confidence scale. Error bars represent standard error of the mean.
MICKES, JOHNSON, AND WIXTED
854
Overall, the remember– know and cued recall data suggest that recollection increased substantially with strength for both intact and rearranged pairs and that the increased recollection was associated with a more curvilinear ROC. In addition, particularly for intact pairs, confidence in the intact–rearranged recognition decision was strongly related to the accuracy of later cued recall (in continuous fashion). All these findings are consistent with the idea that recollection is a continuous process that yields a curvilinear ROC. This interpretation is easily reconciled with the MSD model depicted in Figures 1A and 1B. By contrast, the findings are less consistent with those of the DPSD model, according to which the strengthening of pairs on the study list dramatically increased unitized familiarity while also modestly increasing recollection for rearranged pairs only. Evidence from the remember– know procedure offered no suggestion that the effect of the strength manipulation was mainly attributable to increased unitized familiarity for the intact pairs, as the DPSD model suggests. Instead, the evidence suggests that recollection increased substantially for intact pairs as well as rearranged pairs. In addition, even for the strong condition, the relationship between confidence in the recognition decision for intact pairs and later cued recall was very strong (as if recollection had a pronounced role in the recognition decisions for those pairs). It is, of course, possible that unitized familiarity increased with strength as well (as the independence remember– know estimates imply), but there is nothing to suggest that this was the dominant force in the strong condition. Indeed, the remember– know data suggest that more than 60% of the decisions in that condition were based on recollection, and the cued recall data are consistent with that estimate as well (with average cued recall accuracy in the strong condition exceeding 70% correct). The recollection estimates provided by the DPSD model are much lower than that because the ROC in the strong condition was quite curvilinear and was essentially symmetrical. Had a more pronounced asymmetry been observed in the strong condition, then the recollection estimates provided by the DPSD model would have been higher as well (and the MSD model would need to be modified to accommodate that asymmetry). However, for these materials, a relatively symmetrical ROC was obtained, as Kelley and Wixted (2001) found for the unrelated word pairs they used, and this allowed for a clearer test of the two models. Although the results of Experiment 1 were more sensibly interpreted by the MSD model than by the DPSD model, it could be argued that the failure of the DPSD model to detect an increase in recollection as a function of strength was a Type II error (even though the data were sufficient to detect a highly significant increase in familiarity as a function of strength). Thus, in Experiment 2, we approached the same issue from a different angle.
Experiment 2 In Experiment 1, we asked whether the curvilinear ROC (and linear z-ROC) that is reliably observed when associative recognition is strong reflects a continuous recollection process or a unitized familiarity process. The remember– know and cued recall results both supported the continuous recollection interpretation and were harder to reconcile with the unitized familiarity interpretation. In Experiment 2, we asked why, when associative recognition is weak, the ROC tends to be nearly linear (linear enough, at least, to reliably yield a curvilinear z-ROC).
The DPSD model assumes that the curvilinear z-ROC reflects a threshold recollection process (see Figure 1C), whereas the mixture model assumes that it reflects the contribution of noise (see Figure 1A). An exactly analogous debate has occurred with respect to source memory ROCs. In a source recognition procedure, items on a list are presented with different to-be-recollected details (e.g., some items are presented on the left side of the screen and others on the right). On a later recognition test, items are first presented in source-neutral fashion (e.g., at the center of the screen) for an old–new decision followed by a source recollection judgment (e.g., was the item presented on the left or on the right?). When confidence ratings are taken for both decisions, the item and source ROCs can be plotted separately, and the source ROC is often conspicuously more linear than the item ROC (Yonelinas, 1999). Because source memory decisions are often thought to be based on recollection, the fact that the source memory ROC is sometimes linear (and the z-ROC is almost always curvilinear) has been taken to support the idea that recollection is a threshold process instead of a continuous process. An alternative explanation is that the ROC anomalies observed on source memory tests instead reflect a mixture model caused by the absence of source information for a subset of the test items. DeCarlo (2003) demonstrated the viability of the MSD account of source memory as an alternative to the notion of threshold recollection by showing, for example, that it predicts the curvilinear z-ROCs that are often interpreted as reflecting recollection. A direct and compelling demonstration of the validity of the mixture model was provided by Slotnick and Dodson (2005), who reanalyzed the linear source ROC data reported by Yonelinas (1999) by partitioning the data according to the confidence ratings made during the old–new phase. That is, instead of plotting one source ROC using all the data, as Yonelinas (1999) had done, they plotted separate source ROCs according to the confidence in the old–new decisions. Some target items, for example, were not recognized as having appeared on the list (i.e., they were mistakenly declared to be new). The source ROC for these items fell along the chance diagonal, which provides direct evidence for the existence of a noise distribution (i.e., a subset of target items for which no differential source information was available). Of particular interest was the source ROC constructed solely from items that had received a high-confidence old–new decision. According to the DPSD model, any recollection that occurs during the old–new phase would yield an old–new decision made with high confidence. Thus, excluding responses made with lower old–new confidence from the source ROC analysis would theoretically exclude only nonrecollection-based decisions, so the natural expectation is that the shape of the ROC would remain linear. Instead, the source ROC for that condition (i.e., the condition in which recollection was theoretically preserved) was quite curvilinear and was accurately described by the signal detection model. Wixted (2007) argued that this is direct evidence for a continuous recollection signal, though Parks and Yonelinas (2007) argued that it instead reflects unitized source familiarity. In an associative recognition task, a similar analysis is generally not possible because the intact–rearranged decision is not typically preceded by an old–new decision. In Experiment 2, we modified the standard associative recognition procedure by including an old–new question for each pair prior to the intact-versusrearranged question. More specifically, for each pair of items,
CONTINUOUS RECOLLECTION VERSUS UNITIZED FAMILIARITY
ciative recognition ROC constructed with pairs that received highconfidence old–new decisions is curvilinear, then these associative recognition decisions should be largely accompanied by know judgments if that curvilinearity reflects unitized familiarity. If, instead, this refined ROC reflects continuous recollection, then these associative recognition decisions should be largely accompanied by remember judgments.
participants were asked to indicate, using a 6-point confidence scale, whether the items of the pair were new (i.e., neither word appeared on the study list) or old (i.e., both words appeared on the study list), regardless of whether they are now intact or rearranged. After making the old–new decision, they were then asked whether the pair was intact or rearranged (again, using a 6-point confidence scale). One question of interest was whether we would find direct evidence of a noise distribution by plotting the associative recognition ROC for pairs constructed using intact and rearranged pairs consisting of items that were not recognized as having been presented on the list. An ROC constructed from intact and rearranged pairs drawn from the noise distribution should fall along the diagonal (indicating chance performance for these noise pairs). Such a result would provide direct evidence in support of a basic assumption of the MSD model. Another question of interest was whether excluding these items (which would retain any recollection-based decisions) would yield a linear z-ROC or a curvilinear z-ROC. A continuous recollection MSD model predicts a linear z-ROC under these conditions (because the noise items were removed). By contrast, the DPSD model predicts a curvilinear z-ROC (because recollection-based responses would be retained in this analysis). The former outcome would parallel what has been observed on source recognition tasks (Slotnick & Dodson, 2005). As indicated above, Parks and Yonelinas (2007) argued that the curvilinear source ROC that Slotnick and Dodson (2005) found when the source ROC was constructed using high-confidence old–new decisions (decisions generally thought to be based largely on recollection) was indicative of strong, unitized source familiarity, a concept that is similar to the notion of unitized familiarity that has been advanced to explain curvilinear associative recognition ROCs. According to this idea, an item and its source can be unitized in such a way that successful source memory can be based on familiarity (leading to a curvilinear ROC), not threshold recollection, as had been generally assumed in the past. The same idea could be brought to bear on the associative recognition procedure should the results mirror those obtained using a source memory procedure. To investigate that possibility, in Experiment 2, we also made use of the remember– know procedure. If the refined asso-
Method Participants. Thirty undergraduates from the University of California, San Diego, participated for psychology course credit. Materials and design. The pairs were the same semantically related words as those used for Experiment 1. Procedure. The procedures were similar to the weak condition of Experiment 1 in that the pairs were semantically related, presented once each for 2 s, and counterbalanced for intact and rearranged pairs, and they remained in their original positions (first or second word of the pair) on the old–new and associative recognition tests. For the old–new test, we introduced 24 new word pairs randomly intermixed with 88 word pairs (44 intact and 44 rearranged) from the study list, for a total of 112 pairs. Participants first indicated whether the word pairs were new (by entering a rating from 1 to 3, indicating increasing uncertainty that the words were not on the list) or old (by entering a rating from 4 to 6, indicating increasing certainty that the words had been on the list). Participants then indicated on a 6-point scale whether each pair was intact or rearranged (i.e., 1 ⫽ definitely rearranged, 2 ⫽ probably rearranged, 3 ⫽ maybe rearranged, 4 ⫽ maybe intact, 5 ⫽ probably intact, and 6 ⫽ definitely intact). Finally, participants indicated whether they remembered or knew whether the word pairs were intact or rearranged.
Results Six participants performed no better than chance on the associative recognition tests, and they were excluded from further consideration. As such, the analyses presented below are based on 24 participants. Figure 7A shows the group ROC for the associa-
B 1.0
2.0
0.8
1.5 z-Hit Rate
Hit Rate
A
855
0.6 0.4 0.2
1.0 0.5 0.0 -0.5
0.0 0.0
0.2
0.4
0.6
FA Rate
0.8
1.0
-1.0 -2.0 -1.5 -1.0 -0.5 0.0
0.5
1.0
z-FA Rate
Figure 7. Associative recognition receiver operating characteristic (ROC) data (A) and z-ROC data (B) from Experiment 2. The curves represent least squares fit of a second-order polynomial. FA ⫽ false alarm.
MICKES, JOHNSON, AND WIXTED
856
tive recognition test using all the data, irrespective of the old–new confidence ratings (i.e., the data are “collapsed” over the old–new ratings). Because old–new ratings are not typically obtained in associative recognition tasks, this ROC is a typical associative recognition ROC, and it is comparable to the weak ROC in Experiment 1 (because, in both cases, the pairs were presented only once at study). Figure 7B shows the corresponding z-ROC. Once again, second-order polynomials were fit to these data, and both the ROC and z-ROC exhibit curvilinearity. The quadratic coefficient for the ROC was ⫺1.27, whereas the corresponding value for the z-ROC was 0.22 (a typical value). Collapsed ROC analyses. The main purpose of Experiment 2 was to identify pairs experimentally for which no associative information was encoded and to exclude them from the analysis to see what the shape of the ROC would be for the remaining pairs (for which associative information was encoded). Before excluding any pairs, we first fit the MSD model and the DPSD model to the collapsed ROC data. The full MSD model involves nine parameters (the five confidence criteria, Intact, Rearr, , and ). The group ROC fit was very good, 2(1) ⫽ 0.89. In addition, the estimated value of was 3.65 (similar to that of Experiment 1), but the quality of the group fit was not significantly impaired by setting equal to 1, 2(1) ⫽ 2.00, so we used that constraint in all further fits. This had the advantage of equating the number of free parameters between the MSD model and the DPSD model (which no longer has a parameter or a ␦ parameter because there is no within-list strength manipulation). That is, for these fits, the MSD model had three main parameters (Intact, Rearr, and ), and so did the DPSD model (RIntact, RRearr, and d⬘). Table 3 shows the maximum likelihood fit of the MSD model to the group ROC data shown in Figure 7. Also shown are the results obtained from fitting individual ROC data from 21 of the participants (three participants used too few ratings to fit either model). Clearly, for the MSD model, the curvilinearity of the collapsed z-ROC is attributable to the mixture parameter () taking on a value greater than 0, and its value significantly exceeds 0 in both the group fit, 2(1) ⫽ 16.16, and the individual fits, 2(42) ⫽ 58.44. Table 4 shows the maximum likelihood fit of the DPSD model to the group ROC data shown in Figure 7. Also shown are the results obtained from fitting individual ROC data from 21 of the participants. For the DPSD model, the curvilinearity of the collapsed z-ROC is attributable to threshold recollection (RRearr and RIntact) taking on values greater than 0. Unlike in Experiment 1, RIntact was significantly greater than RRearr for both the group fit, 2(1) ⫽ 19.05, and the individual fits, 2(21) ⫽ 33.11. In addition,
Table 3 Maximum Likelihood Parameter Estimates and Chi-Square Goodness-of-Fit Statistics Based on a Fit of the Mixture Signal Detection Model to the Associative Recognition Receiver Operating Characteristic Data From Experiment 2 Level of analysis
Rearr
Intact
df
2
Group Individual
⫺1.09 ⫺1.43
2.14 2.36
.51 .62
2 37
2.89 51.25
Note. Rearr ⫽ rearranged.
Table 4 Maximum Likelihood Parameter Estimates and Chi-Square Goodness-of-Fit Statistics Based on a Fit of the Dual-Process Signal Detection Model to the Associative Recognition Receiver Operating Characteristic Data From Experiment 2 Level of analysis
RRearr
RIntact
d⬘
df
2
Group Individual
.08 .25
.38 .33
0.63 0.46
2 37
3.15 51.96
Note. Rearr ⫽ rearranged.
constraining RRearr and RIntact to 0 significantly worsened the group fit, 2(2) ⫽ 19.05, and the effect was marginally significant for the individual fits as well, 2(42) ⫽ 57.73, p ⫽ .054. Thus, for collapsed data, the curvilinearity of the z-ROC is interpreted by this model to reflect the contribution of threshold recollection. Conditional ROC analyses. To investigate further the nature of the curvilinear z-ROC, we constructed three associative recognition ROCs (and corresponding z-ROCs) that were conditional on the old–new confidence ratings. The first conditional ROC was based on associative recognition decisions that were made to intact and rearranged pairs that had received ratings of 1, 2, or 3 in response to the old–new question. That is, this ROC and z-ROC were based on intact and rearranged pairs consisting of items that were not recognized as having appeared on the study list (20% of the intact pairs and 32% of the rearranged pairs fell into this category). The second conditional ROC was based on associative recognition decisions that were made to intact and rearranged pairs that had received ratings of 4 or 5 on the old–new portion of the test. That is, this ROC and its corresponding z-ROC were based on intact and rearranged pairs consisting of items that were recognized as having appeared on the study list with low or medium confidence (7% of the intact pairs and 10% of the rearranged pairs fell into that category). The third conditional ROC was based on associative recognition decisions that were made to intact and rearranged pairs that had received ratings of 6 on the old–new portion of the test (73% of the intact pairs and 58% of the rearranged pairs fell into that category). The conditional ROCs and z-ROCs are shown in Figure 8. The curves drawn through the ROC data reflect the best fitting EVSD model. This model was used to characterize the data because both the DPSD model and the MSD model reduce to the equal-variance model when they are fit to these data. That is, the recollection parameters of the DPSD model do not differ significantly from 0 for any of the three fits, and nor does the mixture parameter of the MSD model. The maximum likelihood estimates of d⬘ based on the fit of the EVSD model to the conditional ROCs are shown in Table 5. These estimates show that the associative recognition d⬘ increases dramatically as old–new confidence increases. The curves drawn through the z-ROC in Figure 8 represent the best fitting second-order polynomial, and the quadratic coefficients for these fits are also shown in Table 5. For the first conditional ROC (Figure 8A), the points essentially fall along the diagonal line, which indicates that no associative information—recollection based or familiarity based—was available for these pairs. The corresponding z-ROC (Figure 8B) was quite curvilinear, with a quadratic coefficient equal to 0.33 (see
CONTINUOUS RECOLLECTION VERSUS UNITIZED FAMILIARITY
A 1.0
B
1
z-Hit Rate
Hit Rate
0.8 0.6 0.4 0.2
C
0.0 0.0 1.0
-1
-2 0.2
0.4
0.6
0.8
1.0
-2
D
0.8
-1
0
1
2 1
z-Hit Rate
Hit Rate
0
0.6 0.4
0 -1
0.2 -2 0.0
E
0.2
0.4
0.6
0.8
1.0
-3
F
2.0
z-Hit Rate
0.0 1.0
1.5
-2
-1
0
1
Hit Rate
0.8 0.6 0.4
1.0
0.2 0.0 0.0
0.5 0.2
0.4
0.6
FA Rate
0.8
1.0
-0.8
-0.4
0.0
0.4
z-FA Rate
Figure 8. Associative recognition receiver operating characteristic (ROC) and z-ROC data from Experiment 2 for pairs consisting of items not recognized as having appeared on the list (A and B, respectively), for pairs of items recognized as having appeared on the list with low or medium confidence (C and D, respectively), and for pairs of items recognized as having appeared on the list with high confidence (E and F, respectively). The curves drawn through the ROC data in the left panels represent the best fitting equal-variance signal detection model according to maximum likelihood estimation; the curves drawn through the z-ROC data in the right panels represent the least squares fit of a second-order polynomial. FA ⫽ false alarm.
Table 5), but this is probably due to random error. Had the ROC points fallen exactly along the diagonal, for example, the z-ROC would have been linear. When the EVSD model was fit to these associative recognition ROC data (i.e., to the O/N 1–3 conditional ROC), the estimated d⬘ was, not surprisingly, indicative of essentially chance performance (see Table 5). Direct evidence in favor of the MSD account is provided by the fact that a substantial number of test pairs contain no associative information. The existence of these items alone—and their existence does not appear to be in doubt— could cause the collapsed z-ROC to exhibit the curvilinearity that is often interpreted to reflect a threshold recollection process, and it could explain why the DPSD model often fits collapsed ROC better than the standard signal detection model. Moreover, only the MSD model clearly predicts that the selective removal of these items from the ROC analysis will yield a symmetrically curvilinear ROC. In accordance with this prediction, both the O/N 4 –5 and O/N 6 conditional
857
ROCs are well fit by the EVSD model, and the quadratic coefficients for the corresponding z-ROCs are close to 0 (see Table 4). Thus, these results are consistent with the model depicted in Figures 1A and 1B. If associative recognition decisions are based largely on recollection, as is typically assumed, these results are also consistent with the idea that recollection is a continuous process. The fact that associative recognition performance for the O/N 4 –5 pairs is intermediate between the O/N 1–3 pairs and the O/N 6 pairs suggests that associative information may not be actually encoded in the categorical fashion that the MSD model envisions (i.e., there may not be a sharp distinction between encoded pairs and not-encoded pairs). Instead, some pairs receive no attention at encoding, some receive partial attention, and some receive full attention. However, the present data can be effectively characterized by the MSD model because the large majority of the pairs fell into the two extreme conditions. More specifically, 26% fell into the O/N 1–3 condition and 66% fell into the O/N 6 condition, with only 8% falling into the intermediate O/N 4 –5 condition. The DPSD model provides a different interpretation of these conditional ROC results, and it is an interpretation that differs from the one that it offers for the collapsed ROC (according to which threshold recollection played an important role). The existence of the no-information test pairs represented in Figure 8A is not predicted by the DPSD model but could be accommodated by assuming that (a) the information for these items falls below a recollection threshold and (b) these same items were not associated with high enough item familiarity to be recognized as old (on the initial old–new test) and were also not associated differential amounts of unitized familiarity (which might have yielded abovechance performance on the associative recognition test). In the DPSD model, recollection and familiarity are usually assumed to be independent processes, so this would be an unexpected outcome. However, if the independence assumption is dropped, the subset of pairs with no associative information can be assumed to involve below-threshold recollection, low item familiarity, and no unitized associative familiarity. It is somewhat more challenging for the DPSD model to explain the conditional ROC derived from old–new confidence ratings of 6 (see Figure 8E). This old–new confidence category has special theoretical significance because the DPSD model assumes that any
Table 5 Parameter Estimate and Chi-Square Goodness-of-Fit Statistics From a Maximum Likelihood Fit of the Equal-Variance Signal Detection (EVSD) Model to the Receiver Operating Characteristic (ROC), and Quadratic Coefficients From a Least Squares Fit of a Second-Order Polynomial to the z-ROC, for the Collapsed Associative Recognition ROC and for the Three Conditional ROCs From Experiment 2 EVSD ROC
d⬘
2(4)
z-ROC quadratic coefficient
Collapsed O/N 1–3 O/N 4–5 O/N 6
1.17 0.09 0.51 1.63
19.56 5.50 0.51 4.28
0.22 0.33 0.04 0.03
MICKES, JOHNSON, AND WIXTED
recollection-based decisions that occurred during the old–new phase received a high-confidence rating (i.e., a rating of 6). To the extent that recollection occurs, according to this model, the slope of the old–new z-ROC should be less than 1—more so the more that recollection occurs (Glanzer, Kim, Hilford, & Adams, 1999). For these data, the old–new z-ROC has a slope of 0.59, indicating a considerable degree of recollection according to the DPSD model. Given that intact and rearranged pairs were presented for old–new decisions, it is reasonable to suppose that much of this recollection involved associative recollection (the kind that would serve to distinguish between intact and rearranged pairs on the subsequent question). If associative recollection is a high-threshold process, and if it occurred for many of the pairs that received a high-confidence old–new decision, then the conditional associative recognition ROC constructed from these pairs should be much too linear to be accurately described by the signal detection model (and the curvilinearity of the corresponding z-ROC should be pronounced). However, the O/N 6 associative recognition ROC is clearly curvilinear, and the corresponding z-ROC was again nearly linear, with a quadratic coefficient equal to only 0.03 (see Table 4). The only explanation that can be offered by the DPSD model is that these pairs mainly involved unitized familiarity, an idea that curiously leaves little room for recollection in any of the intactversus-rearranged decisions in spite of the estimates obtained from fitting the collapsed ROC (which were significantly greater than 0). More specifically, the recollection parameters of the DPSD model (RRearr and RIntact) represent estimates of the proportion of the rearranged pairs and proportion of the intact pairs included in the ROC analysis that involved threshold recollection. For the collapsed ROC, RRearr and RIntact were estimated to be .08 and .38, respectively, for the group ROC fit and .25 and .33, respectively, for the individual ROC fits (Table 4). When pairs that theoretically do not involve recollection were dropped from the ROC analysis, as was the case for the O/N 6 conditional analysis, these estimated proportions should increase accordingly (again, because theoretically only nonrecollection-based pairs were removed). Indeed, because 35% of nonrecollection pairs were dropped from this ROC analysis, the recollection parameters would be expected to increase by approximately 50%. Instead, for that ROC analysis, the estimated values of RRearr and RIntact did not differ significantly from 0, and the EVSD model adequately characterized the data. We also fit the EVSD model to the individual O/N 6 associative recognition ROC data from the 16 participants who yielded enough observations for us to perform such an analysis. As with the group data, the individual ROC data did not differ significantly from the predictions based on the EVSD model, 2(57) ⫽ 69.69. Thus, the need for recollection parameters disappeared when, theoretically, items not involving recollection were removed from the analysis (an adjustment that should have dramatically increased the recollection estimates if the DPSD model is correct). The failure to detect the need for recollection parameters in this analysis could reflect a lack of power because the conditional analysis was based on fewer observations than the full analysis. However, offsetting that concern is the fact that the DPSD model predicts that this conditional analysis (which was restricted to pairs that received a high-confidence old decision) should dramatically increase the estimated proportion of recollected pairs (because theoretically only pairs not involving recollection were excluded
from the analysis) and should cause the z-ROC to be more curvilinear. No hint of this effect was observed. Because the EVSD model adequately characterizes these conditional ROC data, the DPSD model interprets the above-chance ROC data in Figure 8C to reflect the virtual absence of threshold recollection (an interpretation also implied by the linear z-ROC obtained in that condition). The only way for the DPSD model to explain these results is to assume that associative recognition performance for the high-confidence old–new pairs was based on unitized familiarity (cf. Parks & Yonelinas, 2007). If so, this suggests that the above-zero recollection estimates from the fit of the DPSD model to the collapsed ROC (see Table 3) were not actually measuring recollection because recollection is difficult to detect when the conditional ROCs are separately examined. Thus, in light of the conditional ROC analyses, it seems likely that the recollection parameters estimated from the collapsed ROC analysis were capturing the contribution of the noise distribution envisioned by the MSD model. Remember– know judgments. One account views the increasingly curvilinear conditional ROCs and the increasing d⬘ values associated with increasing old–new confidence (see Table 4) to reflect increasing associative recollection (i.e., the continuous recollection interpretation of the MSD model). The other views that same phenomenon to reflect increasing unitized familiarity (i.e., the DPSD model). If the former interpretation is correct, one would expect remember judgments for associative recognition decisions to increase with old–new confidence. If the latter interpretation is correct, one would instead expect know judgments for associative recognition decisions to increase with old–new confidence. Figure 9 shows the remember– know data collapsed across intact and rearranged pairs (R⫹ indicates correct remember judgments to intact and rearranged pairs; R⫺ indicates incorrect remember judgments to intact and rearranged pairs), and it is clear that correct remember judgments increased dramatically for the strongest conditional ROC, whereas know judgments decreased dramatically (K⫹ indicates correct know judgments to intact and rearranged pairs; K⫺ indicates incorrect know judgments to intact and rearranged pairs). We again used the independence remember– know method to compute estimates of recollection and familiarity (estimates that 1.0
Proportion of Intact and Rearranged Pairs
858
Old/New 1-3 Old/New 4-5 Old/New 6
0.8
0.6
0.4
0.2
0.0
R+
R-
K+
K-
Figure 9. Proportion of correct and incorrect remember judgments (R⫹ and R⫺, respectively) and correct and incorrect know judgments (K⫹ and K⫺, respectively) for the three conditional receiver operating characteristics shown in Figure 8. Error bars represent standard error of the mean.
CONTINUOUS RECOLLECTION VERSUS UNITIZED FAMILIARITY
are valid if recollection is a threshold process and recollection and familiarity are independent processes). The estimates were computed separately for intact and rearranged pairs and then averaged together for the three conditional ROC conditions. The estimated recollection estimates for the O/N 1–3, O/N 4 –5, and O/N 6 conditions were .01, .08 and .40, respectively. The corresponding d⬘ familiarity estimates were ⫺0.13, 0.85, and 0.99. Thus, as with Experiment 1, the estimates suggest that recollection as well as familiarity plays a large role in the stronger condition (which, in this case, was the O/N 6 condition). Even so, the ROC was well characterized by the curvilinear EVSD model. This result supports the continuous recollection interpretation of the curvilinear associative recognition ROC.
General Discussion We addressed two main issues in this research. The first issue is whether the curvilinearity of an associative recognition ROC, which is more likely to be observed when memory is strong, reflects a continuous recollection process or a continuous unitized familiarity process. The second issue is whether the curvilinearity of an associative recognition z-ROC, which is more likely to be observed when memory is weak, reflects a categorical recollection process or reflects the influence of noise caused by the inclusion of intact and rearranged test pairs for which no associative information is available. The answers to these questions bear on the nature of the dual-process theory of recognition memory as well as on the search for the neuroanatomical correlates of recollection and familiarity (a search that is guided by dual-process theory and that makes considerable use of associative recognition procedures). With regard to the first question, the results suggest that a curvilinear associative recognition ROC reflects a continuous recollection process, not a unitized familiarity process. More specifically, in Experiment 1, increasing the strength of pairs by presenting them multiple times on a study list greatly increased the curvilinearity of the ROC while also increasing the proportion of correct remember judgments and increasing cued recall accuracy on a subsequent (unexpected) test. In addition, the degree of confidence in intact-versus-rearranged recognition decisions was directly related to the accuracy of subsequent cued recall (as if higher degrees of recollection were associated with higher levels of recognition confidence). All of this occurred even though the DPSD model, when fit to the weak and strong ROC data, suggested that the effect of the strength manipulation was to dramatically increase unitized familiarity while having a lesser effect on categorical recollection. The remember– know and cued recall results instead suggest that recollection increased considerably with strength (as intuition would suggest) and that the increased recollection was accompanied by an increasingly curvilinear ROC. The fact that the ROC becomes more curvilinear when recollection increases is consistent with the idea that recollection is a continuous process. With regard to the second issue, the results suggest that the curvilinear z-ROC that is often observed on associative recognition tasks when memory is relatively weak does not result from a categorical recollection process but instead results from the inclusion of intact and rearranged test pairs for which no associative information is available. That is, the results suggest that an MSD applies (see Figure 1A). In support of that idea, 25% of the intact
859
and rearranged test pairs consisted of items that were not even recognized as having appeared on the list when they were presented on an old–new recognition test. For the pairs made up of these unrecognized items, intact-versus-rearranged recognition performance was at chance. This result provides direct evidence for the existence of a noise distribution that is intermixed with the intact distribution and rearranged distribution. When these noinformation items are omitted from the analysis, the ROC becomes curvilinear and the z-ROC becomes linear, leaving virtually no sign of what in the past has been taken as evidence of a categorical recollection process (i.e., the curvilinear z-ROC that is reliably observed when collapsed associative recognition ROCs are analyzed). The curvilinear ROC that remains when these noise items are removed from the analysis is associated with an increased proportion of remember judgments, and this is particularly true of the conditional associative recognition ROC constructed from items that were, on an initial old–new test, recognized as having appeared on the list with high confidence (items that seem likely to be associated with a high degree of recollection). As with the results of Experiment 1, in which strength was manipulated across conditions, this again suggests that strong associative recognition ROCs, which are accurately characterized by signal detection theory, are largely based on recollection. That, in turn, is consistent with the idea that recollection is a continuous process. It is important to clarify the difference between a noise distribution as envisioned by the mixture model and the notion of below-threshold recollection, which is how a threshold recollection model would explain the 25% of test pairs in Experiment 2 that were devoid of associative information. The noise items in a mixture model reflect the absence of differential recollection for intact and rearranged pairs, but they do not reflect the absence of a recollection signal. According to this model, participants query memory for an associative signal in the same way for every pair, and every pair returns a recollection signal that falls in a range that extends from a strong sense that the pair is rearranged to a strong sense that the pair is intact. This is true even for the subset of pairs drawn from the noise distribution. In a threshold recollection model, by contrast, an associative recollection signal is either present or absent. For the pairs that are devoid of associative information, the assumption would be that the recollection signal is absent, in which case responding would be based on some other process (item familiarity, unitized familiarity, or guessing). One problem with this way of thinking is that when these noise items were removed from the ROC analysis in Experiment 2, there was little, if any, sign of above-threshold recollection despite the fact that the pairs remaining in the analysis were associated with considerable associative information. Thus, although the threshold recollection account can accommodate the absence of recollection for some items, the apparent disappearance of recollection-based decisions when the noise items are removed from the analysis presents a dilemma for this account. These conclusions are the same as those reached by Slotnick and Dodson (2005) in their conditional ROC analysis of source memory. Our Experiment 2 was, in fact, modeled on the conditional ROC analysis that they performed for a source memory procedure. Source memory ROCs typically exhibit the same trends that associative recognition ROCs exhibit (i.e., curvilinear ROCs and curvilinear z-ROCs), and these ROC trends have been taken to reflect a categorical recollection process (Yonelinas, 1999). However,
860
MICKES, JOHNSON, AND WIXTED
Slotnick and Dodson found that the curvilinearity of the z-ROC was an artifact caused by the inclusion of weak items for which no differential source information was available. When those noise items were excluded from the analysis (e.g., when the source ROC was constructed only with items that had received high-confidence old–new decisions), the source ROC was curvilinear and the z-ROC was linear. This again suggests that recollection is a continuous process and that prior ROC evidence suggesting otherwise instead reflects an MSD model (not threshold recollection).
Implications for Dual-Process Theory of Recognition Prior dual-process theories of recognition memory have all implicitly or explicitly adopted the categorical view of recollection, as noted by Mickes, Wais, and Wixted (2009). If recollection is a categorical process, then it makes sense to assume—as all prior dual-process theories have—that individual recognition memory decisions are based either on recollection (if it occurs) or on familiarity (if recollection does not occur). This common version of dual-process theory is hard to reconcile with the longstanding signal detection view, which assumes that recognition memory decisions are based on a unidimensional and continuously distributed memory strength variable. If recollection is a continuous process, however, then the idea that recollection and familiarity are aggregated into a unidimensional memory strength variable becomes viable. Otherwise, one would be faced with the unusual choice of choosing one process or the other when, for example, recollection for a particular item was relatively weak and familiarity for that item was also somewhat weak. Unless these two memory signals were completely redundant, combining them into a single signal would often be more efficient than relying on either one alone. A dual-process theory that assumes an aggregated and continuously distributed memory strength variable is naturally reconciled with signal detection theory (Wixted, 2007). Starns and Ratcliff (2008) recently conducted a study of both item and associative recognition in which they compared the ability of several models to characterize associative recognition performance, including the DPSD model. The old–new item recognition decisions were accompanied by remember– know judgments, and the associative recognition decisions were made via a 6-point confidence scale. They found that the signal detection model fit their item and associative recognition data much better than the DPSD model. Moreover, associative recognition performance was found to be a strong predictor of item recognition performance, which they interpreted as clear evidence that item recognition decisions are based on a memory signal that involves a combination of the available memory processes. The idea that recognition decisions are based on an aggregated memory signal is a relatively new conceptualization of the dual-process theory of recognition memory, and it is the only conceptualization that renders dual-process theory compatible with a unidimensional signal detection model.
Implications for Cognitive Neuroscience A continuous view of recollection would have far-reaching implications for the interpretation of neuroimaging studies and lesion studies that have attempted to identify the neuroanatomical basis of recollection and familiarity. In recent years, a great deal of
evidence has accumulated in support of the idea that recollection is subserved by the hippocampus, whereas familiarity is subserved by the adjacent perirhinal cortex (e.g., Eichenbaum, Yonelinas, & Ranganath, 2007). However, the interpretation of virtually all this evidence hinges on the validity of the categorical view of recollection. If recollection is instead a continuous process, then the same evidence would not imply that adjacent structures in the medial temporal lobe selectively subserve recollection and familiarity (Squire, Wixted, & Clark, 2007). A specific strategy used in some of these studies involved measuring the linearity of the ROC (and curvilinearity of the z-ROC) to quantify recollection and familiarity. The more linear the ROC (and the more curvilinear the z-ROC), the more it was assumed that responding was based on categorical recollection. For example, Haskins et al. (2008) arranged an experimental task that was thought to encourage unitized familiarity for some pairs and recollection for others. More specifically, in the unitized familiarity condition, participants were asked how well the two words, considered as a compound word, fit a presented definition (e.g., how well slope–bread fits the definition “A pastry eaten by mountain-climbers”). In the associative recollection condition, they were asked how well the two words of a pair served to complete a sentence that contained two blanks (e.g., how well steam and token complete the sentence “The ___ for the bath cost one ___”). The evidence that the manipulation achieved its intended effect was based on the fact that the shape of the associative recognition ROC was more curvilinear in the compound condition compared with the sentence condition. In accordance with the DPSD model, this result was interpreted to mean that compound word recognition was based on unitized familiarity. Moreover, activity in perirhinal cortex was selectively elevated at encoding for words learned as compounds. This result was taken to mean that perirhinal cortex selectively subserves the (unitized) familiarity process, but that conclusion depends on the assumption that a curvilinear associative recognition ROC reflects unitized familiarity. The present results indicate that this assumption is not generally valid. Instead, viewed in light of our results, the interpretation would be that the sentence condition may have had greater involvement of a noise distribution (thereby accounting for the relatively linear shape of the ROC in that condition) and that this may partly explain why elevated activity was not evident for that condition. In a similar vein, Sauvage et al. (2008) recently used an associative odor recognition procedure with rats in which ROC data were collected via a biasing manipulation. Control rats yielded a linear ROC (and curvilinear z-ROC), whereas rats with hippocampal lesions yielded a curvilinear ROC (and linear ROC). The interpretation of this result was taken from the human literature on associative recognition in which these two trends were interpreted in terms of the DPSD model to reflect recollection-based responding for the control rats and familiarity-based responding for the hippocampal rats. However, if those trends were due to the same forces that yield linear and curvilinear associative recognition ROCs in humans, the results of the present study suggest that, for whatever reason, the behavior of the control rats was governed by a mixture model (more so than the behavior of the hippocampal rats). Alternatively, the biasing manipulation they used to produce the ROC data may have introduced elements that render the
CONTINUOUS RECOLLECTION VERSUS UNITIZED FAMILIARITY
comparison to confidence-based ROC data meaningless (Wixted & Squire, 2008).
The Role of Familiarity in Associative Recognition Our findings do not imply that unitized familiarity never plays a role in associative recognition. Indeed, if the two items making up a test pair happen to be black and berry, it seems reasonable to assume that the two words, considered as a unit, may yield a familiarity signal. Our point is not that unitized familiarity never plays a role. Instead, our point is that previous results that have been interpreted as indicative of unitized familiarity (i.e., a curvilinear associative recognition ROC) do not specifically reflect that process. Instead, a continuous recollection signal plays a major role in producing curvilinear ROCs. As such, our findings reinforce the long-held assumption that successful performance on an associative recognition task is largely based on recollection. Cohn and Moscovitch (2007) recently drew a distinction between associative identification, such as distinguishing between intact and rearranged pairs based on recollection, and associative reinstatement, a kind of associative familiarity. The latter is revealed in old–new recognition tests of the kind used in Experiment 2, in which participants were presented with intact pairs, rearranged pairs, and new pairs and required to indicate which words were old (regardless of whether they were intact or rearranged) and which were new. The phenomenon of interest is that on this old–new test, intact pairs are more likely to be judged old than rearranged pairs even though the items of those pairs are equally familiar. This phenomenon was observed in our experiment: The hit rate for intact pairs in Experiment 2 was 0.80, whereas the hit rate for rearranged pairs was 0.72. Cohn and Moscovitch attributed this difference to associative familiarity, which is a concept not identical to, but not unlike, unitized familiarity (cf. Speer & Curran, 2007). Although this familiarity process may have played some role in distinguishing old pairs from new pairs, it is not clear whether it plays a role when participants attempt to distinguish intact pairs from rearranged pairs (though it might). Our findings are silent on the question of whether unitized familiarity plays any role in associative recognition decisions, but they reinforce the notion that item familiarity plays a role (albeit not a useful one). Although item familiarity does not help to distinguish intact from rearranged pairs because all the items are equally familiar, Kelley and Wixted (2001) found evidence that participants nevertheless take item information into account and combine it with associative recollection in arriving at a decision. Specifically, they found that strong intact pairs had a much higher hit rate than weak intact pairs (as any model would predict), but the false-alarm rate to rearranged pairs was constant across strength conditions. We replicated that pattern in Experiment 1, and it has been observed in a number of other studies as well (Buchler et al., 2008; Gallo et al., 2004; Jones & Jacoby, 2001; Kelley & Wixted, 2001; Malmberg & Xu, 2007; Verde & Rotello, 2004). The constant false-alarm rate across strength conditions has been interpreted to mean that the increased familiarity of the strong items disposes participants to declare the pair to be intact (even though item familiarity is not diagnostic of the pair’s status), whereas increased recollection disposes the participants to correctly declare the pair to be rearranged. These opposing forces cancel each other and leave the false-alarm rate unchanged. The
861
present study lends new support to that interpretation. Specifically, while the overall false-alarm rate (and the overall correct rejection rate) remained constant as a function of strength in Experiment 1, remember judgments associated with correct rejections increased significantly with strength. Thus, the absence of an effect of strength on the remember correction rejection and false-alarm rates does not mean that memory for rearranged pairs was unaffected by the strength manipulation. The change in remember– know judgments to these pairs across strength conditions shows that memory was, indeed, affected. This result provides direct evidence that recollection was higher in the strong condition, which should have led to a lower false-alarm rate to rearranged pairs. Higher item familiarity in the strong condition was, presumably, a countervailing force that served to prevent that from happening and, as such, prevented a mirror effect that might otherwise have occurred (cf. Buchler et al., 2008). The mirror effect refers to a common finding in which conditions associated with better memory exhibit both a higher hit rate and a lower false-alarm rate than conditions associated with worse memory. Note that a mirror effect is generally observed on associative recognition tasks when different classes of memorable and nonmemorable pairs are used (Greene, 1996; Hockley, 1994). Thus, for example, Greene (1996) reported that intact word pairs exhibit a higher hit rate than intact nonwords, and rearranged word pairs exhibit a lower false-alarm rate than rearranged nonword pairs. In this case, words presumably have a considerable recollection advantage over nonwords, whereas the familiarity differences for the words and nonwords (all of which were recently seen on a list) may be less pronounced. If so, the recollection advantage of words would yield a higher hit rate and a lower false-alarm rate (cf. Xu & Malmberg, 2007). In summary, the results of these two experiments suggest that memory strength on an associative recognition task is a continuously distributed variable that is a joint function of diagnostic associative recollection and nondiagnostic item familiarity. Because the aggregated memory processes are continuous, performance is well characterized by a signal detection model (though an MSD model applies when memory is weak). Thus, a curvilinear z-ROC cannot be interpreted to indicate the presence of threshold recollection, and the recollection parameter estimates obtained from fitting the DPSD model to associative recognition ROC data may capture the influence of a noise distribution, not threshold recollection. Because the results suggest that both recollection and familiarity are continuous variables, it seems reasonable to suppose that they are aggregated into a unidimensional memory strength signal. If so, then dual-process theory and signal detection theory, which have long been viewed as rival accounts, are fully compatible.
References Atkinson, R. C., & Joula, J. F. (1973). Factors influencing speed and accuracy of word recognition. In S. Kornblum (Ed.), Attention and performance IV (pp. 583– 612). New York, NY: Academic Press. Bodner, G. E., & Lindsay, D. S. (2003). Remembering and knowing in context. Journal of Memory and Language, 48, 563–580. Buchler, N. G., Light, L. L., & Reder, L. M. (2008). Memory for items and associations: Distinct representations and processes in associative recognition. Journal of Memory and Language, 59, 183–199.
862
MICKES, JOHNSON, AND WIXTED
Clark, S. E. (1992). Word frequency effects in associative and item recognition. Memory & Cognition, 20, 231–243. Clark, S. E., & Hori, A. (1995). List length and overlap effects in forcedchoice associative recognition. Memory & Cognition, 23, 456 – 461. Cohn, M., & Moscovitch, M. (2007). Dissociating measures of associative memory: Evidence and theoretical implications. Journal of Memory and Language, 57, 437– 454. DeCarlo, L. T. (2002). Signal detection theory with finite mixture distributions: Theoretical developments with applications to recognition memory. Psychological Review, 109, 710 –721. DeCarlo, L. T. (2003). An application of signal detection theory with finite mixture distributions to source discrimination. Journal of Experimental Psychology: Learning, Memory, and Cognition, 29, 767–778. Donaldson, W. (1996). The role of decision processes in remembering and knowing. Memory & Cognition, 24, 523–533. Dunn, J. C. (2004). Remember– know: A matter of confidence. Psychological Review, 111, 524 –542. Dunn, J. C. (2008). The dimensionality of the remember– know task: A state-trace analysis. Psychological Review, 115, 426 – 446. Egan, J. P. (1958). Recognition memory and the operating characteristic (Tech. Note AFCRC-TN-58 –51). Bloomington: Indiana University, Hearing and Communication Laboratory. Eichenbaum, H., Yonelinas, A. P., & Ranganath, C. (2007). The medial temporal lobe and recognition memory. Annual Review of Neuroscience, 30, 123–152. Eldridge, L. L., Sarfatti, S., & Knowlton, B. J. (2002). The effect of testing procedure on remember– know judgments. Psychonomic Bulletin & Review, 9, 139 –145. Gallo, D. A., Sullivan, A. L., Daffner, K. R., Schacter, D. L., & Budson, A. E. (2004). Associative recognition in Alzheimer’s disease: Evidence for impaired recall-to-reject. Neuropsychology, 18, 556 –563. Gardiner, J., Ramponi, C., & Richardson-Klavehn, A. (1998). Experiences of remembering, knowing, and guessing. Consciousness and Cognition, 7, 1–26. Giovanello, K. S., Verfaellie, M., & Keane, M. M. (2003). Disproportionate deficit in associative recognition relative to item recognition in global amnesia. Cognitive Affective Behavioral Neuroscience, 3, 186 – 194. Glanzer, M., Kim, K., Hilford, A., & Adams, J. K. (1999). Slope of the receiver-operating characteristic in recognition memory. Journal of Experimental Psychology: Learning, Memory, and Cognition, 25, 500 – 513. Green, D. M., & Swets, J. A. (1966). Signal detection theory and psychophysics. New York, NY: Wiley. Greene, R. L. (1996). Mirror effect in order and associative information: Role of response strategies. Journal of Experimental Psychology: Learning, Memory, and Cognition, 22, 687– 695. Habib, R., & Nyberg, L. (2008). Neural correlates of availability and accessibility in memory. Cerebral Cortex, 18, 1720 –1726. Haskins, A. L., Yonelinas, A. P., Quamme, J. R., & Ranganath, C. (2008). Perirhinal cortex supports encoding and familiarity-based recognition of novel associations. Neuron, 59, 554 –560. Healy, M. R., Light, L. L., & Chung, C. (2005). Dual-process models of associative recognition in young and older adults: Evidence from receiver operating characteristics. Journal of Experimental Psychology: Learning, Memory, and Cognition, 31, 768 –788. Heathcote, A. (2003). Item recognition memory and the receiver operating characteristic. Journal of Experimental Psychology: Learning, Memory, and Cognition, 29, 1210 –1230. Hockley, W. E. (1992). Item versus associative information: Further comparisons of forgetting rates. Journal of Experimental Psychology: Learning, Memory, and Cognition, 18, 1321–1330. Hockley, W. E. (1994). Reflections of the mirror effect for item and associative recognition. Memory & Cognition, 22, 713–722.
Hockley, W. E., & Consoli, A. (1999). Familiarity and recollection in item and associative recognition. Memory & Cognition, 27, 657– 664. Hockley, W. E., & Cristi, C. (1996). Tests of encoding tradeoffs between item and associative information. Memory & Cognition, 24, 202–216. Jacoby, L. L. (1991). A process dissociation framework: Separating automatic from intentional uses of memory. Journal of Memory and Language, 30, 513–541. Jones, T. C., & Jacoby, L. L. (2001). Feature and conjunction errors in recognition memory: Evidence for dual-process theory. Journal of Memory and Language, 45, 82–102. Kelley, R., & Wixted, J. T. (2001). On the nature of associative information in recognition memory. Journal of Experimental Psychology: Learning, Memory, and Cognition, 27, 701–722. Macmillan, N. A., & Creelman, C. D. (2005). Detection theory: A user’s guide (2nd ed.). Mahwah, NJ: Erlbaum. Malmberg, K. J., & Shiffrin, R. M. (2005). The “one-shot” hypothesis for context storage. Journal of Experimental Psychology: Learning, Memory, and Cognition, 31, 322–336. Malmberg, K. J., & Xu, J. (2007). On the flexibility and on the fallibility of associative memory. Memory & Cognition, 35, 545–556. Mandler, G. (1980). Recognizing: The judgment of previous occurrence. Psychological Review, 87, 252–271. Mickes, L., Wais, P. E., & Wixted, J. T. (2009). Recollection is a continuous process: Implications for dual-process theories of recognition memory. Psychological Science, 20, 509 –515. Nobel, P. A., & Shiffrin, R. M. (2001). Retrieval processes in recognition and cued recall. Journal of Experimental Psychology: Learning, Memory, and Cognition, 27, 384 – 413. Parks, C. M., & Yonelinas, A. P. (2007). Moving beyond pure signaldetection models: Comment on Wixted (2007). Psychological Review, 114, 188 –201. Qin, J., Raye, C. L., Johnson, M. K., & Mitchell, K. J. (2001). Source ROCs are (typically) curvilinear: Comment on Yonelinas (1999). Journal of Experimental Psychology: Learning, Memory, and Cognition, 27, 1110 –1115. Quamme, J. R., Yonelinas, A. P., & Norman, K. A. (2007). Effect of unitization on associative recognition in amnesia. Hippocampus, 17, 192–200. Rajaram, S. (1993). Remembering and knowing: Two means of access to the personal past. Memory & Cognition, 21, 89 –102. Ratcliff, R., Sheu, C., & Gronlund, S. D. (1992). Testing global memory models using ROC curves. Psychological Review, 99, 518 –535. Rotello, C. M., & Heit, E. (2000). Associative recognition: A case of recall-to-reject processing. Memory & Cognition, 28, 907–922. Sauvage, M. M., Fortin, N. J., Owens, C. B., Yonelinas, A. P., & Eichenbaum, H. (2008). Recognition memory: Opposite effects of hippocampal damage on recollection and familiarity. Nature Neuroscience, 11, 16 –18. Slotnick, S. D., & Dodson, C. S. (2005). Support for a continuous (single process) model of recognition memory and source memory. Memory & Cognition, 33, 151–170. Speer, N. K., & Curran, T. (2007). ERP correlates of familiarity and recollection processes in visual associative recognition. Brain Research, 1174, 97–109. Squire, L. R., Wixted, J. T., & Clark, R. E. (2007). Recognition memory and the medial temporal lobe: A new perspective. Nature Reviews Neuroscience, 8, 872– 883. Stark, C. E., Bayley, P. J., & Squire, L. R. (2002). Recognition memory for single items and for associations is similarly impaired following damage to the hippocampal region. Learning & Memory, 9, 238 –242. Starns, J. J., & Ratcliff, R. (2008). Two dimensions are not better than one: STREAK and the univariate signal detection model of remember/know performance. Journal of Memory and Language, 59, 169 –182. Turriziani, P., Fadda, L., Caltagirone, C., & Carlesimo, G. A. (2004).
CONTINUOUS RECOLLECTION VERSUS UNITIZED FAMILIARITY Recognition memory for single items and for associations in amnesic patients. Neuropsychologia, 42, 426 – 433. Van Overschelde, J. P., Rawson, K. A., & Dunlosky, J. (2004). Category norms: An updated and expanded version of the Battig and Montague (1969) norms. Journal of Memory and Language, 50, 289 –335. Verde, M. F. (2004). The retrieval practice effect in associative recognition. Memory & Cognition, 32, 1265–1272. Verde, M. F., & Rotello, C. M. (2004). Strong memories obscure weak memories in associative recognition. Psychonomic Bulletin & Review, 11, 1062–1066. Wais, P. E., Mickes, L., & Wixted, J. T. (2008). Remember/know judgments probe degrees of recollection. Journal of Cognitive Neuroscience, 20, 400 – 405. Wixted, J. T. (2007). Dual-process theory and signal-detection theory of recognition memory. Psychological Review, 114, 152–176. Wixted, J. T., & Squire, L. R. (2008). Constructing receiver operating characteristics (ROCs) with experimental animals: Cautionary notes. Learning & Memory, 15, 687– 690. Wixted, J. T., & Stretch, V. (2004). In defense of the signal detection interpretation of remember/know judgments. Psychonomic Bulletin & Review, 11, 616 – 641. Xu, J., & Malmberg, K. J. (2007). Modeling the effects of verbal and
863
nonverbal pair strength on associative recognition. Memory & Cognition, 35, 526 –544. Yonelinas, A. P. (1994). Receiver-operating characteristics in recognition memory: Evidence for a dual-process model. Journal of Experimental Psychology: Learning, Memory, and Cognition, 20, 1341–1354. Yonelinas, A. P. (1997). Recognition memory ROCs for item and associative information: The contribution of recollection and familiarity. Memory & Cognition, 25, 747–763. Yonelinas, A. P. (1999). The contribution of recollection and familiarity to recognition and source memory: A formal dual-process model and an analysis of receiver operating characteristics. Journal of Experimental Psychology: Learning, Memory, and Cognition, 25, 1415–1434. Yonelinas, A. P. (2002). The nature of recollection and familiarity: A review of 30 years of research. Journal of Memory and Language, 46, 441–517. Yonelinas, A. P., & Jacoby, L. L. (1995). The relation between remembering and knowing as bases for recognition: Effects of size congruency. Journal of Memory and Language, 34, 622– 643.
Received August 4, 2009 Revision received March 2, 2010 Accepted March 10, 2010 䡲
Call for Papers: Journal of Experimental Psychology: Learning, Memory, and Cognition Special Section on Neural Mechanisms of Analogical Reasoning The Journal of Experimental Psychology: Learning, Memory, and Cognition invites submissions of manuscripts for a special section on the Neural Mechanisms of Analogical Reasoning to be compiled by Associate Editor Miriam Bassok and Guest Editors Kevin Dunbar and Keith Holyoak. The goal of the special section is to showcase high-quality research that brings together behavioral, neuropsychological, computational, and neuroimaging approaches to understanding the cognitive and neural mechanisms that are involved in analogical reasoning. The editors are seeking articles on analogy and related cognitive processes (e.g., schema induction, metaphor, role-based relational reasoning, category-based induction) that either present original research using methods of cognitive neuroscience or that present behavioral research (including studies of cognitive development and/or aging and studies of brain-damaged patients) strongly connected to the neural mechanisms of analogical reasoning. The submission deadline is October 1, 2010. The main text of each manuscript, exclusive of figures, tables, references, or appendixes, should not exceed 35 double-spaced pages (approximately 7,500 words). Initial inquiries regarding the special section may be sent to Miriam Bassok (
[email protected]). Papers should be submitted through the journal’s submission portal (see www.apa.org/pubs/journals/xlm/) with a cover letter indicating that the paper is to be considered for the special section.