K. Santhi et al. / International Journal of Engineering and Technology (IJET)
Contrast Enhancement Using Brightness Preserving Histogram Plateau Limit Technique K. Santhi#1, RSD. Wahida Banu*2 #
Department of ECE, Assistant Professor, K.S.Rangasamy College of Technology, Tiruchengode – 637215, Tamilnadu, India 1
[email protected] * Principal, Government College of Engineering, Salem – 636011, Tamilnadu, India 2
[email protected] Abstract--Contrast enhancement is an important factor in the gray scale images. One of the widely accepted contrast enhancement method is the Histogram equalization (HE). HE achieves comparatively better performance on almost all types of image but sometimes produces excessive visual deterioration. The proposed Contrast Enhancement using Brightness Preserving Histogram Plateau Limit (CEBPHPL) method provides better brightness preservation without allowing in excess of contrast improvement measure. This method decomposes the input image by computing the local maxima of the smoothed image using Gaussian filter which reduces the noise. Then the clipping process has been implemented which provides the good enhancement rate than the conventional methods. The experimental result of the proposed CEBPHPL is better than the existing methods. Keyword-Histogram Equalization, Contrast enhancement, Clipped Histogram Equalization, Plateau Limit I. INTRODUCTION The digital imaging in consumer electronics plays a vital role in TV, Automatic Sensors, LCD and LED Monitors. The image enhancement techniques provide the major role in the consumer applications. Histogram equalization (HE) [1], [2], [9] is a popular technique for enhancing image contrast. The basic idea is to map the gray levels based on the probability distribution of gray levels of the input image. HE flattens and stretches the dynamic range of an image histogram and gives an overall contrast improvement. In fact, HE has been applied in various areas, such as medical and radar image processing. Furthermore, the HE method is available in most image processing packages, such as Adobe Photoshop. It leads to over contrast enhancement and provides unwanted artifacts of the images. The earliest work on this problem has been proposed by Kim in 1997 [3], with a technique known as Brightness Preserving Bi-Histogram Equalization (BBHE). This method divides the image histogram into two parts with the separation intensity XT [6], [10]. After this separation process, these two histograms are independently equalized. By doing this, the mean brightness [12] of the resultant image will lie between the input mean and the middle gray level. Dynamic histogram equalization (DHE) is proposed with the objective to stretch the contrast and preserve the details of the original image. The DHE partitions the histogram of input image based on local minimal and assigns a new dynamic range for each sub-histogram [8]. To ensure many dominating portions, the DHE further segments the large sub-histogram through a repartitioning test. Nonetheless, the DHE neglects the mean brightness preserving and tends to intensity saturation artifact. To overcome the unwanted over-enhancement and noise amplification, clipped histogram equalization (CHE) [4] is proposed to calculate the enhancement rate. First process is to determine the clipping level based on the threshold value. The clipped portion is then redistributed to the entire dynamic range. Although the CHE can control the over-enhancement and noise amplifying artifacts, it requires user to determine the clipping level. Furthermore, there distributed process may require more time for processing which could increase the complexity in the real time system. Dynamic Quadrant Histogram Equalization Plateau Limit (DQHEPL) [5] algorithm is based on the Recursive Sub-Image Histogram Equalization RSIHE which decomposes the image based on the iteration level r, which sets the histogram average as the threshold, then distributes the image gray again to get the equalized histogram by accumulated histogram [7], [12]. It would constrain the background, and wouldn't merge the target's gray level. So it can retain the target details and overcome the over-bright phenomenon. In this work based on the plateau limit algorithm with Dynamic Histogram Equalization (DHE) [9] known as Brightness Preserving Histogram Plateau Limit (CEBPHPL) is proposed which smoothens the histogram based on the gray level and local maximums are detected which is derived from the concept of Brightness Preserving
ISSN : 0975-4024
Vol 6 No 3 Jun-Jul 2014
1447
K. Santhi et al. / International Journal of Engineering and Technology (IJET)
Dynamic Histogram Equalization (BPDHE) [11]. For the brightness preservation the plateau limit is being introduced to avoid the over enhancement rate and maintains the mean brightness value. The rest of the paper is organized as follows: In Section II the proposed methodology CEBPHPL is discussed. Section III deals with quantitative evaluation and Section IV presents the results and discussion for the proposed work. II. BRIGHTNESS PRESERVING HISTOGRAM PLATEAU LIMIT (CEBPHPL) In the proposed algorithm with absolute plateau limit comprises of following steps: •
Smoothen the Histogram with the Gaussian Filter.
•
Finding Local Maximums for Dividing the Histogram
•
Identifying the Plateau Limit
•
Clipping Process Introduced for the Plateau Limits
•
Map Each Partition into a New Dynamic Range According to the Intensity Gray Levels
• Equalize Each Partition Independently by Plateau Limit A. Smoothen the Histogram with the Gaussian Filter The histogram is smoothed up by using one dimensional Gaussian filter. The idea of Gaussian smoothing is to use this 2-D distribution as a 'point-spread' function, and this is achieved by convolution. Since the image is stored as a collection of discrete pixels, it is needed to produce a discrete approximation to the Gaussian function before performing the convolution. In theory, the Gaussian distribution is non-zero everywhere, which would require an infinitely large convolution kernel, but in practice it is effectively zero more than about three standard deviations from the mean, and so we can truncate the kernel at this point. The Gaussian filter is defined by the following equation: ( )=
(1) 2σ From equation (1) ‘a’ is the coordinate relative to the center of the kernel and σ is the standard deviation. B. Finding Local Maximums for Dividing the Histogram Divide the histogram by means of the local maximums by introducing the derivative function to smoothed histogram for removing the fluctuations in the image. The first step is to assign the signs of the first derivative for the smoothed histogram calculated. Since there are still fluctuations in the calculated signs, for the avoidance of those fluctuations the processes of removing stray signs are made in this step. C. Identifying the Plateau Limit Plateau limit (Pli) and (Pui) is introduced for each sub histograms to avoid the intensity saturation and over enhancement problems in the images. =
∑
ℎ(
)
(2)
Equation (2) denotes the Plateau Limit value for the divided histogram in which, mj, mj-1 denotes the divided histograms such as m1, m2, m3 and m4. h(an) denotes the histogram at the intensity level n. D) Clipping Process Introduced for the Plateau Limits Histogram equalization stretches the contrast of the high histogram regions, and compresses the contrast of the low histogram regions. As a consequence, when the object of interest in an image only occupies a smaller portion of the image, this object will not be successfully enhanced by histogram equalization. This method also extremely pushes the intensities towards the right or the left side of the histogram which causes level saturation effects. Clipped histogram equalization [3] method tries to overcome these problems by restricting the enhancement rate. For histogram equalization methods, the enhancement is obtained from the transformation function. As given by (3), it is known that the enhancement from histogram equalization is heavily dependent to c(a). Therefore the enhancement rate is proportional to the rate of c(a). The rate of c(a) is given by the following equation: ( )= ( )
(3)
To limit the enhancement rate, the value of p(a) or h(a) is limited to a particular extent. Therefore, clipped histogram equalization modifies the shape of the input histogram by reducing or increasing the value in the histogram’s bins based on a threshold limit before the equalization takes place. This threshold limit is also known as the clipping limit, or the plateau level of the histogram. The histogram will be clipped based on this threshold value. The clipped portion is then redistributed back into the histogram in some cases. Histogram
ISSN : 0975-4024
Vol 6 No 3 Jun-Jul 2014
1448
K. Santhi et al. / International Journal of Engineering and Technology (IJET)
equalization is then carried out using this modified histogram. Clipping process hcl and hcu introduced for the plateau limits of the jth histogram is as follows: ℎ (
)=
) ℎ( ℎ(
(
) )
(4)
From equation (4), h( ) denotes the clippped histogram at intensity level n. E) Map Each Partition into a New Dynamic Range According to the Intensity Gray Levels Let m0, m1,…. mn are (n+1) gray levels corresponding to the local maximums detected in the previous step. If the original histogram before the smoothing is in the range of [Imin, Imax], then, the first sub-histogram is in the range of [Imin, m0], the second sub-histogram in the range of [m0+1, m1], the third one [m1+1, m2], and so on until the last sub-histogram [mN+1, Imax]. = ℎ ℎ − (5) =
−
= ( − 1)
(6) /∑
(7)
is the lowest intensity value in where, ℎ ℎ is the highest intensity value contained in the sub-histogram j, that section, and N is the total pixels contained in that section. The dynamic range used by the sub-histogram j in equation (5) while the dynamic range used by in output image is in input image is given by equation (7).
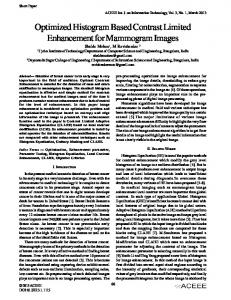
Fig 1: Block diagram of Brightness Preserving Histogram Plateau Limit histogram equalization,
ISSN : 0975-4024
Vol 6 No 3 Jun-Jul 2014
1449
K. Santhi et al. / International Journal of Engineering and Technology (IJET)
Let the range of the output sub-histogram i is [start , end ]. If the first sub-histogram of the output image has been set in the range of [0, range1], then the start and end (for j> 1) can be calculated using equations (8) and (9): = ∑ = ∑
ℎ ℎ +1
(8)
range
(9)
F) Equalize Each Partition Independently by Plateau Limit After mapping each partition is equalized individually. For sub-histogram j with the range of [ the equalization following the transformation is defined in equation (10) ( ) =
+(
)∑
−
,
], (10)
where, Ncn is the number of pixels with intensity n, and Nis the total pixels contained in that section. The value of start is set to 0, and end is set to L-1. Note that if this equation is used for global histogram equalization. III.QUANTITATIVE EVALUATION Qualitative analysis is not only to measure the performance. Because human perception is differ from person to person. In addition to that, performance metrics comparison is necessary between the proposed method and BPDHE on the basis of Contrast per pixel (CPP) and absolute mean brightness error (AMBE). A. Contrast per Pixel Contrast per pixel measures the average intensity difference between a pixel and its adjacent pixels. =
∑
∑
∑( , )∈
( , ) | (( , )
( , )|
(11)
∗ ∗
B. Absolute Mean Brightness Error The performance of brightness preservation is rated using an objective measurement is AMBE. It is defined as the absolute differential gray-level mean between the original image and the resultant image. ∑
| − |
(12)
Where, S is the total number of sample images and and are average intensity of the original and resultant images. The resultant image preserves the original image brightness with low AMBE. It gives a better maintenance of original mean brightness. This mean difference is low; the brightness of the input image is preserved in the output. IV. RESULTS AND DISCUSSION The qualitative analysis involves performance comparison with existing brightness preserving method, namely BPDHE. The proposed CEBPHPL method can slightly improve the well-defined artifacts of the gray scale image as compared to the BPDHE method. Fig. 2, 3 and 4 provide the capability to reduce the suppression effect on the histogram. To prove the robustness of the proposed methods, four quantitative parameters have been executed in this work in which sample test gray scale images are used in the quantitative measurements. The first test is Contrast per pixel based on equation (11). The results for the quantitative analysis are tabulated. The following table shows the performance metrics of three test images. TABLE I Performance Metrics of test image 1
Image
Method
CPP
AMBE
Mean Shift
Standard Deviation
Image 1
BPDHE
65.52654
22.444675
13.567
84.067
CEBPHPL
12.99568
8.208625
9.8636
83.6536
TABLE II Performance Metrics of test image 2
ISSN : 0975-4024
Image
Method
CPP
AMBE
Mean Shift
Standard Deviation
Image 2
BPDHE
89.99619
18.760298
23.1360
60.6816
CEBPHPL
16.58314
46.158454
54.6875
64.8963
Vol 6 No 3 Jun-Jul 2014
1450
K. Santhi et al. / International Journal of Engineering and Technology (IJET)
TABLE III Performance Metrics of test image 3
Image
Method
CPP
AMBE
Mean Shift
Standard Deviation
Image 3
BPDHE
107.03716
13.057024
10.5412
43.6183
CEBPHPL
21.75171
21.609657
21.1359
60.4637
(a)
(b)
(c) Fig 2: Image 1Castle image (a) Histogram equalized using BPDHE and proposed CEBHEAPL (b) BPDHE and Proposed CEBPHPL equalized (c)
ISSN : 0975-4024
Vol 6 No 3 Jun-Jul 2014
1451
K. Santhi et al. / International Journal of Engineering and Technology (IJET)
The parameters have been processed with using gray scale image with size 256x256. The Table 1, 2 and 3 suggests that, the CPP and AMBE of the proposed method and BPDHE provides lesser complex and it can reduce the intensity saturation effect. In general, for digital images the mean and standard deviation is an important measure of average intensity and contrast respectively. It is evident from the table, which in turn signifies the intensity preservation in the time of enhancement. In our proposed work CEBPHPL provides the better average mean brightness, Mean shift and standard deviation.
(a)
(b) Fig 3: (a) Brain image (b) CEBPHPL equalized Image
(a)
ISSN : 0975-4024
Vol 6 No 3 Jun-Jul 2014
1452
K. Santhi et al. / International Journal of Engineering and Technology (IJET)
(b)
(c) Fig 4: (a) Living room image (b) Histogram equalized using BPDHE and proposed CEBPHPL (c) BPDHE and Proposed CEBPHPL equalized
V. CONCLUSION In this paper, a novel histogram equalization method for enhancing the contrast of an image is presented. This method decomposes the input image by computing the local maxima of the smoothed image using Gaussian filter which reduces the noise. Then the clipping process has been implemented which provides the good enhancement rate. The experimental results show that the proposed method is able to maintain the mean brightness while preserving the details of the gray scale images. Moreover, the proposed method does not produce any unwanted artifacts that occurred in conventional methods. Also it can achieve visually pleasing contrast enhancement while maintaining the input brightness. However, in terms of the details preservation outperforms the other conventional method. This algorithm is easy to implement in real-time processing. REFERENCES [1] [2] [3]
R. C. Gonzalez, and R. E., Woods, Digital Image Processing, 2nd ed., Prentice Hall, 2002. Scott E Umbaugh, Computer Vision and Image Processing, rentice Hall: New Jersey 1998, pp. 209. Y. T. Kim, “Contrast enhancement using brightness preserving bihistogram equalization”, IEEE Trans. Consumer Electronics, vol. 43, no. 1, pp. 1-8, Feb. 1997. [4] T. Kim, and J. Paik, “Adaptive contrast enhancement using gaincontrollable clipped histogram equalization”, IEEE Trans. Consumer Electronics, vol. 54, no. 4, pp. 1803-1810, Nov. 2008. [5] Chen HeeOoi and NorAshidi Mat Isa, “Adaptive Contrast Enhancement Methods with Brightness Preserving”, IEEE Trans Consumer Electronics, vol. 56, no. 4, pp. Nov. 2010. [6] Pei-Chen Wu, Fan-Chieh Cheng, Yu-Kumg Chen, “A Weighting Mean-Separated Sub-Histogram Equalization for Contrast Enhancement” IEEE conference 2010. [7] K. S. Sim, C. P. Tso, and Y. Y. Tan, “Recursive sub-image histogram equalization applied to gray-scale images”, Pattern Recognition Letters, vol. 28, pp. 1209-1221, July 2007. [8] M. Kim, and M. G. Chung, “Recursively separated and weighted histogram equalization for brightness preservation and contrast enhancement”, IEEE Trans. Consumer Electronic, vol. 54, no. 3, pp. 1389-1397, August 2008. [9] M. A. A. Wadud, M. H. Kabir, M. A. A. Dewan, and O. Chae, “A dynamic histogram equalization for image contrast enhancement”, IEEE Trans. Consumer Electronics, vol. 53, no. 2, pp. 593-600, May. 2007. [10] H. Ibrahim, and N. S. P. Kong, “Brightness preserving histogram equalization for image contrast enhancement”, IEEE Trans. Consumer Electronics, vol. 53, no. 4, pp. 1752-1758, Nov. 2007. [11] C. H. Ooi, N. S. P. Kong, and H. Ibrahim, “Bi-histogram with a plateau limit for digital image enhancement”, IEEE Trans. Consumer Electronics, vol. 55, no. 4, pp. 2072-2080, Nov. 2009. [12] D. Menotti, L. Najman, J. Facon, and A. d. A. Araujo, “Multi-histogram equalization methods for contrast enhancement and brightness preserving”, IEEE Trans. Consumer Electronics, vol. 53, no. 3, pp. 1186-1194, August. 2007
ISSN : 0975-4024
Vol 6 No 3 Jun-Jul 2014
1453