by a continuous stimulus dimension, these methods must depend on factors other than .... off and two diffuse 50-w bulbs directly above the grain were turned on.
JOURNAL OF THE EXPERIMENTAL ANALYSIS OF BEHAVIOR
1972, 18, 419-434
NUMBER
3
(NOVEMBER)
CONTROL OF A CONTINUOUS RESPONSE DIMENSION BY A CONTINUOUS STIMULUS DIMENSION' DONALD G. WILDEMANN AND JAMES G. HOLLAND UNIVERSITY OF NORTH CAROLINA AT GREENSBORO AND -UNIVERSITY OF PITTSBURGH Pigeons were trained to respond to stimuli from a continuous stimulus dimension (tonal frequency) with response values from a continuous response dimension. Both the number of points of correspondence and problem difficulty were varied. After training, subjects were tested with stimulus values intermediate to those trained. During these test tones, subjects emitted only those response values reinforced during training. The study suggested that if there are fast and efficient methods to obtain control of a continuous response dimension by a continuous stimulus dimension, these methods must depend on factors other than simple generalization.
singing on key, handwriting, and a wide variety of motor behaviors. Although continuous repertoires are important in everyday behavior, the process has seen little experimental analysis. An applied study (Holland and Matthews, 1963) showed that children with articulation difficulties who are trained to discriminate the speech sounds they misarticulate improve their sound production even before any formal training on production. What is still needed, however, is a careful experimental analysis of the factors leading to the formation of a continuous repertoire. What should be determined are the conditions that enable different points on a stimulus dimension to evoke slightly different values along a response dimension (i.e., the conditions that produce response mapping). While the differential reinforcement resulting from the differential feedback produced by the responses would seem to be an important factor, an experimentally simpler possibility is worthy of exploration. In typical stimulus generalization experiments, as the stimulus value 'This research was supported by the Learning Re- is changed from the discriminative stimulus search and Development Center supported in part as a research and development center by funds from the (S+) value, the response decreases in freUnited States Office of Education, Department of quency. But in studies that measure stimulus Health, Education and Welfare. The -opinions ex- generalization, a single key is used and the repressed do not necessarily reflect the position or policy sponse is not free to vary in topography. The of the Office of Education and no official endorsement possibility remains that after training a few should be inferred. Reprints may be obtained from D. G. Wildemann, Dept. of Psychology, University of points along a stimulus dimension to differing North Carolina, Greensboro; Greensboro, N.C., 27412. response topographies along a response dimen419
Many skilled forms of behavior observed in the natural environmen-t require small differences in the response when small differences occur with respect to the stimuli. This phenomenon has been termed the continuous repertoire (Skinner, 1953; Holland and Skinner, 1961). An example -of the formation of a continuous repertoire is found in young children learning to copy sample drawings. Lines on the sample serve as stimuli for the drawing movements the child must make. The extent to which the drawn lines can be discriminated as similar to the sample is the extent to which the child's lines can serve as reinforcing stimuli for appropriate copying movements. Within the limits of the discriminative ability of the child, these appropriate drawing movements are reinforced and the correspondence between variations in the response field and variations in the stimulus field are established. There are many examples of continuous repertoires in -the natural environment such as
420
DONALD G. WILDEMANN and JAMES G. HOLLAND
sion, presentation of intermediate stimulus values might evoke intermediate response values. Indeed, Herrnstein and Van Sommers (1962) explored the possibility of obtaining psychophysical scaling with pigeons by training five interresponse times to five stimulus values and then testing with intermediate stimulus values. They found that a power function fit their data (cf., Stevens and Galanter, 1957). Therefore, Herrnstein and Van Sommers seem to have established a continuous repertoire by simply training five separate positive stimuli (S+ s) along a stimulus dimension to five separate interresponse times on the response dimension. Not all investigators have obtained response mapping to intermediate stimuli. Cross and Lane (1962), Migler (1964), and Cumming and Eckerman (1965) used a stimulus dimension that varied in intensity and did not obtain intermediate responding. However, each of these studies trained only two points along the stimulus dimension. Migler, who reinforced different rates of switching between two keys in response to two click rates, reinforced as one of his points a 0-sec delay. Thus, switching as rapidly as possible was reinforced. Responding to the 0-sec delay may be qualitatively different than other delays in producing especially strong response stereotypy and in effect "anchoring" the response. This anchoring, in addition to the lack of training any intermediate points between the two extremes, may have prevented response mapping. Boakes (1969) did find some limited evidence of intermediate responding. Boakes, like Migler, used the time between successive responses on two response manipulanda (R-R time) but avoided the anchoring effect of training a 0-sec R-R time. He obtained intermediate responding to intermediate stimulus values when the shorter R-R time was paired with the brighter stimulus but not when it was paired with the dimmer stimulus. It is possible that more intense stimuli directly result in faster responding without benefit of training more than one R-R time. Thus, Boakes' results are somewhat equivocal as to whether response mapping may occur when two points are trained along a dimension. Boakes also brought into question the results of the one study (Herrnstein and Van Sommers, 1962) that seemed to give clear evidence that response mapping occurred when
more than two points were trained. Boakes suggested that since averaged data were reported, the Herrnstein and Van Sommers findings might have resulted from subjects distributing their responses between the short and long R-R times that had been reinforced, rather than responding with intermediate R-R times to test stimuli. Therefore, the average of trained responses, rather than new responses, may account for the results. Thus, in studies involving response mapping, the results have been inconclusive. Boakes' (1969) results suggest that intensity affects response latency or magnitude and that the anchoring of highly discriminable responses has a critical effect. The present study determined whether a continuous repertoire appears from the conditioning of a dimension in which stimulus intensity cannot account for the results. In addition, the data were not averaged. Moreover, points were chosen to avoid strong anchoring effects and three points were conditioned to determine the effect of the number of points trained. METHOD
Subjects Eight naive White-Carneaux pigeons were maintained at 80% of their free-feeding weights tlhroughout the experiment. Apparatus The apparatus was a modified GrasonStadler experimental chamber. On one wall, a uniform gray response surface, 10 in. by 1 in. (25.4 by 2.54 cm), was located 8 in. (20 cm) above the floor and 2 in. (5 cm) from each side wall. The opaque gray response surface facing the subject consisted of a flexible piece of gray plastic covering a fine network of vertical wires. The number of vertical wires joined sequentially to a common electrical contact determined the extent of the response surface scored as a recording unit. Responses on any area of the response surface moved the wires under that area into electrical contact with a common electrode. This contact completed an electrical circuit, which was then amplified in order to drive relays, counters, etc. A more detailed description of the materials and circuitry employed for this touch-sensitive response surface is available elsewhere (Fitzhugh and Katsuki, 1971). The touch-sensitive re-
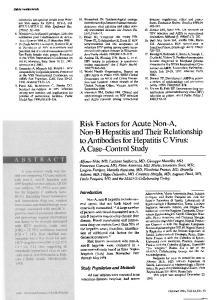
CONTINUOUS STIMULUS AND RESPONSE DIMENSIONS sponse surface required a minimum force of cm) intervals along its length. During the rein0.196N to be operated and, for purposes of re- forcement cycle, the houselight was turned cording response variability, was divided into off and two diffuse 50-w bulbs directly above 10 areas of 1 in. (2.54 cm) each. These divisions the grain were turned on. were made electrically and were not perceptiA speaker was mounted 3 in. (7.6 cm) above ble to the subjects. Successive 1 in. (2.54 cm) the response surface along the centerline of areas from left to right were labelled areas la, this wall. The speaker could present pure lb, 2a, 2b, 3a, 3b, 4a, 4b, 5a, and 5b for pur- tones of 1250 Hz, 1470 Hz, 1668 Hz, 2222 Hz, poses of data analysis. To avoid recording mul- and 2500 Hz (tones one to five respectively) at tiple responses when a response was emitted 90 dB relative to 0.0002 dynes/cm sq. Figure to locations between two adjacent response 1 shows a schematic representation of the reareas, the first impulse from any area termi- sponse surface and the tones appropriate for nated the recording of responses for 75 msec. each area. The experimental chamber was Illumination was provided by a diffuse 7-w housed in an air-conditioned room masked by houselight mounted in the center of the cham- white noise. Automatic equipment, housed in ber's ceiling. A food magazine, 10 by 2 in. (25.4 a separate room, controlled reinforcement conby 5 cm), was located 10 cm below the response tingencies, stimulus changes, and the recording surface. The reinforcer consisted of a relay of responses. produced click followed 100 msec later by a 3.5 sec period of access to mixed grain pre- Procedures sented by a grain hopper extending the length Throughout the study, sessions terminated of the magazine. To prevent unauthorized ac- after 50 reinforcements. The reinforcement cess to grain when the hopper was not raised, procedure was somewhat unusual in that both the magazine had vertical wires at 0.4 in. (1 a primary and an explicit secondary reinforcer
RESPONSE SURFACE
LEFT
I
RECORDED RESPONE AREAS
RIGHT
la
TONE I 1250 Ha
APPROPRIATE TONE
Al
DISCRIMINATION TRAINEID
72a
lb
A
I
2b |3a
-
TONE 4 2222 Hz
16 Hz
,
-
-
5b
5a
=TONE 2ONH I. A hdAN la
-
L ------
TONE 3
TONE 2 1470Hz
4b
4a
GROUP 2 4. TONES 2 AND 4-T GROUP 1-5, TONES
GROUP
1-
3
5,
I
AND
5
TONES 1, 3 AND
-5
Fig. 1. Schematic representation of the response surface with the locations of the discriminations for each Areas associated with reinforcement during a particular training tone are indicated by the arrows.
group.
DONALD G. WILDEMANN and JAMES G. HOLLAND
422
were employed. A relay produced click preceded the presentation of grain during the early training sessions to ensure that the click acquired
secondary
reinforcing
properties.
The explicit secondary reinforcer was employed to maintain responding to the novel stimuli during testing. Any reinforcement during testing causes problems to some degree. A number of studies (e.g., Zeiler, 1965) have demonstrated that reinforcing responses to novel stimuli on tests with a primary reinforcer tends to bias -further testing. Extinguishing responses on tests also can create problems. If no responses during any stimulus are reinforced, extinction of responding would occur. While an intermittent schedule of reinforcement during training prolongs extinction on tests, the discriminations trained in the present study were too complex to be readily amenable to low-density schedules of reinforcement. The present study attempted to avoid this dilemma by employing both intermittent primary reinforcement and continuous secondary reinforcement. During the last stage of training, the probability that each correct response would be followed by the presentation of food was reduced to 0.5. A correct response was always followed by the click. During the test sessions, the same schedule of primary and explicit secondary reinforcement was maintained for the training stimuli to prevent extinction. During each novel stimulus, however, any response was followed by the secondary reinforcer. Thus,
during testing, secondary reinforcement was provided nondifferentially for responses during novel stimuli. All subject-s in the present study had an identical history of 11 sessions of continuous reinforcement of responses on any area of the response surface and two sessions of extinction. Table 1 shows the training procedure used for each subject. During Sessions 1 and 2, there was continuous reinforcement of responses on any area. At the beginning of Session 3, a single tone was introduced for each subject. Trials were 30 sec in duration if no -response occurred and were followed by a 6-sec intertrial-interval with both the houselight and tone off. During Session 3, trial duration was reduced in 0.5-sec steps until each trial was 6 sec in duration. A response to any area terminated the trial and produced the intertrial interval. Responses to appropriate areas also produced the click and access to the reinforcement hopper for the first 3.5 sec of the intertrial interval. Discrimination training. Each of the groups learned a differen-t set of discriminations. Figure 1 shows the discriminations for each group. Group 1-3-5 learned to discriminate tones appropriate to areas 1, 3, and 5. Group 2-4 learned to discriminate tones appropriate to areas 2 and 4. Group 1-5 learned to discriminate tones appropriate to areas 1 and 5. Since Group 1-5 had training with the most widely spaced stimuli, and also had the additional stimuli from the ends of the response
Table 1
Training Procedures Sessions
Training Tones I and 5
Group 2-4 Training Tones 2 and 4
Group 1-3-5 Training Tones 1, 3, and 5
1-2 3-12
1-2 3-12
1-2 3-16
13-40
13-72
17-76
41-60
73-92
77-96
Groub 1-5 Procedure No tones. Reinforcement of each response to any area. Only one training tone in each session. Reinforcement of each response on an appropriate area. Discrimination training with training tones randomly alternated. Each response on an appropriate area rein-
forced. Discrimination training as above except that the probability of primary reinforcement was reduced to 0.5.
CONTINUOUS STIMULUS AND RESPONSE DIMENSIONS surface, the discrimination should have been relatively easy for these subjects. Discrimination training for Group 1-3-5 (S-114, S-116, S-124, and S-125) began with tone three during Sessions 3 and 4. During tone three, only responses to areas 3a and 3b were reinforced. During Sessions 5 to 7, only tone one was employed and responses to areas 1 a and lb were reinforced. During Sessions 8 to 10, tone five was present and responses to areas 5a and 5b were reinforced. In Sessions 11 to 13, tone three only was again presented. Sessions 14, 15, and 16 presented tones one, five, and three respectively. For Group 1-3-5, in all succeeding training sessions, tones one, three, and five were randomly alternated. During each training tone, reinforcement was contingent upon responding to the area corresponding to the tone in effect; responding to areas appropriate during other tones did not produce reinforcement. Throughout this training, a correction procedure was employed whereby a tone was not alternated until after a correct response. The subjects in Group 1-3-5 continued on this procedure until they reached a criterion in which errors were fewer than 10% of the total responses during each tone, or until they had completed 60 sessions of training with the procedure. In the session following this criterion, the probability of reinforcement was decreased from 1.0 (i.e., continuous reinforcement) to 0.5. However, each correct response produced the relay click while incorrect responses did not. This was continued for 20 sessions and then each subject was tested. For subjects in Group 1-5 (S-108 and S-109), the training procedure was similar to Group 1-3-5 except that during training, only tones one and five were employed. Table 1 shows this modification. Group 1-5 learned to associate responses to the ends of the response surface during tones one and five. Group 2-4 (S-112 and S-156) was also trained with a procedure similar to that employed with Group 1-3-5. As Table 1 shows, however, only tones two and four were employed during training for this group. When tone two was present, the appropriate response areas were 2a and 2b and when tone four was present, the appropriate response areas were areas 4a and 4b. Thus, these subjects learned a discrimination with values between those learned by the other groups.
423
Testing. Each subject was tested after 20 sessions on the 0.5 probability schedule of reinforcement. A random sequence of tones was presented during each test session. During the test, food continued to be delivered on the 0.5 schedule for correct responses during the tones employed in training. Also, each correct response during a training tone produced both the secondary reinforcer (i.e., the click) and the intertrial interval. In the no-tone intertrial interval following these correct responses, the tones were randomly alternated. An incorrect response during a training tone produced the intertrial interval, but these responses were not followed by the click. On subsequent trials, the same tone was repeated until the subject emitted a correct response. Each subject was also presented with test tones of values not employed during training. Group 1-3-5 therefore had test tones two and four; Group 1-5 had test tones two, three, and four; and Group 2-4 had test tones one, three, and five. Responses to any area during a test tone produced the click and caused the tones to alternate during the intertrial interval. This test procedure was continued for eight sessions. RESULTS Discrimination Training Individual data for each subject in representative training blocks of four sessions each are shown in Table 2. Since the results for individual subjects within groups were similar, figures for representative subjects are presented throughout this study. Figures 2 and 3 show the results of discrimination training for each training condition. The reinforcement areas during each tone are labelled S+. Consecutive training sessions are presented in blocks of four sessions. During each session of Figures 2 and 3, training tones were alternated randomly from trial to trial. Figures 2 and 3 demonstrate that with continued training, each stimulus gradually acquired stimulus control. A clear example of this increase in stimulus control is apparent in the data of S-124. In Block 1, during tone one, a large percentage of the responses were emitted to nonreinforcement areas. During Block 1, S-124 emitted 186 responses during tone one, but only 57 of these responses were emitted on areas la and lb (see Table 2). Figure 2 shows that as training on tone one
DONALD G. WILDEMANN and JAMES G. HOLLAND
424
Table 2 Responses per Area for each Subject during the First and Last Training Blocks Response Areas
Group
Subject
Block
Tone
la
lb
2a
2b
1-3-5
S-114
1
1 3 5
49 98 35
8 18 8
10 33 13
45 13
11 54 24
1 3 5 1 3 5
129 23 0
6 3 0
0 3 0
2 27 0
23 73 5
68 8
27 49 74
32 46 61
43 50 46
63 52 36
42 47 60
1
3
70 22
37 36
27 49
5
5
57 40 7
3
1
1 3 5
51 45 36
7 9 2
20
1 3 5
131 6 3
9 4 0
1 3 5
36
50
20 1-3-5
S-116
1
20
1-3-5
1-3-5
S-124
S-125
1
20 1-5
S-108
1
12
1-5
S-109
1
12
2-4
S-1 10
1
20
2-4
S-156
1
20
3b
4a
4b
5a
5b
17 32 14
3 13 24
2 16 8
2 4 9
16 34 48
15
1 3 0 17 20 40
0 0 1
4 16 130
33 38 46
1 18 0 15 35 43
13 17 32
14 26 24
39 79
37 58
11
1
1
22
9
14
4 19
10
29
24
20
12
18
103
8 12 6
16 28 19
40 49 27
32 36 30
25 16 23
19 18 20
25 17 28
14 10 28
2 2 0
1 10 0
7
5 93 9
2
51 2
49 7
1 15 3
1 5 8
0 23 139
20
19
22
39
61
25 25
38 28
35 44 52
64
28 26
41 30
24 35
13 17 15
7 6 9
20 25 50
1 3 5
89 32
41 18
67 15
21 68 8
1 7 0
1 5
95 146
28 33
5 10
1 6
1 3
10 39 3 2 2
2 3
0
11
1 5
180 2
20 0
1 0
19 31 0 7 2 0 0
42
1
18 19 2
0 0
0 0
0 0
4
1 5
7 25
12 20 5
4 11
0 6
1
2
16
7
13
27
0 15 18 47
3 1
2 0
0 0
0 0
0 2
2 5
52 87 110 9 51
44 82
78 101
63 71
74 75
41 29
16 1
2
92 11 49
11
1
11
9
3
7
6 37
89 65
115 49
18
0 1
83 141 6
35
56
44
26 12
2
78
21 15
11
15 162
1
46
0 4
1
96 137 172
5
6
24 3
2 4
26 14
32 43
2 4 2 4
2 2 10
26
18
2 19 45
2 4
3 0
12 0
progressed from Block 1 to Block 15, more and more responses were emitted to areas la and lb, while fewer responses were emitted to areas 2 through 5. Thus, in Figure 2, the response distribution became more peaked at
0
80 2
18
3a
36 53 86
11
56
5 0
6
0
14 135
12 18
52 64
19 188
96
72 7 191 1
1
areas la and lb from Block 1 through Block 15. Figure 2 shows that during training with tone three, the gradient became more and more peaked around reinforcement areas 3a and 3b from Block 1 to Block 15. With con-
CONTINUOUS STIMULUS AND RESPONSE DIMENSIONS
en
8-124 Group 1-3-5
90 go
0.0 IL wl'
425
80, 70,
-60,
0 50I11. 40
0
f-30,
z us
o 80~~~~~~~~~~~~~~~~~0
A.~~~~t
60~~~~S/'CS11
-'
3AS12-.op1-0 LU 20, DC~~~~~~~~~~~~~~~~~~~~9I
Fi.26 iciiaintanigi0ucsiebok fforssin o -2 n S15o ru -- rie on toe n,tre n ie h ecetg ftettlrsosst h idvda epnelctosdrn eac toei4 hw0o ucsiv lcso riig eifreetaesdrn ec oeaelble +
426
DONALD G. WILDEMANN and JAMES G. HOLLAND
tinued training, tone five gradients also became more peaked around reinforcement areas 5a and 5b. These trends are also apparent when the response distributions in Block 20 are compared to the response distributions during Block 1 (see Table 2). Similar examples of increased stimulus control with training can be found in the other figures. By the en(I of training, all subjects appeared to be responding under appropriate stimulus control. Initially, errors during each tone occurred on all areas with equal frequency. With further training, however, errors to areas other than those associated with reinforcement tended to decrease. Graphically this can be seen most clearly in the training gradients of S-1O trained on tones one and five (see Figure 3). By Block 7, errors during tone one occurred most frequently to response areas 5a and 5b, the reinforcement area during tone five (see the slight peak at these areas in Figure 3). Errors during tone five were emitted primarily to the reinforcement areas for tone one (see the small peak at areas la and lb). MannKendall tests for trend reflected this observation. For areas la and lb during tone five, the trend toward a decrease in responding was not significant at the 0.05 level of confidence during Blocks 1 to 7 for the subjects in this group. For the other error areas (2a through 4b) however, the decrease in responding over these blocks was significant (S = -16, p < 0.05). Most of this decrease in responding to intermediate areas was due to S-156 of Group 1-5, which emitted a number of responses to intermediate areas during the first two blocks of training. Figures 2 and 3 show that the same trend existed for the subjects of the other groups; most errors were emitted to reinforcement areas for other tones. As Table 2 shows, however, there were some responses on nonreinforcement areas for the subjects in Groups 1-3-5 and 2-4. For instance, during tone three in Block 20, S-124 emitted 10 responses (4% of the total tone three resonses) to area 2b and 49 responses (11%) on area 4a. Thus, there was some spread of errors for this subject and, indeed, for the other subjects in this group. A similar spread of errors occurred in the response distributions of the subjects in Group 2-4 (see Table 2). Thus, while errors occurred primarily on reinforcement areas for other training tones, there were some errors on intermediate areas adja-
cent to the appropriate area during that tone. Figure 2 also shows that there were slight individual differences in the final performance level for each subject. By the last block of discrimination training (Block 20), over 73% of the total responses of S-124 were correct. S-125, however, had a lower percentage of correct responses, 56%. Similar results were obtained for the other two subjects in this group. Thus, in Figure 2, the response distributions of S-124 were more peaked around the reinforcement areas (i.e., the areas labelled S+) than those of S-125. There were also small individual differences for Group 2-4 during Block 20, where S-110 emitted a higher percentage of correct responses than S-156. Group 1-5, trained with tone one and tone five, did not show these individual differences. Both subjects in this group emitted over 90% correct responses by their last training block (see Table 2). Group 1-5 was also the only group to attain the criterion of less than 100% incorrect responses during each tone before Block 15. Throughout training, S-108 from this group emitted few responses to intermediate areas. During pretraining and the first three blocks of discrimination training, an average of only 5.2% of the total responses were emitted to areas 2-4. During Blocks 4 to 12, errors to these areas averaged only 0.66% per block. Apparently, the discrimination for Group 1-5 was easier than for the other two groups. The change of reinforcement schedule from continuous to a probability of 0.5 had little effect on responding during training. For Group 1-3-5 and Group 2-4, the change came after Block 15, while for Group 1-5 the change came after Block 7. Figures 2 and 3 show that the response gradients during each tone were almost unchanged in the last five blocks when the 0.5 schedule of reinforcement was in effect.
Testing Figures 4 and 5 show the test results based on the total responses during each tone. In these figures, Pretest Blocks 1 and 2 present the response distributions during each tone in the last eight training sessions for each subject. Test Blocks 1 and 2 show the total percentage of responses during each training and test tone in the eight testing sessions. For Group 1-3-5, eight discrimination retraining sessions following the test (Posttest Blocks 1 and 2) are
CONTINUOUS STIM-ULUS AND RESPONSE DIMENSIONS
90
427
S-108: Group 1-5
61180
z
0 IL 70 %A _ 60
-1
Io
40
IIi
II
S-llO: Group 2-4
Fig. 3. Discrimination training in successive blocks of four sessions for S-108 of Group 1-5 and S-11O of Group 2-4. The percentage of total responses to the individual response locations during each tone is shown for successive blocks of training. Reinforcement areas during each tone are labelled S+.
DONALD G. WILDEMANN and JAMES G. HOLLAND
428
Table 3
Responses per area during the test tones for each Subject in test session 1 and in test blocks I and 2. Group
Subject
1-3-5
S-114
Test Session Block
1-3-5
1-5
S-125
S-108
4b
5a
5b
11 6
3 3
0 0
0 0
0 0
0 20
2 4
45 1
2 0
0 0
14 4
40 18
15 15
3 8
0 0
0 1
1 95
2 4 2 4
55 2 2 1
3 0 7 0
1 0 6 0
16 3 10 2
27 9 6 2
15 14 2 11
0 0 0 6
0 0 1 4
0 1 0 5
2 116 6 13
2 4
16 1
25 2
18 0
23 6
35 24
6 32
2 17
2 13
2 13
60
2 4
7 0
16 1
16 1
35 34
7 14
6 20
23 0
0 0
0 0
4 4
24 28 3 4
3 19
2 4
17 7 0 0
4 8
0 0
0 0
5 32 0 26
1
2 4
76 1
4 0
1 0
8 0
16 14
17 19
6 20
2 8
1 9
5 80
2
2 4
50 3
3 0
10 2
4 13
1 5
0 7
0 59
9 0
1
0
3 0
13 1
5 3
0 0
0
1
1
0 31
1
2 4
25 1
9 1
5 0
15 0
24 19 4 5 24 6
22 20
2 4
2 1 2
38 12
20 4
3 0
0 2
4 142
2
2 4
33
3 0
6 3
45 16
0
0 0
112
31 26 4
2 2 1
0 0
1 0 0
0 0 0
43 22 0 0 0
14 9
2 3 4
7 3 2
1
6
0 0 2
2 0 0
1 2 1
9 20 47
2 3
102 74 18
19 18 7
8 3 0
1 0 3
0 0 0
0 0 0
2 1 4
4 3 4
6 3 12
76 97 178
41 9 5
3 2 1
0 0 0
0 1 1
0
0 3 2
3 1 6
11 5 0
1 4 2
0 0 0
0 1 0
0 0 0
0 0 0
0 0 2
7 3 8 0 0 0
41
0 0
21 17 1
2 8 2
1 0 0
0 1 0
0 0 0
0 0 2
0 0 0
1 1 1
61 94 267
29 13
4 1 1
1 1 1
0 0 0
0 0 0
0 0 0
0 1 0
0 1 1
56 83 224
1
1
1
1
4
2 S-109
Response Areas 3a 3b 4a
1 0
1
1-5
2b
0 0
2 S-124
2a
1 0
1
1-3-5
lb
9 0
2 S-116
la
2 4
1 1
1-3-5
Test Tone
1
2 3 4
125 112 23 34 24 2 141 110 7
2
2 3 4
109 96 7
2 3 4 2 3 4
1
11
17
1
70 183 10 26 69
CONTINUOUS STIMULUS AND RESPONSE DIMENSIONS
429
Table 3-continued
Test
Group
2-4
Subject
S-l lO
lb
2a
1 3 5
0 0 0
0 0 1
21 10 1
16 2
1 3 5
1 1 1
10 9 2
86 64
52 60
7
7
1
3 5
1 0 0
16 11 2
76 54 18
47 37
1 3 5
0 5 1
1 3 2
1
1 3 5
1 5 1
2
1 3 5
0 2 0
1
1
2
2-4
S-156
Test Tone
la
Session Block
1
also presented. Individual data 'during test tones for test session 1, and for the twvo test blocks are shown in Table 3. The difficulty of the training problem had little effect on test results. Subjects in Group 2-4, which lhad a 25% error rate during the last eight training sessions, emitted responses during test tone three primarily to the areas associated with reinforcement during training (i.e., areas 2a and 2b, and areas 4a and 4b). Few responses were emitted to the intermediate areas (3a and 3b), resulting in the valley in the gradients at these areas (see Figure 4). The subjects in Group 1-5, which had only a 10% error rate during the last eight training sessions, also emitted most of their responses during test tone tlhree to the areas associated with reinforcement during training (i.e., areas la and lb, and areas 5a and 5b). Presumably if response mapping occurred, the response gradients for Group 1-5 during test tone two should resemble the response gradients of subjects in Group 2-4 during training tone two. Figure 4 indicates that the test gradients for the subjects in Group 1-5 and the training gradients for the subjects in Group 2-4 during tone two were quite different. Since S-108 of Group 1-5 emitted few errors to intermediate areas throughout training, these results were
2b
13
Response Areas 3a 3z 4a
4b
5a
5b
5 2 1
0 0 0
3 5 5
3 10 26
1 1 8
0 0 0
7 9 2
1 2 1
17 30 45
8 43 100
1 3 15
1 1 0
10
3 6 2
3 3 1
19 40 54
19 26 93
1 4 14
2 0
9 13 4
16 14 7
9 5 3
4 0 3
2 7 9
2 2 15
0 0 3
0 0 0
10 7 2
29 37 5
67 48 10
34 26 11
13 16 13
11 26 35
10 38 78
0 2 24
0 0 2
9 18 2
59 53 15
62 46 15
17 13
0 7 10
3 5 29
4 8 66
0 0 7
0 0 0
12
1
not likely to be due to the extinction of responses to nonreinforcement areas. Thus, there is little evidence that problem difficulty and extinction influence the formation of a
continuous repertoire. The number of training problems also did not noticeably increase the amount of response mapping during test stimuli. Figure 5 shows that during test tone two, Group 1-3-5 responded primarily to the areas appropriate during tone one and tone three, their training tones. Few responses were emitted to area 2a and 2b, the appropriate areas if response mapping occurred. During tone four, Group 1-3-5 responded primarily on areas 3a and 3b, and areas 5a and 5b, the reinforcement areas during tone three and tone five. Few responses were emitted to areas 4a and 4b, the appropriate areas for response mapping. There were large differences between the response distributions of subjects trained on a tone and for subjects tested with that tone. For instance, a comparison of test tone three response distributions for Group 1-5 and 2-4 showed that their response distributions were quite different from the response distributions of Group 1-3-5, trained with tone three (see Figures 4 and 5). During tone three, Groups 1-5 and 2-4 responded primarily on the areas
DONALD G. WILDEMANN and JAMES G. HOLLAND
430
en
8-108: Training Tons I and 6
W
90 z 80 Ow ILZ KR 0 70 EL X 60' 0u I -4 50
zw&
eu
k.
40 30 20
u
4 *.0 I-
10, I
5 S-110: Training Tones 2 and 4
n
en
90
o
W080.
z
'A
70'
P.