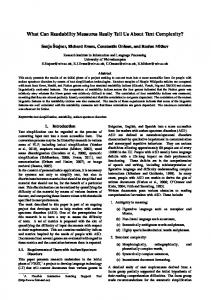
Oncogene (2005) 24, 5533–5542
& 2005 Nature Publishing Group All rights reserved 0950-9232/05 $30.00 www.nature.com/onc
ORIGINAL PAPERS
Control of MAPK signalling: from complexity to what really matters Jorrit J Hornberg1,5, Bernd Binder2,5, Frank J Bruggeman1,5, Birgit Schoeberl3, Reinhart Heinrich2 and Hans V Westerhoff*,1,4 1 Department of Molecular Cell Physiology, Institute of Molecular Cell Biology, Faculty of Earth and Life Sciences, Vrije Universiteit, Amsterdam, The Netherlands; 2Department of Theoretical Biophysics, Humboldt University, Berlin, Germany; 3Merrimack Pharmaceuticals, Cambridge, MA, USA; 4Mathematical Biochemistry, Swammerdam Institute for Life Sciences, University of Amsterdam, Amsterdam, The Netherlands
Oncogenesis results from changes in kinetics or in abundance of proteins in signal transduction networks. Recently, it was shown that control of signalling cannot reside in a single gene product, and might well be dispersed over many components. Which of the reactions in these complex networks are most important, and how can the existing molecular information be used to understand why particular genes are oncogenes whereas others are not? We implement a new method to help address such questions. We apply control analysis to a detailed kinetic model of the epidermal growth factor-induced mitogenactivated protein kinase network. We determine the control of each reaction with respect to three biologically relevant characteristics of the output of this network: the amplitude, duration and integrated output of the transient phosphorylation of extracellular signal-regulated kinase (ERK). We confirm that control is distributed, but far from randomly: a small proportion of reactions substantially control signalling. In particular, the activity of Raf is in control of all characteristics of the transient profile of ERK phosphorylation, which may clarify why Raf is an oncogene. Most reactions that really matter for one signalling characteristic are also important for the other characteristics. Our analysis also predicts the effects of mutations and changes in gene expression. Oncogene (2005) 24, 5533–5542. doi:10.1038/sj.onc.1208817; published online 20 June 2005 Keywords: MAPK signalling; control analysis; kinetic model; systems biology
Introduction Cellular decisions with respect to division, differentiation and apoptosis involve signal transduction. The complexity of signal transduction networks is over*Correspondence: HV Westerhoff, Department of Molecular Cell Physiology, Institute of Molecular Cell Biology, Faculty of Earth and Life Sciences, Vrije Universiteit Amsterdam, De Boelelaan 1085, 1085 HV Amsterdam, The Netherlands; E-mail:
[email protected] 5 These authors have contributed equally to this work Received 18 October 2004; revised 18 March 2005; accepted 26 April 2005; published online 20 June 2005
whelming because of their large numbers of interacting constituents, by their complicated circuitry, involving feed forward, feedback and crosstalk, and by the fact that the kinetics of interaction matter (Huang and Ferrell, 1996; Kholodenko et al., 1999). As a result of this complexity, apparently simple but highly important questions remain unanswered. For instance, is a small number of reactions responsible for the behaviour of the entire system (and ultimately, for cellular behaviour) and if so, which are these reactions? This issue was made acute recently, when the old simplifying paradigm of single rate-limiting steps for signal transduction was falsified and replaced by the principle that control of signal transduction must add up to a total control strength, but may well be disperse (Hornberg et al., 2005). Is the control of signal transduction and hence of proliferation, differentiation and apoptosis always disperse then? Is there little hope of tinkering with that control once it has gone away? Such questions may be answered by detailed and extensive quantitative experimentation with inhibitors and activators of signal transduction proteins. However, both the arsenal and the specificity of these are limited. The frustrating conclusion seems to be that notwithstanding the considerable and increasing amount of molecular information concerning signal transduction pathways, we have no way of understanding how they are controlled, and hence no rational ways of finding targets for interfering with the processes. Signalling through one of the networks is initiated by the binding of epidermal growth factor (EGF) to its receptor (EGFR) and signals towards cell division and differentiation (Lewis et al., 1998; Cobb, 1999). The signal is propagated by recruited adaptor proteins, G-protein activation, (de-)phosphorylation reactions and the activation of the extracellular signal-regulated kinase (ERK). This mitogen-activated protein kinase (MAPK) pathway is constitutively activated by mutations in many human tumours (Hoshino et al., 1999). Active ERK has several cytoplasmic and nuclear targets, such as transcription factors that influence expression of genes involved in cell cycle progression (Treisman, 1996; Lewis et al., 1998), and it is required for the proliferation of fibroblasts (Page`s et al., 1993). Decisive for the type of cellular response that is evoked by MAPK signalling
Control of MAPK signalling JJ Hornberg et al
5534
are the magnitude and duration (transient versus sustained) of ERK activation (Marshall, 1995; Tombes et al., 1998; Cook et al., 1999). Again because of the tremendous complexity of the pathway, it is understood, which processes and proteins determine the dynamic time profile of ERK activity and hence the choice between proliferation and differentiation. Putting all the available molecular information in a computer replica of the biological process and then interrogating that replica may help in such cases (Snoep and Westerhoff, 2005). This has been demonstrated for metabolic networks (Schuster and Holzhutter, 1995; Bakker et al., 1999; Teusink et al., 2000). Here, we extend this strategy to the MAPK pathway, by interrogating the largest kinetic model of EGF-induced signal transduction (Schoeberl et al., 2002) in terms of what controls its signal transduction activity. How can one figure out which steps control network functioning? Metabolic control analysis (MCA) determines which enzymes control the steady flux through a metabolic pathway (Kacser and Burns, 1973; Heinrich and Rapoport, 1974; Westerhoff and Van Dam, 1987; Fell, 1992). The control of steady-state metabolic flux can be well distributed (and not necessarily uniformly) among many processes (Groen et al., 1982). MCA has been developed much less for dynamics; however, for signal transduction, the important feature appears to be the amplitude of a transient peak, the duration of signalling and the overall signal strength; steady states may not exist, or the steady-state levels may be irrelevant. Classical MCA therefore does not apply to signal transduction. We recently extended MCA to the dynamics of signal transduction, however (Hornberg et al., 2005). This revealed some principles, including that the dynamics of signal transduction must be determined by more than one process, and differently for the many characteristics of those dynamics. This suggests that control of signal transduction is spread almost equally over all components. Only detailed analysis of specific cases can show, however, whether control is as disperse as it can be in principle. The analysis of which proteins and reactions are in control of a signalling pathway is of vital importance not only for understanding of the system, but also for drug design, since it helps choosing potential drug targets according to the magnitude of their control on cell proliferation (Bakker et al., 1999; Cascante et al., 2002). Studies that combine quantitative experimentation and mathematical modelling have proven to describe the functioning of the EGFR pathway (Kholodenko et al., 1999), feedback circuitry (Asthagiri and Lauffenburger, 2001), MAPK signalling (Schoeberl et al., 2002) and the Wnt pathway (Lee et al., 2003). They have also predicted phenomena such as ultrasensitivity (Huang and Ferrell, 1996), learning (Bruggeman et al., 2000), bistability (Bhalla and Iyengar, 1999) and oscillatory behaviour (Kholodenko, 2000). Theoretical studies have elucidated principles of signalling networks (Heinrich et al., 2002), some of which have been confirmed experimentally (Hornberg et al., 2005). These studies have contributed much to the general understanding of Oncogene
the functioning of signalling networks, but there is still a lack of understanding of (i) which processes and proteins are most important for signalling and (ii) why certain genes are oncogenes or tumour suppressor genes, whereas other genes appear not to be important for the development of cancer. We here apply the dynamic extension of MCA to the MAPK pathway and calculate for its computer replica how the control is distributed. The results are much less random than expected, and may help explain oncogene distributions.
Results A computer model of EGF-induced signal transduction The computer replica of EGF-induced signalling through the MAPK cascade that we use here contains 148 molecular processes and 103 variable molecular species (Figure 1). It is an updated version of previous models (Kholodenko et al., 1999; Schoeberl et al., 2002) and should be close to containing the best available experimental data on the pathway (cf. Supplementary Tables 1 and 2): It describes signal transduction all the way from EGF binding at the cellular membrane to the phosphorylation of ERK. The molecular processes include association, dissociation, as well as covalent (de-)modification and degradation events and have all been described with mass-action kinetics. Signalling is initiated by binding of EGF to EGFR, followed by the dimerization and subsequent autophosphorylation of EGFR. Signal propagation involves either of the two routes, both leading to the activation of the small G-protein Ras. One route starts with the binding of the ‘Src homology and collagen domain protein’ (Shc) to the phosphorylated, ligand-bound, dimerized receptor followed by the binding of the growth factor receptorbinding protein 2 (Grb2). The other commences directly with the binding of Grb2. In both routes, the association of Grb2 with the complex that includes EGFR recruits Sos to the cytoplasmic surface of the membrane. The model also includes an elaborate description of the processes involved in the internalization and the degradation of the various receptor complexes (cf. Supplementary Table 1). The recruitment of Sos brings the latter in close proximity to its membrane-anchored target, that is, Ras. Contact between Sos and Ras leads to the activation of the latter through the formation of Ras-GTP. Ras-GTP dissociates from the receptor complex, which then dissociates further. The inactivation of Ras-GTP involves the activity of a GTPaseactivating protein (GAP). Although the kinase by which Raf is phosphorylated is not known (the exact mechanism is subject to ongoing research and discussion), the model we used assumes that Raf phosphorylation is caused directly by a free Ras-GTP molecule. Phosphorylated Raf has intrinsic kinase activity and can phosphorylate MAPK/ERK kinase (MEK), which in its doubly phosphorylated form can phosphorylate ERK. Raf, MEK and ERK can be dephosphorylated by
Control of MAPK signalling JJ Hornberg et al
5535
Figure 1 The biochemical scheme of the signal transduction network. Most of the molecular species, reactions that refer to internalized receptor-associated species, have not been depicted. The reaction numbers are depicted in grey. Some reactions have two reaction numbers: the second reaction number always refers to the internalized counterpart
various phosphatases (Millward et al., 1999; Todd et al., 1999; Keyse, 2000); in the model, this is described in terms of the different phosphatase activities, one for each kinase. The model includes the negative feedback loop from doubly phosphorylated ERK (ERK-PP) to Sos. This causes the dissociation of Grb2-Sos from the receptor complex (Buday et al., 1995; Dong et al., 1996; Porfiri and McCormick, 1996). The model does not account for different isoforms of proteins. This means that isoform specificity (for instance, displayed by different Raf or ERK proteins) cannot be considered in this model. In the absence of stimulation by EGF, the system is in a stable steady state, in which ERK is not phosphorylated (for the other characteristics of this reference state, see Supplementary Table 2). The model distinguishes between two pools of ERK-PP: one is located freely in the cytoplasm and the other is associated with the internalized receptor. This ‘internalized’ ERK-PP makes up at most 1.2% of the total ERKBPP concentration. Figure 2 displays the computed transient profile of the total ERK-PP concentration, that is, the sum of the two pools. This transient profile qualitatively corresponds to experimental work describing the ERK phosphorylation kinetics (Hornberg et al., 2004). Upon addition of EGF at t ¼ 0, the total concentration of ERK-PP rapidly increases so as to attain B50% of the total concentration of ERK within B5 min. Then, the ERK-PP
Figure 2 The transient profile of ERKBPP as a function of time upon the addition of EGF at time zero calculated with the kinetic model. The definitions of the three quantities that characterize the transient profile, that is, amplitude, duration and integrated response, are depicted
concentration slowly decays to zero, passing 10% of its maximal activation level at B65 min. Which processes are important and how important are they? The time dependence of the activation of ERK is an important determinant of the subsequent cellular response, for example, it decides between cell division Oncogene
Control of MAPK signalling JJ Hornberg et al
5536
and differentiation (Marshall, 1995; Tombes et al., 1998). We focused on three characteristics of the transient activation profile of ERK (Figure 2). The first was the amplitude (A), defined as the maximal ERK-PP concentration that was attained. The second characteristic was the duration (d) of signalling, defined as the total time for which the ERK-PP concentration exceeded 10% of its amplitude. The third characteristic was the integrated response (I), defined as the time integral of the activated ERK concentration between time 0 and 100 min. This measure can be regarded as the total output of the pathway; for linear downstream kinetics, it would be proportional to the number of downstream molecules that are activated. Indeed, the time-integrated value of ERK activity upon fibronectin stimulation was shown to be directly proportional to the induced amount of DNA synthesis (Asthagiri et al., 2000). We determined how important each of the 148 molecular processes was for each of these three characteristics, essentially by calculating how strongly the characteristic changed when the process was activated by 1%. The percentage change in that characteristic was then called the coefficient for the control of that characteristic by the process. The control coefficient CA7 , for instance, quantifies the control exercised by the receptor internalization process (process 7) on the amplitude (A). If for a 1% activation of process 7, the amplitude increases by 1%, then the amplitude follows precisely the activity of the process and the corresponding control coefficient is 1. If, however, the amplitude only increases by 0.3%, the control is less, although significant, as indicated by a control coefficient CA7 of 0.3. (The actual quantification and definition of this control coefficient was performed more precisely, cf. Supplementary information.) The entire set of control coefficients can be found in Supplementary Table 3. The individual sums of the control coefficients (calculated by a small perturbation) on amplitude, duration and integrated response were in accordance with the summation theorems we recently discovered (Hornberg et al., 2005). Most reactions in the network are not that important for signalling to ERK A paradigm of classical biochemistry was that pathways should have a single controlling step. This paradigm was never proven to be true. For signal transduction pathways, the theorems we recently discovered (Hornberg et al., 2005) replace the previous paradigm by a paradigm with a foundation: Total control should amount to a certain magnitude, but the control may well be distributed over many steps. This opens up the possibility that control is almost equally distributed over all steps in the pathway. To examine whether EGFERK signal transduction is indeed that complex, we display a histogram of the control coefficients on amplitude, duration and integrated response (Figure 3). It suggests that the maximum possible complexity is not attained in this pathway: calculated control was far from Oncogene
Figure 3 Histograms that depict the frequencies of the three types of control coefficiens calculated for the differentially small perturbations: (a) for the amplitude (b) for the durationand (c) for the integrated response
uniformly distributed over all processes. Most reactions had a control coefficient that was very close to zero and only a small group of reactions exercised much control. This is a surprising result considering that there are 148 reactions that could have exercised much control, and, for each signalling characteristic, as many control coefficients.
Control of MAPK signalling JJ Hornberg et al
5537
EGF-induced signalling to ERK: which reactions are in control? For practical purposes, we here define a control coefficient to be ‘substantial’ if it is not smaller in absolute value than 10% of the largest control coefficient. Table 1 displays the ‘substantial’ positive and the ‘substantial’ negative control coefficients for control on the amplitude, the duration and the integrated response. For instance, with respect to the control on amplitude, only eight out of the 148 processes were found to display substantial control coefficients (five reactions with positive control and three with negative control). In Supplementary Figure S1, the control coefficients of Table 1 are depicted superimposed on the biochemical scheme of the signalling network. The trend that becomes apparent is that many of the largest control coefficients are associated with reactions that involve Raf, MEK and ERK. This was irrespective of the system property for which the control distribution was calculated. In order to further classify processes that exert high control, we simplified the extensive reaction scheme of Figure 1 into a simpler ‘textbook’ type displayed in Figure 4. We grouped reactions that are directly involved in the same biochemical process. For example, the biochemical process ‘EGFR activation’ included
Table 1 v
26 27 31 42 43 44 46 49 51 52 53 54 55 57 59 74 84 86 93 118 124 140
reaction 1 (i.e. EGF binds to EGFR), reaction 2 (EGFR dimerization) and reaction 3 (EGFR phosphorylation). In this way, each of the 148 reactions was assigned to any of 13 different biochemical processes, that is (1) EGFR activation, (2) recruitment of Shc, Grb2 and/or Sos, (3) Ras activation, (4) Ras inactivation, (5) activation of Raf, (6) Raf dephosphorylation, (7) MEK phosphorylation by Raf, (8) MEK dephosphorylation, (9) ERK phosphorylation by MEK, (10) ERK dephosphorylation, (11) the negative feedback from ERK to Sos, (12) internalization of EGFR-associated complexes and (13) degradation reactions (for complete overview of which reaction was assigned to which biochemical process, see Supplementary Table 4). To calculate how much control such a biochemical process exerts on the amplitude, duration and integral of the ERK-PP profile (signal output), we determined the impact control coefficient (Kholodenko and Westerhoff, 1993) of each of the 13 biological processes by taking the sum of the control coefficients of all molecular reactions that were assigned to each biochemical process. The impact control coefficients were calculated for small perturbations and the results, depicted in Figure 4 (cf. Supplementary Table 5), show that most control resided within only a small number of processes. ‘Raf dephosphorylation’ and ‘MEK phosphorylation by Raf’ exercised high control on all characteristics of the signal
The most substantial positive and the most substantial negative control coefficients on amplitude, duration and integrated response
Reaction
[(EGF-EGFR*)2-GAP-Shc*-Grb2-Sos]+[Ras-GDP] 2 [(EGF-EGFR*)2-GAP-Shc*-Grb2-Sos-Ras-GDP] [(EGF-EGFR*)2-GAP-Shc*-Grb2-Sos-Ras-GDP] 2 [(EGF-EGFR*)2-GAP-Shc*-Grb2-Sos] + [Ras-GTP] [(EGF-EGFR*)2-GAP-Shc*-Grb2-Sos-Ras-GTP] 2 [(EGF-EGFR*)2-GAP-Shc*-Grb2-Sos]+[Ras-GDP] [Raf*]+[Phosphatase1] 2 [Raf*-Phosphatase1] [Raf*-Phosphatase1] - [Raf]+[Phosphatase1] [MEK] + [Raf*] 2 [MEK-Raf*] [MEK-P]+[Raf*] 2 [MEK-P-Raf*] [MEK-PP-Phosphatase2] - [MEK-P] + [Phosphatase2] [MEK-P-Phosphatase2] - [MEK]+[Phosphatase2] [ERK]+[MEK-PP] 2 [ERK-MEK-PP] [ERK-MEK-PP] - [ERK-P]+[MEK-PP] [ERK-P]+[MEK-PP] 2 [ERK-P-MEK-PP] [ERK-P-MEK-PP] - [ERK-PP]+[MEK-PP] [ERK-PP-Phosphatase3] - [ERK-P]+[Phosphatase3] [ERK-P-Phosphatase3] - [ERK]+[Phosphatase3] [(EGF-EGFRi*)2-GAP-Shc*-Grb2-Sos-Ras-GDP] 2 [(EGF-EGFRi*)2-GAP-Shc*-Grb2-Sos] + [Ras-GTPi] [Rafi*]+[Phosphatase1] 2 [Rafi*-Phosphatase1] [MEK] + [Rafi*] 2 [MEK-Rafi*] [MEKi-P-Phosphatase2] - [MEK]+[Phosphatase2] [(EGF-EGFR*)2-GAP-Shc*-Grb2-Sos]+[Prot] 2 [(EGF-EGFR*)2-GAP-Shc*-Grb2-Sos-Prot] Prot] [(EGF-EGFRi*)2-GAP-Shc*-Grb2-Sos] - [(EGF-EGFRi*)2deg]
Small perturbation
+50% perturbation
"50% perturbation
Amp
Dur
Int
Amp
Dur
Int
Amp
Dur
Int
0.006
0.038
0.070
0.004
0.026
0.048
0.013
0.070
0.130
0.021
0.125
0.236
0.012
0.089
0.168
0.075
0.221
0.403
"0.001
0.138
0.203 "0.001
0.128
0.192 "0.001
0.151
0.214
"0.072 "0.699 "1.130 "0.609 "0.438 "0.927 "0.030 "1.249 "0.015 "0.146 "0.235 "0.013 "0.098 "0.159 "0.017 "0.283 0.044 0.640 0.924 0.019 0.570 0.820 0.815 0.667 0.042 0.191 0.419 0.019 0.165 0.353 0.696 0.170 "0.006 "0.453 "0.607 "0.006 "0.344 "0.450 "0.006 "0.720
"1.965 "0.457 1.212 0.761 "0.973
"0.002 0.001 0.000 0.015 0.066 "0.080 0.000 "0.005
"0.440 "0.002 "0.355 "0.341 "0.002 "0.686 0.172 0.001 0.161 0.133 0.001 0.286 0.158 0.000 0.119 0.103 0.000 0.402 0.327 0.010 0.155 0.266 0.030 0.288 "0.207 0.038 "0.315 "0.181 0.699 "0.709 "0.091 "0.164 0.184 "0.123 "0.061 0.327 "0.347 0.000 "0.335 "0.296 "0.001 "0.492 "0.090 "0.005 "0.037 "0.075 "0.006 "0.052
"0.609 0.254 0.342 0.442 0.119 "0.071 "0.440 "0.112
0.000 "0.086 "0.088 0.000 "0.059 "0.060 "0.002 "0.167 0.001 0.106 0.110 0.001 0.103 0.108 0.000 0.109 0.000 "0.089 "0.074 0.000 "0.068 "0.059 0.000 "0.126 "0.007 "0.146 "0.216 "0.008 "0.122 "0.182 "0.007 "0.183
"0.190 0.112 "0.099 "0.270
"0.001 "0.054 "0.077 "0.001 "0.047 "0.067 "0.001 "0.065 0.000 "0.056 "0.059 0.000 "0.054 "0.056 0.000 "0.058
"0.092 "0.061
"0.470 0.202 0.184 0.198 "0.404 0.216 "0.389 "0.043
The control coefficients calculated with small and large perturbations (Dp/p of 10"6, +0.5 and "0.5, respectively) are shown. The significantly positive and negative control coefficients are displayed in bold and italic, respectively Oncogene
Control of MAPK signalling JJ Hornberg et al
5538
Figure 4 Control by biological processes. Each of the 148 reactions in the model was assigned to one of the 13 biological processes represented here by the drawn arrows. The numbers represent the control of that process on signal amplitude (top), duration (middle) and integrated response (lower). Control was calculated in terms of the ‘impact control coefficient’ of the biological processes (i.e. the sum of the control coefficients of the reactions involved in that process). This was performed for the control coefficients determined with the small perturbations (this figure) and by "50% and þ 50% perturbations (see Supplementary Figure S2)
output. The amplitude of signalling was also controlled by ‘ERK phosphorylation by MEK’ and ‘ERK dephosphorylation’, whereas signal duration and integrated output were further controlled by ‘MEK dephosphorylation’. Since, in practice, most changes of activities are not small, we also calculated the control of the biological process of signal transduction from EGF to ERK-PP by using the control coefficients that were determined after "50 and þ 50% perturbations of the reaction rates (Supplementary Figure S2 and Supplementary Table 5). In either case, the process with the most control on either signalling characteristic was either ‘Raf dephosphorylation’ or ‘MEK phosphorylation by Raf’. ‘MEK dephosphorylation’ also exerted relatively high control on signal duration and integrated response. And, only certain proteins are important The control considered so far was that by molecular and biochemical processes. This does not necessarily indicate Oncogene
the importance of proteins. We also addressed the question of how changes in the concentration of the proteins (caused by e.g. changes in gene expression) influenced signalling through the network. We calculated the fractional change in the three signalling characteristics caused by a fractional change in the total concentration of any protein (Kholodenko and Westerhoff, 1993). This measure corresponds to the response coefficient of MCA (Kacser and Burns, 1973). We have calculated these three response coefficients for all proteins in the network. Table 2 shows the coefficients quantifying the responses of the three characteristics of signalling to ERK to changes in the concentrations of the proteins in the network. Again we define a ‘substantial’ response coefficient as that whose absolute value exceeded 10% of the highest response coefficient. Signalling duration and the integrated output were affected most by changes in the concentrations of Ras, MEK and ERK (positive effect) and the phosphatases 1, 2 and 3 (negative effect). When small changes in protein concentrations were applied, the amplitude was, surprisingly, sensitive solely to the concentration of ERK and its phosphatase. When large changes in protein concentrations were considered, the amplitude also became sensitive to an increase in the concentration of phosphatase 1 (negative effect) as well as to a decrease in the concentrations of Ras and MEK (positive effect). Changes in the concentrations of EGF, the adaptor proteins and Raf did not affect the output of MAPK signalling much. Control of amplitude, duration and integrated response; is it all the same? We have shown how control on signalling amplitude, duration and integrated response is distributed over the processes in the network. An interesting question to address is whether reactions, which have high control on one of the three characteristics of signalling output, also tend to have a high control on the other two characteristics. In other words, are there reactions in the network that control all three characteristics of signalling to ERK to a high extent? To address this point, the values of the three types of control coefficients are displayed as a function of each other in Figure 5. Figure 5c shows that the reactions that had a high control on the duration of the ERK-PP signal also tended to have significant control on the integrated response of the ERK-PP profile, which is reflected by a relatively high correlation coefficient of R ¼ 0.88. This positive correlation between individual processes controlling the signal amplitude and those controlling the signal duration was expected intuitively and has also been shown for simple linear cascades (Heinrich et al., 2002; Hornberg et al., 2005). However, for simple cascades, high control on signal duration always coincided with a high control on amplitude. In the more complex signalling network under consideration here, these two control coefficients are no longer covariant, as is illustrated by a small correlation coefficient of R ¼ 0.07.
Control of MAPK signalling JJ Hornberg et al
5539 Table 2 Response coefficients Small perturbation
EGF EGFR Prot shc Grb2 Sos grb2sos Ras-GDP GAP Raf P1 MEK P2 ERK P3
"50% perturbation
+50% perturbation
Amp
Dur
Int
Amp
Dur
Int
Amp
Dur
Int
0.00 0.01 "0.02 0.00 0.00 0.00 0.00 0.08 0.02 0.00 "0.09 0.05 "0.01 1.91 "0.94
0.00 0.17 "0.32 "0.01 "0.01 0.01 "0.02 0.84 0.21 0.01 "0.95 0.90 "1.03 0.70 "0.49
0.00 0.28 "0.49 0.00 "0.01 0.02 0.00 1.30 0.32 0.01 "1.47 1.24 "1.12 2.74 "1.67
0.00 0.00 "0.02 0.00 0.00 0.00 0.00 0.03 0.01 0.00 "1.25 0.02 "0.01 1.91 "1.02
0.00 0.11 "0.25 "0.03 "0.01 0.01 "0.02 0.73 0.10 0.01 "0.56 0.88 "0.70 0.53 "0.53
0.00 0.20 "0.37 "0.03 "0.01 0.01 "0.02 1.12 0.18 0.01 "1.40 1.18 "0.76 3.15 "1.35
0.00 0.02 "0.01 0.00 0.00 0.00 0.01 1.95 0.06 0.00 "0.03 1.14 "0.01 1.85 "0.93
0.00 0.27 "0.51 0.02 "0.01 0.02 0.01 1.07 0.40 0.02 "1.64 0.85 "1.94 1.18 "0.47
0.00 0.40 "0.78 0.03 "0.01 0.03 0.04 1.97 0.56 0.03 "2.57 1.49 "2.08 1.94 "2.10
The relative importance of the concentration of each protein (or protein complex) for the signalling amplitude, duration and integrated response was calculated with small (actual response coefficient) and large (to mimic changes in gene expression) perturbations (Dp/p of 10"6, +0.5 and "0.5, respectively). The substantially positive and negative response coefficients are displayed in bold and italic, respectively
Large versus small perturbations Above, we calculated the control coefficients by perturbing the rate constants only very mildly. We also investigated whether the size of the perturbation affected the distribution of control over all reactions. We found that the magnitude of the control coefficients was affected by the size of the perturbation, but, importantly, the order in which the processes were ranked on the basis of their control coefficients did not change (cf. Supplementary Figure S3).
Discussion Most alterations that cause oncogenic transformation occur in components of signal transduction pathways that control key cellular processes such as cell division, apoptosis, angiogenesis and cell adhesion (Hanahan and Weinberg, 2000). The growing knowledge of how signalling proteins function and interact with each other has enabled us to draw maps of large networks, and has at the same time overwhelmed us with its enormous complexity. Complete understanding of signalling is therefore a difficult task, and it cannot be attained on the basis of interaction maps alone. In this study, we have applied control analysis to a detailed kinetic model of EGF-induced MAPK signalling (Schoeberl et al., 2002), which plays a pivotal role in the development of cancer. Some components of the MAPK network are well-known oncogenes, such as Ras and Raf, causing the pathway to be constitutively active in tumour cells (Bos, 1989; Hoshino et al., 1999; Davies et al., 2002), and have therefore been taken to be promising targets for rationalized therapies against cancer (Sebolt-Leopold, 2000). For each of the 148 processes in the network, we calculated to what extent it controls the output of the MAPK pathway, that is, the concentration of ERK-PP. Experimental studies have
shown that the time profile of ERK phosphorylation is essential for which response is evoked (Marshall, 1995; Tombes et al., 1998; Cook et al., 1999). Three metrics that together describe the shape of the transient ERKPP time profile were analysed, that is, its (i) amplitude, (ii) duration and (iii) integrated output (Hornberg et al., 2005). Most reactions in the network do not control these characteristics at all (or to a very small extent). Although this may be a striking result (why would there be so many reactions if they do not control the output?), it is important information for clinicians and researchers alike, because not many reactions may be modulated in order to change the output. The next step is to identify those reactions. Which reactions are in control? The reactions with the highest control coefficients involved binding of Raf, MEK and ERK to each other and to their respective phosphatases and the (de-)phosphorylation reactions in which these proteins were involved. We classified all 148 reactions into 13 groups of ‘biological processes’ (cf. Figure 4 and Supplementary Figure S2). The processes that highly controlled all characteristics of the ERK-PP profile (amplitude, duration and integrated response) were ‘MEK phosphorylation by Raf’ and ‘Raf dephosphorylation’. The activity of Raf is thus identified as important for ERK phosphorylation. This is in accordance with the experimentally verified claim that Raf is a potent oncogene (Rapp et al., 1983; Magnuson et al., 1994; Davies et al., 2002). Total malignant behaviour is of course controlled by multiple pathways (Hahn et al., 1999; Hanahan and Weinberg, 2000; Vogelstein and Kinzler, 2004). However, a process such as cell cycle progression can, although controlled by multiple pathways, very well be affected by a mutation in a single oncogene. Since signalling to ERK contributes to cell cycle progression and is known to play an important role in the development of cancer (Lewis et al., 1998; Hoshino et al., 1999), cells that acquire a mutation in a gene within the MAPK pathway will only attain a Oncogene
Control of MAPK signalling JJ Hornberg et al
5540
Figure 5 Correlations between control coefficients on the three signalling characteristics: (a) signal duration and integrated response, (b) signal duration and signal amplitude and (c) signal amplitude and integrated response. In each case, regression lines are depicted (dashed lines), and their linear function and the R2-value are shown
growth advantage if the mutation is in a gene that is actually important for signalling to ERK. Hence, the fact that Raf is important for ERK phosphorylation is a plausible explanation for why cells with mutations in Raf attain a growth advantage. Additionally, we found ‘MEK dephosphorylation’ to have high control on the duration and integrated output, and ‘MEK phosphorylates ERK’ on the Oncogene
amplitude. MEK has not been identified as an oncogene. However, expression of genetically mutated constitutively active MEK is sufficient to cause cellular transformation (Mansour et al., 1994). Although most reactions with high control are associated with Raf, or for duration and integrated output also with MEK, the total control was distributed over more than just these processes. Reactions that lead to the internalization of EGFR and EGFR-associated complexes exert negative control (4–5 times less than the most important reactions) on duration and integrated output. This means that, even though signalling from EGFR continues after internalization (Haugh et al., 1999; Oksvold et al., 2001), a change in the rate of internalization still affects the output of ERK signalling, possibly because internalized EGFR is exclusively targeted for degradation. Comparison of the control we calculated from the known molecular properties with experimental findings also leads to more research avenues. EGFR activation hardly exerted any control. Yet, constitutively active mutant receptors are commonly expressed in various human tumours (Pedersen et al., 2001). As EGFR represents the starting point of distinct signalling pathways (Carpenter, 2000), a plausible explanation might be that the growth advantage caused by such mutations is not mediated via signalling to ERK. The well-known oncogene Ras is at a branch point of an array of signalling pathways (Campbell et al., 1998). Although we do find that reactions that involve the activation and inactivation of Ras exert control on ERK signalling duration (and integrated output), this might explain why these processes are 4–5 times less important for signalling to ERK than Raf activity, Raf dephosphorylation or MEK dephosphorylation. A further inspiring result is that a reaction that was thought to inactivate signalling to ERK, that is, the inactivation of Ras by GAP, had positive control on the duration and integrated response. This result clearly shows the usefulness of calculations for comprehending the sometimes anti-intuitive behaviour of complex networks, and provides an interesting topic for further research. A general issue that often emerges when analysing a model (either an experimental or a computational one) of a large and complex biological system is the fact that reality is more complex than the model. Intrinsic simplifications and assumptions often have to be made, since the available information on the system is not always complete. The model of the EGF-induced MAPK signalling network we analysed here, although already elaborate with 148 reactions, is not complete yet and will require continuous updates wherever possible. These may include specificity of different isoforms of components of the network (e.g. ERK1 and ERK2), additional feedback loops, the spatial resolution (e.g. different cellular compartments), the role of scaffold proteins (e.g. KSR), the effect of multiple phosphorylation and dephosphorylation events on the same protein (e.g. Raf), diffusion, etc. Such updates could have implications for the values of the reported control coefficients. For some simplifications currently in the
Control of MAPK signalling JJ Hornberg et al
5541
model, we predict that they are not likely to affect the control distribution. For instance, the activation of Raf is modelled as a one-step process, whereas in reality more than one step is involved. Since one can agglomerate subprocesses into a module process (Bruggeman et al., 2002), no implications are expected for the control distribution we report here. In a more detailed model, control exercised by the module ‘Raf activation’ will be distributed over the subprocesses. For other simplifications, it is difficult to predict how they affect the control distribution. For instance the action of feedback loops, such as the upregulation of MAPK phosphatases or Sprouty, is likely to affect the steadystate ERK-PP concentration. How the control distribution would be affected by the fact that the participating proteins are not homogeneously distributed over the cell is also unclear. As a result of recruitment of proteins from the cytosol to the membrane, they may become highly concentrated on a 2D surface (Kholodenko et al., 2000). With increasing quantitative information, it should become possible to incorporate such issues into the model. However, the current model is, to our knowledge, the most complete and detailed model of this system available at present, and it reproduces reality well (Periwal and Szallasi, 2002). The fact that we found that most reactions of this complex network are not important for the output of the system suggests that the system displays a certain unexpected robustness and, hence, that many simplifications (reactions that are not in the model but do function in reality) may not affect the outcome nor our conclusions to a large extent. The insights gained on the control distribution seem largely independent of what characteristic of the dynamic ERK-PP time profile is analysed. For all three processes, control is distributed and not confined to one process. The processes that are most important for the integrated output are the same reactions that are most important for the duration and also tend to control the amplitude. Also, the effects of changes in the concentrations of signal transduction proteins, such as caused by overexpression or ‘silencing’, were examined. We found that ERK-PP hardly responded to changes in the concentrations of either EGF, or the adaptor proteins Shc and Grb2, or Sos or Raf. Thus, while the ERK-PP time profile strongly depended on the activity of Raf and on Raf dephosphorylation, it was certainly not limited by expression of Raf. In summary, we have determined which reactions in the complex EGF-induced MAPK network are important and which are not. This study reveals for the first time how signalling output is controlled in such a large-scale complex network. We found the Raf protein to be involved in the processes that were identified as important with respect to the amplitude, duration and integrated response of the signalling output. Control analysis of accurate mathematical models is a promising tool for the discovery of a new category of drug targets (Bakker et al., 1999; Cascante et al., 2002) and, as shown here, also for the under-
standing and prediction of the functioning of complex signalling networks.
Materials and methods The original kinetic model of EGF-induced signalling through the MAPK cascade (Schoeberl et al., 2002) was updated (cf. Supplementary Tables 1 and 2 and www.mpi-magdeburg. mpg.de/people/schoeberl/schoeberl.html) and implemented in Mathematica 5.0 (Wolfram Research Inc., Mathematica, Version 5.0, Champaign, IL, USA; cf. www.siliconcell.net for the model). The control and response coefficients were calculated with a fractional change in the parameter values Dp/p of 1 $ 10"6 (d lnp), "0.5 and þ 0.5. All parameter changes were applied at t ¼ 0 (which is the time point of EGF administration), to allow for a fair comparison with the reference model. As part of the theory, MCA embodies summation theorems of control coefficients. Summation theorems relate the sum of all the control coefficients on a certain systemic property to a constant value. We recently derived the following laws for the control of signal transduction (Hornberg et al., 2005): n X i¼1
CiA ¼ 0;
n X i¼1
Cid ¼ "1; and
n X i¼1
CiI ¼ "1:
The control coefficients (denoted by C) quantify the extent to which a characteristic of the dynamic time profile (such as the signalling amplitude A, the duration d or the integrated output I) is controlled by the activities of all the n processes I, that is, logðAÞ dA=A CiA % dd logða % da ;where ai is any factor multiplying both the iÞ i =ai forward and the reverse rate of process i (Westerhoff and Van Dam, 1987). The above summation laws dictate that these control coefficients sum to constant values: The sum of all control coefficients on the amplitude of signalling always equals 0. This implies that all reactions of the network with positive control (such as activating processes catalysed by kinases) are exactly as important for amplitude as all reactions with negative control (such as inactivating processes catalysed by phosphatases). All control coefficients on the duration of signalling and the integrated response must sum to "1. This implies that the inactivating reactions (which cause shorter duration) exert more control on these properties than activating reactions (which cause longer duration) (Heinrich et al., 2002; Hornberg et al., 2005). The summation theorems are strictly only valid for control coefficients calculated for very small changes in the activities of the processes.
Abbreviations EGF, epidermal growth factor; EGFR, EGF receptor; ERK, extracellular signal-regulated kinase; ERK-PP, doubly phosphorylated ERK; Grb2, growth factor receptor binding protein 2; MAPK, mitogen-activated protein kinase; MCA, metabolic control analysis; MEK, MAPK/ERK kinase; Shc, Src homology and collagen domain protein. Acknowledgements We thank Jan Lankelma for stimulating discussions. This work was partly sponsored by a joint grant of the Netherlands Organization for Scientific Research (NWO) and the German Research Foundation (DFG) to stimulate collaborations between Dutch and German graduate schools. Oncogene
Control of MAPK signalling JJ Hornberg et al
5542 References Asthagiri AR and Lauffenburger DA. (2001). Biotechnol. Prog., 17, 227–239. Asthagiri AR, Reinhart CA, Horwitz AF and Lauffenburger DA. (2000). J. Cell Sci., 113 (Partt 24), 4499–4510. Bakker BM, Michels PA, Opperdoes FR and Westerhoff HV. (1999). J. Biol. Chem., 274, 14551–14559. Bhalla US and Iyengar R. (1999). Science, 283, 381–387. Bos JL. (1989). Cancer Res., 49, 4682–4689. Bruggeman F, Westerhoff H, Hoek J and Kholodenko B. (2002). J. Theor. Biol., 218, 507. Bruggeman FJ, van Heeswijk WC, Boogerd FC and Westerhoff HV. (2000). Biol. Chem., 381, 965–972. Buday L, Warne PH and Downward J. (1995). Oncogene, 11, 1327–1331. Campbell SL, Khosravi-Far R, Rossman KL, Clark GJ and Der CJ. (1998). Oncogene, 17, 1395–1413. Carpenter G. (2000). BioEssays, 22, 697–707. Cascante M, Boros LG, Comin-Anduix B, de Atauri P, Centelles JJ and Lee PW. (2002). Nat. Biotechnol., 20, 243–249. Cobb MH. (1999). Prog. Biophys. Mol. Biol., 71, 479–500. Cook SJ, Aziz N and McMahon M. (1999). Mol. Cell. Biol., 19, 330–341. Davies H, Bignell GR, Cox C, Stephens P, Edkins S, Clegg S, Teague J, Woffendin H, Garnett MJ, Bottomley W, Davis N, Dicks E, Ewing R, Floyd Y, Gray K, Hall S, Hawes R, Hughes J, Kosmidou V, Menzies A, Mould C, Parker A, Stevens C, Watt S, Hooper S, Wilson R, Jayatilake H, Gusterson BA, Cooper C, Shipley J, Hargrave D, PritchardJones K, Maitland N, Chenevix-Trench G, Riggins GJ, Bigner DD, Palmieri G, Cossu A, Flanagan A, Nicholson A, Ho JW, Leung SY, Yuen ST, Weber BL, Seigler HF, Darrow TL, Paterson H, Marais R, Marshall CJ, Wooster R, Stratton MR and Futreal PA. (2002). Nature, 417, 949–954. Dong C, Waters SB, Holt KH and Pessin JE. (1996). J. Biol. Chem., 271, 6328–6332. Fell DA. (1992). Biochem. J., 286, 313–330. Groen AK, Wanders RJ, Westerhoff HV, van der Meer R and Tager JM. (1982). J. Biol. Chem., 257, 2754–2757. Hahn WC, Counter CM, Lundberg AS, Beijersbergen RL, Brooks MW and Weinberg RA. (1999). Nature, 400, 464–468. Hanahan D and Weinberg RA. (2000). Cell, 100, 57–70. Haugh JM, Huang AC, Wiley HS, Wells A and Lauffenburger DA. (1999). J. Biol. Chem., 274, 34350–34360. Heinrich R, Neel BG and Rapoport TA. (2002). Mol. Cell, 9, 957–970. Heinrich R and Rapoport TA. (1974). Eur. J. Biochem., 42, 89–95. Hornberg JJ, Bruggeman FJ, Binder B, Geest CR, Bij de Vaate AJM, Lankelma J, Heinrich R and Westerhoff HV. (2005). FEBS J., 272, 244–258. Hornberg JJ, Tijssen MR and Lankelma J. (2004). Eur. J. Biochem., 271, 3905–3913. Hoshino R, Chatani Y, Yamori T, Tsuruo T, Oka H, Yoshida O, Shimada Y, Ari-i S, Wada H, Fujimoto J and Kohno M. (1999). Oncogene, 18, 813–822.
Huang CY and Ferrell Jr JE. (1996). Proc. Natl. Acad. Sci. USA, 93, 10078–10083. Kacser H and Burns JA. (1973). Symp. Soc. Exp. Biol., 27, 65–104. Keyse SM. (2000). Curr. Opin. Cell Biol., 12, 186–192. Kholodenko BN and Westerhoff HV. (1993). FEBS Lett., 320, 71–74. Kholodenko BN. (2000). Eur. J. Biochem., 267, 1583–1588. Kholodenko BN, Demin OV, Moehren G and Hoek JB. (1999). J. Biol. Chem., 274, 30169–30181. Kholodenko BN, Hoek JB and Westerhoff HV. (2000). Trends Cell Biol., 10, 173–178. Lee E, Salic A, Kruger R, Heinrich R and Kirschner MW. (2003). pLoS Biol., 1, e10. Lewis TS, Shapiro PS and Ahn NG. (1998). Adv. Cancer Res., 74, 49–139. Magnuson NS, Beck T, Vahidi H, Hahn H, Smola U and Rapp UR. (1994). Semin. Cancer Biol., 5, 247–253. Mansour SJ, Matten WT, Hermann AS, Candia JM, Rong S, Fukasawa K, Vande Woude GF and Ahn NG. (1994). Science, 265, 966–970. Marshall CJ. (1995). Cell, 80, 179–185. Millward TA, Zolnierowicz S and Hemmings BA. (1999). Trends Biochem. Sci., 24, 186–191. Oksvold MP, Skarpen E, Wierod L, Paulsen RE and Huitfeldt HS. (2001). Eur. J. Cell Biol., 80, 285–294. Page`s G, Lenormand P, L’Allemain G, Chambard JC, Meloche S and Pouyssegur J. (1993). Proc. Natl. Acad. Sci. USA, 90, 8319–8323. Pedersen MW, Meltorn M, Damstrup L and Poulsen HS. (2001). Ann. Oncol., 12, 745–760. Periwal V and Szallasi Z. (2002). Nat. Biotechnol., 20, 345–346. Porfiri E and McCormick F. (1996). J. Biol. Chem., 271, 5871–5877. Rapp UR, Goldsborough MD, Mark GE, Bonner TI, Groffen J, Reynolds Jr FH and Stephenson JR. (1983). Proc. Natl. Acad. Sci. USA, 80, 4218–4222. Schoeberl B, Eichler-Jonsson C, Gilles ED and Muller G. (2002). Nat. Biotechnol., 20, 370–375. Schuster R and Holzhutter HG. (1995). Eur. J. Biochem., 229, 403–418. Sebolt-Leopold JS. (2000). Oncogene, 19, 6594–6599. Snoep JL and Westerhoff HV. (2005). Curr. Genomics, 5, 687–697. Teusink B, Passarge J, Reijenga CA, Esgalhado E, van der Weijden CC, Schepper M, Walsh MC, Bakker BM, van Dam K, Westerhoff HV and Snoep JL. (2000). Eur. J. Biochem., 267, 5313–5329. Todd JL, Tanner KG and Denu JM. (1999). J. Biol. Chem., 274, 13271–13280. Tombes RM, Auer KL, Mikkelsen R, Valerie K, Wymann MP, Marshall CJ, McMahon M and Dent P. (1998). Biochem. J., 330, 1451–1460. Treisman R. (1996). Curr. Opin. Cell Biol., 8, 205–215. Vogelstein B and Kinzler KW. (2004). Nat. Med., 10, 789–799. Westerhoff HV and Van Dam K. (1987). Thermodynamics, Control of Biological Free-energy Transduction. Elsevier: Amsterdam.
Supplementary Information accompanies the paper on Oncogene website (http://www.nature.com/onc)
Oncogene