1
Controlling membrane pore blocking and filter cake build-up in side-stream MBR systems T. Jiang1,a,2,b*#, M.D. Kennedy1,c, W.G.J. van der Meer3,d, P.A. Vanrolleghem2,e, J.C. Schippers1,f 1
International Institute for Infrastructural, Hydraulic and Environmental Engineering (IHE), PO Box 3015, 2601 DA Delft, The Netherlands a Tel. +31 (0)15 2151 774; fax: +31 (0)15 2122 921; email:
[email protected] c Tel: +31 (0)15 2151 774; fax: +31 (0)15 2122 921; email:
[email protected] f Tel: +31 (0)15 2151 780, fax: +31 (0)15 2122 921, email:
[email protected] 2 BIOMATH, Ghent University, Coupure Links 653, B-9000 Gent, Belgium b Tel. +32 (0)9 264 61 96; fax: +32 (0)9 264 62 20; email:
[email protected] e Tel. +32 (0)9 264 59 32; fax: +32 (0)9 264 62 20; email:
[email protected] 3 Vitens Fryslân, Snekertrekweg 61, Postbus 400, 8901 BE Leeuwarden d Tel. +31 (0)58 294 52 42; fax: +31 (0)58 294 53 00; email:
[email protected]
Abstract This research tried to quantify and control membrane pore blocking and filter cake build-up in a MBR pilot plant. A constant filtration flux of 18-72 l/m2h was employed. The mean crossflow velocity was between 0.93 to 1.86 m/s and air was continuously supplied to flush the membrane surface (co-currently with the feed/sludge). Backwashing was applied every 5 min for 5-12 seconds to control membrane fouling. A simple method was developed to quantify blocking and cake resistance employing the TMP vs. t curve, and was successfully applied in the most of the tests in this MBR pilot plant (e.g. moderate to significant fouling conditions). But in a few cases (e.g. low fouling conditions), the applicability of the method was poor. The pore blocking phase, identified from the TMP vs. time curve, showed various shapes and durations. The extreme cases were at low flux (18 l/m2h) and high mean crossflow velocity (1.86 m/s), as the blocking phase could hardly be observed. Increasing the mean crossflow velocity from 0.93 to 1.86 m/s significantly decreased both blocking (Rb) and cake resistance (Rc), as a result of the increased particle back transport velocity due to Brownian diffusion, shear induced diffusion and inertial lift. The extent of blocking (Rb) and cake resistance (Rc) was strongly controlled by the backwashing duration in the range of 5-12 seconds.
Keywords: Membrane Bioreactor, Fouling, Resistance, Blocking, Cake filtration 1. Introduction The mechanism of membrane fouling may determine the effectiveness and efficiency of membrane cleaning methods. Flushing the membrane surface using feedwater/air and backwashing was widely applied in MBR systems to remove foulants either deposited inside the membrane pores (standard blocking), at the entrance of membrane pores (complete blocking) or accumulated on the membrane surface (cake filtration). However, the effectiveness and efficiency of membrane cleaning depend not only on the cleaning method itself (intensity and frequency), but also on the fouling mechanism (blocking or cake). Generally, membrane fouling that can be removed by hydraulic cleaning e.g. backwashing and crossflushing, is defined as reversible, while fouling that cannot be removed by simple hydraulic cleaning, but requires more intensive cleaning (e.g. chemicals), is defined as irreversible fouling. In this paper, firstly, a simple method is developed to quantify blocking and cake resistance, based on the TMP vs. time curve in a MBR system. Secondly the shape and the duration of the membrane pore blocking phase under different operational conditions is schematically illustrated and discussed. Finally, the effectiveness of mean crossflow velocity and backwashing duration in removing blocking and cake resistance are quantified and discussed. _____ * Corresponding author Presenting author
#
2
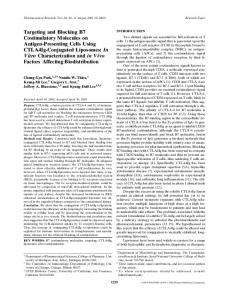
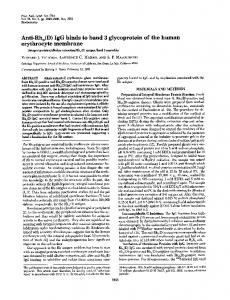
2. Materials and methods A side-stream MBR pilot plant, located in Beverwijk the Netherlands, was fed with wastewater from the Beverwijk Zaanstreek wastewater treatment plant, and comprised mainly domestic wastewater. The schematic of the MBR system is presented in fig. 1. Organic matter degradation and biological nitrogen and phosphorus removal occur in the bioreactor, while the biomass separation was achieved by 4 ultrafiltration modules. The ultrafiltration membrane modules were supplied by X-Flow. Each UF module comprised 600 vertical membrane tubes, with a length of 3 m and an internal diameter of 5.2 mm. The average pore size of the PVDF membrane was 0.03 m. Activated sludge from the aeration tank was fed to the bottom of the UF module (inside-outside configuration), and compressed air was supplied concurrently with the sludge to continuously flush the membrane surface. The corresponding mean crossflow velocity (the liquid and air two phase crossflow velocity) was varied from 0.93-1.86 m/s. Permeate was collected at the outside of the membrane module by a vacuum pump, while the concentrate flow (biomass), rejected by the UF membrane was returned to the aeration tank. The UF module was operated at a constant gross flux of 18-72 l/m2h. The liquid/air two-phase flow in the UF module was identified as “slug flow” [1]. The UF membranes were periodically (every 5 or 10 minutes) backwashed for 5-12 seconds by pumping a fraction of permeate back through the membrane. Sludge return Excess sludge
Influent
Micro screen
Anoxic
Anoxic /Aerobic
Anoxic
Anoxic /Aerobic
Aerobic
Aerobic
Effluent
UF membrane module
Blower
Blower
Fig. 1. Schematic of the MBR pilot plant
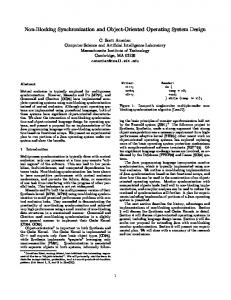
3. Results and discussion 3.1 Developing a method of quantifying blocking and cake resistance The TMP was recorded every 0.2 seconds to detect the rapid increase in TMP at the start of each filtration cycle. Employing the TMP vs. t curve, a simple method was developed to quantify blocking and cake resistance. The quantification of blocking resistance and cake resistance was based on the identification of the blocking and cake filtration phase. Due to the fact that blocking results in a more rapid loss of membrane permeability than cake filtration, it is possible to identify a blocking phase and a cake filtration phase in this MBR pilot plant [2]. The pore blocking phase, which was identified from Fig. 2 as the sharp initial increase in TMP at the start of the filtration cycle, had a very short duration of approximately 8 seconds. From 8 to 600s, the increase in TMP with time was moderate, which was assumed to correspond to the occurrence of cake filtration. Considering the wide range of particle and colloidal sizes that exist in activated sludge, the transition from blocking to cake filtration is expected to occur gradually, and consequently, the blocking phase may not be fully complete
3 within 8 seconds. Furthermore, cake compression was not observed in this pilot MBR plant, probably due to the low TMP (1.45*10-5 m/s) of particles larger than 1.8 m was greater than their permeation velocity (1.4*10-5 m/s) due to shear-induced diffusion and inertial lift phenomena (estimated according to the models in [3,4] but the detailed calculation is not shown in this paper). Consequently, hardly any deposition of particles larger than 1.8 m occurred [5]. When the mean crossflow velocity was increased from 0.93 to 1.86 m/s, particles larger than 0.7 m were prevented from deposition. As these particles (>0.7 m)
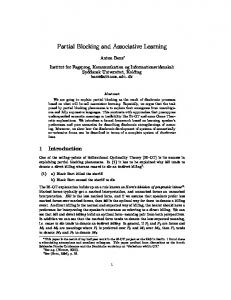
5 were much larger than the membrane pore size (0.03 m), the rate of build-up of filter cake was probably reduced. On the other hand, the blocking resistance decreased as well as the mean crossflow velocity increased. This was attributed to Brownian diffusion [3,4], which has an inverse correlation with the particle size. At the mean crossflow velocity of 0.93 m/s, the back transport velocity (>1.47*10-5 m/s) of particles smaller than 0.0007 m (0.7 nm) was larger than their permeation velocity (1.4*10-5 m/s) due to Brownian diffusion. Consequently, hardly any deposition of particles smaller than 0.0007 m (0.7 nm) occurred [5]. When the mean crossflow velocity was increased even further, from 0.93 to 1.86 m/s, colloids smaller than 0.0013 m (1.3 nm) were prevented from depositing due to increased Brownian diffusion. As a result, less small colloids (between 0.7-1.3 nm) deposited, and pore blocking was further reduced. The blocking resistance (Rb) was further classified into irreversible and reversible blocking resistance (Rirb and Rreb) as shown in fig. 5. Increasing the mean crossflow velocity decreased the reversible blocking resistance (Rreb), as interpreted above. Surprisingly, increasing the mean crossflow velocity also decreased the irreversible blocking resistance (Rirb). This phenomenon may be attributed to the enhanced removal of particles blocking the pore entrance (complete blocking), as the shear force sloughing the membrane surface increased from 6.3 to 22.2 Pa, when the mean crossflow velocity was increased from 0.93 to 1.86 m/s. 7.0E+11
5.0E+11 Rb (1/m)
5.0E+11 4.0E+11 3.0E+11 2.0E+11 1.0E+11 0.0E+00 0.50
R irb (1/m)
4.0E+11
Rc (1/m)
Resistance (1/m)
Resistance (m/s)
6.0E+11
Rreb (1/m)
3.0E+11
2.0E+11
1.0E+11
0.0E+00 1.00
1.50
2.00
2.50
Mean crossflow velocity (m/s)
Fig. 4. The effect of mean crossflow velocity on blocking and cake resistance at 52 l/m2h
0.93
1.03
1.44
1.86
Mean crossflow velocity (m/s)
Fig. 5. The effect of mean crossflow velocity on irreversible and reversible blocking at 52 l/m2h
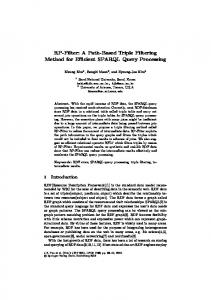
3.4 The effect of backwashing duration on blocking and cake resistance Thirteen consecutive filtration/backwashing cycles were carried out at backwashing durations of 8, 5, 8 and 12 s (tests were carried out in a 2 hour time span), and the results are schematically presented in fig. 6. Very little increase in both blocking and cake resistance (Rb and Rc) was observed during the first 3 filtration cycles (8 seconds), which suggested that the efficiency of backwashing was satisfactory. Consequently, when the duration of backwashing was decreased from 8 to 5 seconds (cycle 4-9), both blocking and cake resistance increased sharply (Rb from 6.1*1011 to 8.6*1011 1/m (41%) and Rc from 2.9*1011 to 5.5*1011 1/m (90%) respectively), indicating rapid deterioration of the backwashing efficiency. Two consecutive filtration cycles, with a backwashing duration of 8 seconds (cycle 10-11), were examined to check the reversibility of membrane fouling. As expected, both blocking and cake resistance decreased (Rb from 8.6*1011 to 7.5*1011 1/m (13%) and Rc from 5.5*1011 to 4.6*1011 1/m (16%) respectively), which suggested that some of the irreversible fouling was partially reversible, when backwashing conditions were intensified (by extending the backwashing duration from 5 to 8 seconds). Further extending the backwashing duration from 8 to 12 seconds (cycle 12-13) improved the backwashing efficiency even further, however, neither the blocking nor the cake resistance could be restored to the original value in the first
6 filtration cycle (Rb was 6.3*1011 1/m compared with the initial value 5.5*1011 1/m and Rc was 3.5*1011 1/m compared with the initial value 2.6*1011 1/m), which may be due to the fact that accumulated foulants were only partly reversible by hydraulic cleaning (backwashing). Another possibility may be that more two cycles employing these more stringent backwashing conditions (longer backwashing duration) are needed to remove foulants accumulated in previous filtration cycles. 1.0E+12
BW duration (s)
14
9.0E+11
Rb Rc
12 10
7.0E+11 6.0E+11
8
5.0E+11 6
4.0E+11 3.0E+11
4
2.0E+11
BW duration (s)
Resistance (1/m)
8.0E+11
2
1.0E+11 0.0E+00
0 0
1
2
3
4
5
6
7
8
9
10
11
12
13
No. of filtration/BW cycle
Fig. 6. The effect of backwashing duration on blocking and cake resistance
4. Conclusions • A simple method was developed and successfully applied to quantify the blocking and cake resistance for test results from an MBR pilot plant (moderate to significant fouling conditions). But in a few cases (low fouling conditions), where the flux was too low or the mean crossflow velocity was too high, the applicability of the method was poor. • The blocking phase estimated from the TMP vs. time curve varied greatly during the MBR pilot tests. The extreme cases were found at low flux (18 l/m2h) and high mean crossflow velocity (1.86 m/s), as the blocking phase could hardly be observed at all. This phenomenon was mainly attributed to the fact that little colloids deposited at these conditions. However, in all tests, the blocking phase was less than 8 seconds. • Increasing the mean crossflow velocity flushing the membrane surface (from 0.93 to 1.86 m/s) significantly decreased both blocking resistance (Rb) and cake resistance (Rc). This was mainly attributed to the increased particle back transport velocity due to Brownian diffusion, shear induced diffusion and inertial lift phenomena. • The extent of blocking (Rb) and cake resistance (Rc) was strongly controlled by backwashing duration in the range of 5-12 seconds. The longer the backwashing duration, the lower the blocking and cake resistance. References [1] G.W. Govier and K. Aziz, the Flow of Complex Mixtures in Pipes, Litton Educational Publishing, 1972. [2] W.R. Bowen, J.I. Calvo, and A. Hernandez, Steps of membrane blocking in flux decline during protein microfiltration, J. Mem. Sci., 101(1-2) (1995), 153-165. [3] G. Belfort, R.H. Davis and A.L. Zydney, Review the behavior of suspensions and macromolecular solutions in cross-flow microfiltration, J. Mem. Sci., 96 (1994) 1-58. [4] R. H. Davis, Modelling of fouling of crossflow microfiltration membranes, Sep. and Puri. Meth., 21(2) (1992) 75-126. [5] E. Tardieu, A. Grasmick, V. Geaugey, and J. Manem, Hydrodynamic control of bioparticle deposition in a MBR applied to wastewater treatment, J. Mem. Sci., 147 (1998) 1-12.