Figure 5.6 shows an image of a circuit board and a light fixture mounted within a w~ll. The imaging was performed using a synthetic image for- m.er based on the ...
5 Conventional and Emerging Waveforms for Detection and Imaging of Targets behind Walls* Fauzia Ahmad.and Ram M. Narayanan CONTENTS 5.1 Introduction ................................................................................................. 157 5.2 Conventional Radar Waveforms .............................................................. 158 5.2.1 Short-Pulse Waveforms ................................................................. 158 5.2.2 Frequency-Modulated Waveforms .............................................. 160 5.2.3 M-Sequence Phase-Coded Waveforms.: ..................................... 161 5.2.4 Noise· Waveforms ........................................................................... 162 5.2.5 Ultra-Wideband Waveforms ......................................................... 163 5.2.6 Results Using Conventional Waveforms .................................... 163 5.3 Environmental Effects on Wave Propagation ........................................ 168 5.3.l Considerations for Scene Resolutions, Antenna Size, and Operating Frequency ............................................................. 170 5.4 Emerging Waveforms for Through-the-Wall Radar ............................. 172 5.4.l Matched Illumination Waveforms .............................................. 172 5.4.2~ Chaotic Waveforms ........................................................................ 178 5.4.3 Orthogonal Frequency-Division Multiplexed Waveforms ...... 180 5.5 Conclusions ................................................................................................. 181 References ............................................................................................................. 182
5.1 Introduction To date, waveforms used for through-the-wall detection and imaging range from classical (such as short pulse or impulse, and linear or stepped frequency modulated [FM]) to sophisticated (such as noise or noise-like, and M-sequence phase coded). Each of these waveforms has its own advantages '
.
* Portions reprinted, with permission, from [22, © 1996 SPIE], [26, © 2008 SPIE], and [33, © 2001 IET].
157
158
Throu~h-the-Wall
Radar Imaging
and limitations. Most of these waveforms -are traditionally designed for range resolution, Doppler resolution, and ambiguity -considerations. However, in addition to considerations for scene resolutions, the choice of a suitable waveform for through-the-wall applications depends on a variety of other important factors, such as the -environment (wall type and thickness, building layout, clutter type, and electromagnetic interference), operational requirements (need for tracking and/or imaging, human activity recognition, need for covertness, and size and weight constraints), and applicable frequency restrictions. Emerging waveform design techniques, such as target signature exploitation and chaotic waveforms, address these constraints and challenges associated with propagation through walls. In Section 5.2, we describe different conventional waveform types with special reference to the unique requirements for through-the-wall applications. In Section 5.3, we discuss the effects of the operational and electromagnetic environment on wave propagation and describe how the waveforms can be appropriately selected to enhance the detection of targets behind walls. Section 5.4 discusses the design of emerging waveforms to optimize target detection,-with special reference to matched illumination-based signature exploitation waveform design. Conclusions are presented in Section 5.5.
5.2 Convelj:tional Radar Waveforms Conventional radar waveforms used in through-th~-wall radar imaging and sensing encompass a broad range of signals, ranging from classical such as short pulse or FM to more sophisticated waveforms including phase coded and noise [1-17]. In this section, we briefly discuss these waveforms with special reference to the unique requirements of through-the-wall applications, 5.2.1 Short-Pulse Waveforms
The timing diagram of a short-pulse waveform is shown in Figure 5.1. The radar transmits short pulses of width 'tP at a pulse interval of TP' which is _the reciprocal of the pulse repetition frequency, fp· One or more cycles of the operating frequency, f 0t are contained within the pulse width. The range resolution for the short-pulse radar is given by
8R =
C'tp
2
I
(5.1)
where c is the speed of light. Thus, a shorter pulse yields better range resolution, but requires a higher operating frequency in order that one or more_1---cycles can reside within the pulse. The equivalent bandwldth for a shortpulse radar is the reciprocal of its pulse width, that is, Beq =1/'tp.
Conventional and Emerging Waveforms for Detection
159
·Time FIGURE 5.1
Timing diagram of a short-pulse waveform.
f
I
·I
I
In the case of an impulse radar, just one cycle of the operating frequency is contained within the pulse width; The single bipolar pulse is customarily idealized as the derivative of a Gaussian pulse. Detailed discussions related to the performance and implementation of impulse ultra-wideband (UWB) . radars are given in Chapter 10. The target range is obtained by noting the round-trip time to the target, T, using which the range is obtained as
R=cr. 2
(5.2)
The pulse interval TP is chosen such that the expected returns from all targets up to the maximum range, R 111axi arrive before the next pulse transmission; thus, 'T'
> 2Rmax
.Lp -
(5.3)
c
The duty cycle of the short-pulse waveform is given by 't
Duty cycle =. ;
.
(5.4)
p
The average transmit power of. the short-pulse waveform is related to the peak power through the duty cycle, that is, · · ·. _ Pave - Ppk
_ Ppk'tp
·(Duty cycle)---. TP
(5.5)
1-
160
Through-the-Wall Radar Imaging
One of the disadvantages of a short-pulse waveform is the fact that the antennas must have a good impulse response, which requires some type of antenna loading to minimize ringing effects. Although one disadvantage is the difficulty in generating sharp pulses of short width with fast rise and fall times, a successful implementation of an impulse UWB radar is described in Chapter 10. 5.2.2 Frequency-Modulated Waveforms
The timing diagram of an FM waveform is shown in Figure 5.2. Figure 5.2a, depicts the linear FM waveform while Figure 5.2b shows the stepped fre-. quency waveform. Both of these are continuous-wave (CW) radar waveforms, that is, their transmissions are always ON. In both cases, the transmission starts from a start frequency,fv and ends at the stop frequency,fH· The modulation interval is TP, which is the reciprocal of the modulation frequency, f m· The frequency change is linear in the case of a linear FM waveform, while it steps through a set of N intermediate frequencies in the case of the stepped .FM waveform, each present over a subinterval Tp!N. The bandwidth of the system is the difference between the stop and the start frequencies, that is,
....
..
.r 1 : -~~-
Ji"
(a)
Time :·
·:
~
°":8s
500MHz or if ~=B/f>0.25, where the center frequency fc=(fH + fJ/2. An advantage of UWB waveforms is their ability to respond to scattering features of different scales, thereby facilitating better target recognition com.pared to narrowband waveforms, as seen in Figure 5.5. A disadvantage is the higher cost and lower performance of various wideband components needed in UWB radars, such as amplifiers, mixers, and circulators. 5.2.6 Results Using Conventional Waveforms
Less signal attenuation has been experimentally observed through materials for short-pulse radars com.pared to CW radars, such as FM radars [20]. The c
~
164
Through-the-Wall Radar Imaging
40
-~=0.5 -~=1
35
s"'
::s. ""
-
~=1.5
30 25
tr.I u 20
~
g"" 15 10
5 0 -5
0
5
10 Range (m)
15
20
25
FIGURE 5.5 Response of UWB waveforms to scattering features of different scales.
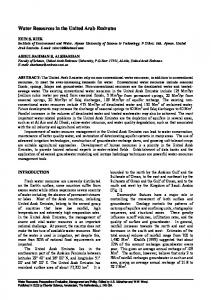
comparison was performed using the second derivative of a Gaussian pulse operating at a center frequency of 2 GHz and a 3 dB bandwidth of 2.2 GHz, and a network-analyzer-generated CW signal swep.t over the 1-3GHz frequency band. This m.ay be attributed to the fact that CW radars operate under steady state conditions, in which multiple reflections within the wall material m.ay cause resonances and lower the received power. It has been suggested that the use of swept-frequency FM techniques is superior to pulse waveforms for clutter rejection, which can be accomplished using phasor differencing, that is, wherein sequential radar returns are coherently subtracted from. one another [6]. Using swept frequencies in the VHF/UHF range and m.ultistatic trilateration, a high level of clutter suppression was achieved for detecting hum.ans moving about behind walls. Millimeter-wave radar frequencies have been suggested for use in situations whence the barrier to be penetrated is low-loss (e.g., drywall or glass) . and non-scanning small antennas must be used [3]. The use of such high frequencies would provide adequate azimuth resolution, for a given antenna size, without the need for synthetic aperture radar (SAR) processing. A m.illim.eter.:.wave swept-frequency system. was also successfully used to provide high-resolution images of objects hidden inside wall cavities [21]. Figure 5.6 shows an image of a circuit board and a light fixture mounted within a w~ll. The imaging was performed using a synthetic image form.er based on the matched filter (MF), that is, using the well-known backprojection algorithm.. · By using two spatially separated receive antennas and com.paring the signal's time of arrival (TOA) at each antenna, it is possible to detect targets behind walls reliably. However, false targets appear due to multiple reflections and interactions between targets; as shown in Figure 5.7a which depicts a scene consisting of a bottle and a metallic ball [16]. The false target problem.
_ _ _ _ _ _ _ _ _ _ _ _ _ _ _ _ _ _ _ _ _ _ _ _ _ _ _ _ _ _ _ _ _ _ _ _ _ __;!::
165
Conventional and Emerging Waveforms for Detection
10
~ ....
12
..fl .....
14
Q)
0
cau
-;:::
16 .... Q)
>
18 20
28
26
24 22 20 18 Horizontal offset (in.)
16
FIGURE 5.6 Image of a light fixture and a circuit board hidden inside a wall. (Adapted from Greneker, E.F. et al., High resolution imaging of objects located within a wall, in Proceedings of the SPIE Conference on Radar Sensor Technology X, Qrlando, FL, vol. 6210, pp. 621005-1-621005-10, April 2006. With permission. © 2006 SPIE.)
300
300
250
250
200
200
-~ 150
-~"' 150
100
100
50.
50
"'
~
(a)
~
RXl TX RX2
X-axis
(b)
FIGURE 5.7
(a) The intensity plot under multiple targets where a bottle and a metallic ball are placed in front of the radar. (b) Elimination of the false targets by combining the results of two different positions of the antennas. The color scale is linear. (Adapted from Engin, E. et al., Mierow. Opt. Techn. Let., 49(2), 320, 2007. With permission. © 2007 Wiley.)
can be eliminated by combining TOA images from two different antenna orientations, as shown in Figure 5.7b [16]. Such noncoherent imaging is discussed. in Chapter 4. Using an M-sequence UWB radar system at a 9 GHz clock frequency and a 511 M-sequence chip, through-the-wall measurements were performed to detect metallic and nonmetallic objects (wooden cupboard). Corrections were made to take into account the slower speed of wave propagation through the wall, and the wall-corrected images are shown in Figure 5.8 [11]. When the wall thickness and the permittivity were known, the objects behind the wall could be correctly localized.
166
Through-the-Wall Radar Imaging
2
2
0 05 .
(a)
l
1.5 2 2.5 3 3.5 4 4.5 5 5.5 6 Z(m)
(b)
FIGURE 5.8 Images of (a) a metal plate and (b) a wooden cupboard behind the wall using an M-sequence UWB radar. (Adapted from Aftanas, M. et al., Through wall imaging of the objects scanned by M-sequence UWB radar system, in Proceedings of Eighteenth International Conference on Radioelektronika, Prague, Czech Republic, doi: 10.1109/RADIOELEK.2008.4542687, April 2008. With permission. © 2008 IEEE.)
Pure noise continuous waveforms have been successfully used for imaging stationary inanimate targets and indoor features, such as doors and walls using SAR processing, as shown in Figure 5.9b [12]. A 250-500 MHz noise radar was moved along a straight-line path, as indicated by the arrows in Figure 5.9a, to image a trihedral reflector. Pure noise waveforms are also seen to be able to detect humans in office room scenarios at distances of up to 2 m behind a cinder block wall, as indicated in Figure 5.10 [13]. However, furniture clutter poses a major problem. Pseudonoise waveforms have also been used to track humans behind rubble and walls and to reconstruct room interiors using an M-sequence radar operating over the 8-2500 MHz frequency band [14]. · UWB waveforms· based on very short pulses have been successfully employed to detect human beings behind thick concrete walls [17]. Figure 5.11 shows the reflected echoes in the absence and presence of a human for the 0 owerboxes
Wall
g
f.
Door
Q)
2 4
bl)
i::
.
* .·
.
Door
.AL
Trihedral
"'....
"'"'0 .... u
Wall
6 8 10
Door
4 (a)
(b)
6 8 10 12 14 16 Down range (m)
FIGURE 5.9 Imaging resuHs using pure noise waveforms: (a) Target scenario and (b) SAR image. (Adapted from Narayanan, R.M. et al., IEE Proc. Radar Sonar Navig., 151(3), 143, 2004. With permission. ©2004 IET.)
Conventional and Emerging Waveforms for Detection
4
1
0.6
2
0.5
N
0.4
1.5
g
(a)
1
0.6
2
0.5
1.5
0.4
0
1.5
0.3 0.2
0.5
0.1 -1 -0.5 0 0.5 X(m)
0.7
2.5
1
0.2
0.5
0.8
N
.0.3
1
0.9
3
0.7
2.5
1
3.5
0.8
3
g
4
0.9
3.5
167
0.1 -1 -0.5
(b)
0 0.5 X(m)
1
1.5
0
FIGURE 5.10
Detection of a human through a cinder block wall using pure noise waveforms in an office room environment. In (a), the human is lm behind the wall, and in (b), the human is 2m behind the wall. The dotted circle shows the actual location of the human. The color scale is linear. (Adapted from Chen, P.H. et al., Through wall ranging and imaging using UWB random noise waveform: System design considerations and preliminary results, in Digest 2009 IEEE International Symposium on Antennas and Propagation, Charleston, SC, doi: 10.1109/ APS.2009.5172369, June 2009. With permission. © 2009 IEEE.)
]' .!::!
~ ... 0
s
Q)
l
i.·
:.:
~ Q)
E4
.:; E ...0
0.5 ·El:·.,······r:i···· ----··· ········t·······-·····»···+··········
s
0
I
_·,,-
C····
!-.·_;•.·_,_, ·f'·•.··-
~ - ' '-~ '
!
·-
~.--
f:;:
:s
E