guideline, aligned with concepts developed by Lawrence Weed (4). Weed emphasizes that the information infrastructure was lacking at the time of his writing ...
22 Converting Hematology Based Data into an Inferential Interpretation Larry H. Bernstein1,*, Gil David2, James Rucinski3 and Ronald R. Coifman2 2Yale
1Triplex,
University Department of Mathematics, Program in Applied Mathematics, New Haven, CT, 3New York Methodist Hospital-Weill-Cornell, Brooklyn, NY USA 1. Introduction The most commonly ordered test used for managing patients worldwide is the hemogram, with or without the review of a peripheral smear. The measured features in a standard hemogram has undergone modification of the over the last 30 years with an expansion to the panel of tests. The initial hemogram was the hemoglobin, hematocrit, and total white cell count, to which platelet count, lymphocytes and neutrophils were added as the necessary vital dye stains and the resolution were substantially improved. The revolutionary Coulter principle used impedance of the cells passing through a narrow window. Newer instruments may used both impedance and/or flow cytometric principles. Yet the accurate identification of reticulocytes, measurement of cellular hemoglobin, measurement of immature granulocytes, lymphoid or myeloblasts, identification of clumped platelets interfering with identification of large platelets were all challenges to overcome. The hemogram provides a vital window to visualize the cellular changes associated with the production, release or suppression of the formed elements from the blood forming organ to the circulation. In this chapter, we shall not be concerned with the specific use of the hemogram in assessing disorders to the coagulation pathways or its use in detection of hematological and non-hematological tumors. Rather in the hemogram we can view data reflective of a broad spectrum medical conditions affecting most patients presenting to a physician who are then referred to a specialist for example in hematology-oncology or infectious diseases. The theme of what we are about to present is that once we go beyond qualitative changes to the morphology of the cellular components of blood, we have also to consider their quantitative characteristics expressed as measurements of size, density, and concentration, which results in more than a dozen composite variables, including the mean corpuscular volume (MCV), mean corpuscular hemoglobin concentration (MCHC), mean corpuscular hemoglobin (MCH), total white cell count (WBC), total lymphocyte count, neutrophil count (mature granulocyte count and bands), monocytes, eosinophils, basophils, platelet count, and mean platelet volume (MPV), and flags to denote blasts, reticulocytes, platelet clumps, and so on. If you were to add the comprehensive metabolic panel, which includes
542
Hematology – Science and Practice
monovalent and divalent cations and anions, total CO2, total protein and albumin, to name a few, there is a potential for information overload to the physician. These data in turn have to be comprehended in context with vital signs, key symptoms, and an accurate medical history. Consequently, the limits of memory and cognition are tested in medical practice on a daily basis. In this chapter we will discuss problems in the interpretation of data generated by automated laboratory diagnostic machinery, as experienced by the physician, and how through better design of the software (middleware) that presents this data the situation could be improved.
2. The current status of the physician-laboratory interface The clinical laboratory has several divisions. Microbiology and anatomic pathology are the oldest, and they are the least automated, but they have rigorous definitions for their interpretation, as is true for immunohematology. Hematology and chemistry are the most automated, but their interpretations are more difficult than the other disciplines. To start with we will consider automated chemistry, hematology, and immunology with large highthroughput sample platforms. These analyzers have enhanced performance by interface with middleware, which have embedded rules to accept or reject a test result based on a result lying outside an assigned confidence limit, or based on a difference from a previous measurement within an assigned time interval in hours or days. A middleware is a minicomputer installed either between an instrument and a laboratory information system or between an instrument and a hospital information system. The middleware handles an enormous transaction rate of test workflow that would otherwise compete with physician interactions in trying to access the data output. The middleware also carries out on-line quality control checks, monitors the completion of panel accessions, and does “delta” checks for excessive differences between measurements taken in sequence. Further, depending on whether a test is measured from unclotted and unspun blood, or from plasma or serum fraction, hematology, chemistry and immunology testing are tested with different turnaround times (time from receipt to time to report). In all of these cases, tests from different core “instruments” or laboratory “facilities” of laboratory testing have to be interpreted without conflict in the production “silo” (the term refers to a separate mode of production that is separate from and not interoperable with other information sources).
3. Data overload and unstructured The computer architecture that the physician uses to view the results is not openarchitecture, and the middleware solutions used to overcome the problem are insufficient in that the data is not recombined from the rigid lists into a structured format that readily enables the physician to interpret the report. Consequently the results are more often than not presented as the designer would prefer, and not as the end-user would like. In order to optimize the interface for physician, the system would have a “front-to-back” design, with the call up for any patient ideally consisting of a dashboard design that presents the crucial information that the physician would likely act on in an easily accessible manner. The problem of the user having to adjust to what the system confronts them with is described by Didner (1) in an internal Bell Labs memo approved for external release. The key point being that each item used has to be closely related to a corresponding criterion needed for a decision. Currently, improved design is heading in that direction. In removing this
Converting Hematology Based Data into an Inferential Interpretation
543
limitation the output requirements have to be defined before the database is designed to produce the required output. The ability to see any other information, or to see a sequential visualization of the patient’s course would be steps to home in on other views. In addition, the amount of relevant information, even when presented well, is a cognitive challenge unless it is presented in a disease- or organ-system structure. So the interaction between the user and the electronic medical record has a significant effect on practitioner time, ability to minimize errors of interpretation, facilitate treatment, and manage costs. This is a correction for a view from the mere transmission of a body of automated tests that are generated at sites not near to the patient, often with a high priority reporting required from the operating room, the emergency room, or the intensive care units in order to make triage decisions or to adjust fluids or make treatment decisions. The reality is that clinicians are challenged by the need to view a large amount of data, with only a few resources available to know which of these values are relevant, or the need for action on a result, or its urgency. An approach (2,3), called the foresighted-practice guideline, aligned with concepts developed by Lawrence Weed (4). Weed emphasizes that the information infrastructure was lacking at the time of his writing (1997), and that tools are needed to extend the mind’s capability to process large numbers of relevant variables. The challenge then becomes how fundamental measurement theory can lead to the creation at the point of care of more meaningful actionable presentations of results (5). WP Fisher (6) refers to the creation of a context in which computational resources for meeting the challenges will be incorporated into the electronic medical record. The one which he chooses is a probabilistic conjoint (Rasch) measurement model (7), which uses scale-free standard measures and meets data quality standards. He illustrates this by fitting a set of data provided by Bernstein (19)(27 items for the diagnosis of acute myocardial infarction (AMI) to a Rasch multiple rating scale model testing the hypothesis that items work together to delineate a unidimensional measurement continuum. The results indicated that highly improbable observations could be discarded, data volume could be reduced based on its internal consistency, and that consistency could be used to increase the ability of the care provider to interpret the data. The use of a computer-derived algorithm has been shown to aid the physician (8,9). A huge amount of progress has occurred regarding model construction and validation in the last 11 years. An ordinal regression (adjacent category logit model )(10) used on the AMI problem (11) is superceded by a Latent Class Model of Jay Magidson and Jeroen Vermunt (LatentGOLD, Statistical Innovations, Medford, MA)(12). The LatentGOLD has LC Cluster models, DFactor models, and LC Regression models and has the advantage of allowing performance of LC analyses on data containing more than just a few variables. It uses the fundamental methods of model fit (13,14) established as Alaike (AIC)(14,15,16) and Bayes (BIC)(14) information criteria. These have not been applied to classifying a large and complex medical data set.
4. Classified data a separate issue from automation On the other hand, automation itself may not be as important as the critical value of the information provided. The disciplines required in blood banking and in microbiology have only been recently automated, but their importance is readily understood with the exception of an error in blood sample, or its contamination. To an extent, blood screening has become a large scale production to service the user population.
544
Hematology – Science and Practice
The classification of blood types emerged at the turn of the last century firstly as a result of the work of Paul Ehrlich (17) establishing a groundwork for immunology, and then later Karl Landsteiner’s seminal work in laying the foundation for the blood groups (17). These works resulted in a well-defined classification of a set of identified blood group antigens and the absence of antibody in the individual’s serum against the blood type, with the exception of auto-antibody reactions. 4.1 Microbiology classification Microbiology classification has its origin in the taxonomic principles set down by Bergey’s Manual of Determinative Bacteriology, which originated in 1857, and is maintained by Bergey’s Trust. It is guided by observable features that are key for separating groups and subgroups. The kind of features that we readily identify are gram stain positivity, colonies on agar, cocciform or bacillary shape, outer capsule, motility, the clusters formed, the metabolic features in growth media, and even the expected antibiotic reactivity. Thus, we have an example: in Table 1. GROUP 4 Description: Gram Negative, Aerobic/Microaerophilic rods and cocci Key differences are: pigments/fluorescent, motility, growth requirements, denitrification, morphology, and oxidase, read Genera descriptions Examples: Acinetobacter, Pseudomonas, Beijerinckia GROUP 5 Description: Facultatively Anaerobic Gram negative rods Key differences are: growth factors, morph., gram rxn., oxidase rxn., read Genera descriptions Examples: Family Enterobacteriaceae and Vibrionaceae GROUP 17 Description: Gram-Positive Cocci Key differences are: oxygen requirements, morph., growth requirements (45°C and supplements), read Genera descriptions Examples: Micrococcus, Staphylococcus, Streptococcus, Enterococcus, Lactococcus Table 1. Typical classes of bacteria Table 1 does not further divide into subclasses, which requires metabolic differentiation in growth media. 4.2 Feature extraction This further breakdown in the modern era is determined by genetically characteristic gene sequences that are transcribed into what we measure. Eugene Rypka contributed greatly to clarifying the extraction of features in a series of articles, which set the groundwork for the methods used today in clinical microbiology (18,19). The method he describes is termed Sclustering, and will have a significant bearing on how we can view hematology data. He describes S-clustering as extracting features from endogenous data that amplify or maximize structural information to create distinctive classes. The method classifies by
Converting Hematology Based Data into an Inferential Interpretation
545
taking the number of features with sufficient variety to map into a theoretic standard. The mapping is done by a truth table, and each variable is scaled to assign values for each: message choice. The number of messages and the number of choices forms an N-by N table. He points out that the message choice in an antibody titer would be converted from 0 + ++ +++ to 0 1 2 3. In looking at laboratory values the practitioner separates any test by low normal moderately-high high. Even though there may be a large number of measured values, the variety is reduced by this compression, even though there is risk of loss of information. Yet the real issue is how a combination of variables falls into a table with meaningful information. He describes how syndromic classification is uniquely valuable for clinical laboratory information by amplifying information in the course of making a patternidentifiable syndromic classification. Rudolph, Bernstein and Babb (20) used it for the diagnosis of acute myocardial infarction.
5. Optimal weighting and value assigned to predictor variables We are interested in classifying data as essential for determining optimal decision limits for tests, and for analyzing variable combinations that are essential and optimal for separating the groups that are separated with fewest errors. This is only possible by reducing data uncertainty. We are concerned with accurate assignment into uniquely variable groups by information in test relationships. One determines the effectiveness of each variable by its contribution to information gain in the system. The reference or null set is the class having no information. Uncertainty in assigning to a classification is only relieved by providing sufficient information. One determines the effectiveness of each variable by its contribution to information gain in the system. The possibility for realizing a good model for approximating the effects of factors supported by data used for inference owes much to the discovery of Kullback-Liebler distance or “information” (21), and Akaike (22) found a simple relationship between K-L information and Fisher’s maximized log-likelihood function (23). 5.1 Advances in applied mathematics Perhaps the current exponential growth of knowledge since the mapping of the human genome a decade ago has been enabled by parallel advances in applied mathematics, which has not been a part of the entrance competencies for premedical education, and is now taught to some extent in medical and postmedical education for a better understanding of modern clinical trials. The knowledge and use of the science of complexity in much of what we encounter is brought to account by Ray Kurzweill (24). In a univariate universe, we have significant control in visualizing data because we can be confident in separating unlike data by methods that rely on distributional assumptions, although errors in assignment can be substantial. The median (by rank order assignment is the best method of assignment under the circumstances). In reality, there is likely to be a different assignment of predictor values given an association with a different disease entity. In order to better define the target output another variable is necessary. As we attend to more associated outputs, the number of predictors is expanded. Now we begin to have multiple classes delineated by the confidence limits of the conjoint predictors. As the number of separate categories increases, the size of the database has to increase to limit the error in the so called model representation.
546
Hematology – Science and Practice
5.2 Complexity As the complexity of models have increased to using several predictors for at least two outputs, and the dependencies are not clear, the models used for analysis of the data are derived by tables and use of the goodness of fit. The development of the Akaike Information Criterion (15,16,21,22,23) brought together two major disciplines that had separate developments, information theory and statistics. The powerful tools now available are not dependent on distributional assumptions, and allow classification and prediction. In fact modeling today has a primary goal of finding an underlying structure in studied data sets. A sequence of exploratory programs have been developed by Statistical Innovations, a Boston based company founded by Jay Magidson focused on classification problems with complex data sets, encompassing a mixture of nominal and continuous predictors, and where there is a high complexity with the data sample size may approach the number of predictors (CORExpress® , Latent GOLD® 4.5, LG-Syntax Module, Latent GOLD® Choice , SI-CHAID® , GOLDMineR). Many articles can be cited concerning these advances (25-32). Further, IBM has introduced a software program for Predictive Analytics available in 2011.
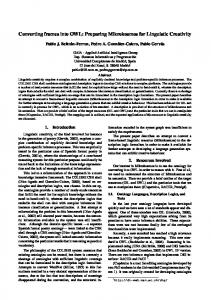
6. Prior experience in similarly developed taxonomies can be applied to hematology We consider a novel approach to medical inference to have considerable parallel with work in bacterial taxonomy, or the rapidly growing work in genomics, proteomics, and translational medicine. In the diagnosis of anemia, we divide these into microcytic, normocytic and macrocytic. We also consider whether there is proliferation of marrow precursors, whether there is domination of a cell line, and whether there is a suppression of hematopoiesis. This gives us a two dimensional model. Then we consider another, the release into the blood of immature cells, for intermediate to the blast stage. Keep in mind that the thalassemias (and hemoglobin H disease) are characterized by moderate to severe microcytosis, and there is no anisocytosis (variation in size), and being a genetic disorder in production of globin chains, there is a high RBC count, whereas, iron deficiency anemia (IDA) differs by lack of iron incorporation into hemoglobin so that there is a low MCV, anisocytosis, and a low RBC count so that the ratio (Mentzer’s index) of the MCV/RBC is very low with thalassemia, but not in IDA. We shall elaborate more on the creation of an evidence-based inference-engine that can substantially interpret the data at hand and convert it in real time to a “knowledge-based opinion”, which is improvable from what exists today by incorporating clinical features and duration of onset into the model. The evaluation of platelet abnormalities is somewhat more limited, but addresses the disorders of platelet numbers and of platelet size, and clumping. This does not discern abnormalities of platelet function (like von Willebrands, or drug induced). When platelets decrease abruptly with disseminated intravascular coagulation (DIC), as in sepsis or with massive trauma, the evidence is pretty good. 6.1 Hematopoiesis Figure 1 is a pictorial diagram of hematopoietic cell lineages that are readily found in texts and cells are delineated further by identification of cell differentiation (CD) antigens. This lineage is expressly important for both the innate response and the humoral response to
Converting Hematology Based Data into an Inferential Interpretation
547
injury. Our knowledge of the innate response has become more and more intimately associated with long term metabolic effects, constitution, and chronic inflammation.
Fig. 1. A common depiction of the evolution of the myeloid and lymphoid cell lines from a multipotential hematopoietic stem cell. The platelets, red blood cells, mast cells and myeloid series are depicted as derived from a common myeloid progenitor cell. A branching from the myeloblast gives the granulocytic cells and the monocyte. Promyelocyte, metamyelocyte and myelocyte are intermediates not shown (band neutrophil is viewed as a neutrophil). The lymphocyte series is being more defined (as the myelocytic) that the naïve depiction by cell differentiation (CD) markers, and interactions are being investigated by cytokine, chemokine and cell signaling pathways. Figure 1 shows a primary separation into a lymphocytic and a myeloid series. Note that the erythrocyte series and platelets are shown to be in lineage from a myeloid progenitor cell. It is conceivable that this picture is an oversimplification, but in clinical application, it is readily understood. This makes sense with respect to the uncommon evolution of myeloid metaplasia into erythroleukemia, but the diagram doesn’t have an obvious connection for myelofibrosis, except for in the monocyte-macrophage linkage. 6.2 Peripheral smear The peripheral smear is only viewed on the basis of flagged features seen on the hemogram. Blasts, indicative of release of very immature lymphocytes or myeloblasts are flagged and have to be reviewed by a pathologist before release, or done by the hematology supervisor and retained for pathologist review. In the case of children, there are numerous lymphocytes, and there may also be normoblasts and reticulocytes released from an active marrow. The presence of small mononuclear cells can be correctly identified by an experienced morphologist, but not necessarily by an automated cell counter. Consequently,
548
Hematology – Science and Practice
proportionately more peripheral smears are evaluated for children than for adults. The greatest problem in the childhood age group is infection or sepsis. The lymphocyte and reticulocyte counts are very high in the infant, and the peak age for acute lymphocytic leukemia is at two years old. This makes it far more difficult to identify myelocytes and metamyelocytes (not shown in Figure 1), indicators of myeloid proliferation, in children than adults (33). The band neutrophil has been used to signify a left shift in myelopoiesis associated with sepsis, but it is quite variable and has been largely disregarded. This has accounted for the use of an automated cell counter that is also a flow cytometer for improved recognition of immature neutrophils below the band count. In the case of the red cell series (not shown) we classify first based on the RBC count, and then on the cell size. By these measures we have a decrease in mature red cell count based on WHO standards, adjusting for menstruation and pregnancy in women. We at the same time consider whether the RBC is normocytic, microcytic, or macrocytic and/or megaloblastic. What about increased or decreased production? Thalassemia is characterized by small cells that are neither hypochromic, or decreased in the peripheral circulation. Platelets may be large, they may be excessive in number, or they may be significantly decreased.
7. Extension of conditions and presentation to the electronic medical record (EMR) We have published on the application of an automated inference engine (34) to the Systemic Inflammatory Response (SIRS), a serious infection, or emerging sepsis. We can report on this without going over previous ground. Of considerable interest is the morbidity and mortality of sepsis, and the hospital costs from a late diagnosis. If missed early, it could be problematic, and it could be seen as a hospital complication when it is not. Improving on previous work, we have the opportunity to look at the contribution of a fluorescence labeled flow cytometric measurement of the immature granulocytes (IG)(35), which is now widely used, but has not been adequatedly evaluated from the perspective of diagnostic usage. We have done considerable work on protein-energy malnutrition (PEM)(36-38), to which the automated interpretation is currently in review (39). Of course, the cholesterol, lymphocyte count, serum albumin provide the weight of evidence with the primary diagnosis (emphysema, chronic renal disease, eating disorder), and transthyretin would be low and remain low for a week in critical care. This could be a modifier with age in providing discriminating power. 7.1 Design of EMR The current design of the Electronic Medical Record (EMR) is a linear presentation of portions of the record by services, by diagnostic method, and by date, to cite examples. This allows perusal through a graphical user interface (GUI) that partitions the information or necessary reports in a workstation entered by keying to icons. This requires that the medical practitioner finds the history, medications, laboratory reports, cardiac imaging and EKGs, and radiology in different workspaces. The introduction of a DASHBOARD, a visual panel of essential information on the computer screen that is widely used in business organizations, has allowed a presentation of drug reactions, allergies, primary and secondary diagnoses, and critical information about any patient the care giver needing access to the record. The advantage of this innovation is obvious. The startup problem is what information is presented and how it is displayed, which is a source of variability and a key to its success.
Converting Hematology Based Data into an Inferential Interpretation
549
7.2 Dashboard We are proposing an innovation that supercedes the main design elements of a DASHBOARD and utilizes the conjoined syndromic features of the disparate data elements. So the important determinant of the success of this endeavor is that it facilitates both the workflow and the decision-making process with a reduction of medical error. This has become extremely important and urgent in the 10 years since the publication “To Err is Human” (40), and the newly published finding that reduction of error is as elusive as reduction in cost. Whether they are counterproductive when approached in the wrong way may be subject to debate. 7.3 Syndromic classification In order to clarify the concept of syndromic classification we make a distinction between lists of diseases that are assigned to abnormal test results and can be appended to test results. The oldest application has been in the identification of bacteria after culture isolation using growth in defined media that identify genetically determined metabolic pathways characteristic for each organism. A solid foundation in this work was elaborated by Rypka (18, 19). This was made less complicated by the genetic complement that defines its function. We introduce an AUTOMATED inference engine processing the data and making an interpretation available to the ordering physician and can anticipate an enormous impact on diagnosis and treatment. It addresses the complexity of inputs and enables rather than disables the practitioner. The method identifies outliers and combines data according to commonality of features. In some cases there may be conditions that are aggregated by similarity and dissimilarity into variants of the same condition with different treatment responses. How can we have confidence that we can successfully approach this problem in a new way? In the first place we are able to construct an interpretation of the composite data that is consistent with how a practitioner views multisystem pathophysiology in service of clinical decision-making.
8. A new inference methodology identifies and classifies anomalies The main mathematical breakthroughs are provided by accurate patient profiling and inference methodologies in which anomalous subprofiles are extracted and compared to potentially relevant cases. Our methodologies organize numerical medical data profiles into demographics and characteristics relevant for inference and case tracking. As the model grows and its knowledge database is extended, the diagnostic and the prognostic become more accurate and precise. As an example, inputs from test data such as hematology results are processed for anomaly characterization and compared with similar anomalies in a data base of 30,000 patients, provide diagnostic statistics, warning flags, and risk assessment. These are based on past prior experience, including: diagnostics and treatment outcomes (collective experience). The system was trained on this database of patients, built the learning knowledge base and used to analysis and diagnosis 5,000 new patients. Our system identified successfully the main risks with very high accuracy (more than 96%) and very low false rate (less than 0.5%)(34).
550
Hematology – Science and Practice
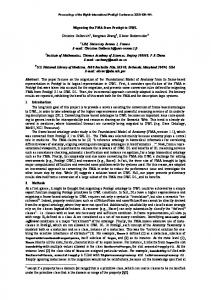
9. Representation and conclusion The main benefit is a real time assessment as well as diagnostic options based on comparable cases, flags for risk and potential problems as illustrated in Figure 2. Figure 2 depicts the following case acquired on 04/21/10. The patient was diagnosed by our system with severe SIRS.
Fig. 2. The depiction of a patient diagnosed with severe systemic inflammatory response syndrome (SIRS), which may evolve into multiple organ failure (MODS), and death by circulatory collapse (systemic shock) if not arrested, depending on systemic functional reserve and successive stress. The far right is a pie chart of measured effects, and primary and secondary diagnoses. The middle lists the diagnoses found above which there is a scale with the risk. The left is patient demographics. We anticipate that the effect of implementing this diagnostic amplifier would result in higher physician productivity at a time of great human resource limitations, safer prescribing practices, rapid identification of unusual patients, better assignment of patients to observation, inpatient beds, intensive care, or referral to clinic, shortened length of patients ICU and bed days.
10. References [1] Didner RS. Back-to-Front systems design: A guns and butter approach. Unpublished research, 1979. Bell Laboratories, Piscataway, NJ 08854. [2] Naegele TA, Wetzler HP. The foresighted practice guideline model: A win-win solution. http://www.swcp.com [3] Naegele TA. Practice guidelines and clinical decision making. J Osteopath Med. March 1993:53-8. [4] Weed L. New Connections between medical knowledge and patient care. Brit Med J 1997; 315:231-5. [5] Haux R. Health information systems - past, present, future. Int J Med Inform. 2006; 75(34):268-81. Epub 2005 Sep 19. [6] Fisher, W. P., Jr., Bernstein, L. H., Qamar, A., Babb, J., Rypka, E. W., & Yasick, D. (2002, February). At the bedside: Measuring patient outcomes. Advance for Administrators of the Laboratory, 11(2), 8, 10 [http://laboratory-manager.advanceweb.com/Article/At-the-Bedside-7.aspx].
Converting Hematology Based Data into an Inferential Interpretation
551
[7] Fisher, W. P., Jr., & Burton, E. (2010). Embedding measurement within existing computerized data systems: Scaling clinical laboratory and medical records heart failure data to predict ICU admission. Journal of Applied Measurement, 11(2), 271287. [8] Linacre JM. Many-Facet Rasch Measurement. 1994. Mesa Press. Chicago,IL. [9] Qamar A, McPherson C, Babb J, Bernstein LH, et al. The Goldman algorithm revisited: prospective evaluation of a computer-derived algorithm versus unaided physician judgement in suspected acute myocardial infarction. Amer Heart J 1999; 138:705-9. [10] Goldman L, Weinberg M, Weisberg M, Olshen R, Cook EF, Sargent RK, Lamas GA, Dennis C, Wilson C, Deckelbaum L, Fineberg H, Stiratelli R. A computer-derived protocol to aid in the diagnosis of emergency room patients with acute chest pain. N Engl J Med 1982;307:588-596. [11] Bernstein LH, Qamar A, McPherson R, Zarich S. Evaluation of a new graphical ordinal regression model (GOLDminer) in the diagnosis of myocardial infarction utilizing clinical features and laboratory data. http://www.statisticalinnovations.com/products/goldminer_tutorial2.html [12] Magidson, J. and Vermunt, J.K. Latent class models for clustering: A comparison with K-means. Canadian Journal of Marketing Research, 2002; 20, 36-43. [13] Browne MW, Cudeck R. Alternative ways of assessing model fit. In Testing Structural Equation Models (Bollen KA, Long JS, eds). 1993. Chapter 6. pages 1-34. SAGE Publishers, Inc. Newbury Park, CA. ISBN 0-8039-9507-8 (pbk). [14] Raftery AE. Baysian model selection in structural equation models. In Testing Structural Equation Models (Bollen KA, Long JS, eds). 1993. Chapter 7. pages 163-179. SAGE Publishers, Inc. Newbury Park, CA. ISBN 0-8039-9507-8 (pbk). [15] Akaike H. Factor analysis and AIC. Psychometrika 1987; 52:317-332. [16] Bozdogen H. Model selection and Akaike’s information criteria (AIC): the general theory and irs analytical extensions. Psychometrika 1987; 52:345-370. [17] JW Goding. Emergence of the concept of complementarity and binding between antigen and antibodies: Contributions of Ehrlich and Landsteiner. In (JW Goding) Monoclonal Antibodies. Principles and Practice. Antibody Response. Elsevier Ltd 1996. Chapter 2. pages 7-25. (ISBN 978- 0 -12-287023-1). [18] Rypka EW. Methods to evaluate and develop the decision process in the selection of tests. In Nakamura R. ed. Clinics in Laboratory Medicine.Phila.: WB Saunders Co.1992; 12(2):351-86. [19] Rypka EW, Madar DA. A system for detecting emerging events: the systemscybernetics approach. Presentation: Research Association of Medical and Biological Organizations (RAMBO). Biology department, University of New Mexico, Albuquerque, NM. July 17, 1996. [20] Rudolph RA, Bernstein LH, Babb J. Information induction for predicting acute myocardial infarction. Clin Chem 1988; 34:2031-8. [21] Kullback S, Liebler RA. On information and sufficiency. Annals of Math Statistics 1951; 22:79-86. [22] Akaike H. Information theory as an extension of the maximum likelihood principle. In BN Petrov and F Csaki, Eds. Second International Symposium on Information Theory. Akdemiai Kiado, Budapest. 1973; 267-281.
552
Hematology – Science and Practice
[23] Fisher RA. On the Mathematical Foundations of Theoretical Statistics. Philosophical Transactions of the Royal Society of London. A. 1922; 222:309-368. [24] Kurzweill R. The Singularity is Near: When Humans Transcend Biology. 2005. Viking Press. ISBN 0670033847. [25] Jaynes ET. Bayesian Methods: General Background, ' In Maximum Entropy and Bayesian Methods in Applied Statistics.(Justice JH, ed). 1986, pp 1-26. Cambridge University Press. [26] Skilling J. Classic maximum entropy. In Maximum Entropy and Bayesian Methods in Applied Statistics.Skilling J, ed. 1989. Pp 45-52. Kluwer Publishers, Norwell, MA. [27] Burnham, K. P., and D. R. Anderson. 1998. Model selection and inference: a practical information-theoretic approach. Springer-Verlag, New York, New York, USA. 353 pp. [28] Malakoff D. Bayes offers a 'new' way to make sense of numbers. Science 1999; 286:1460– 64. [29] Magidson J, Vermunt JK. Comparing Latent Class Factor Analysis with the traditional approach in Data Mining. In Bozdogan, ed. Statistical Datamining and Knowledge Discovery. 2004. Chapter 22, pg 373. CRC Press. [30] Vermunt JK, Magidson. In Latent Class Models for Classification. Computational Statistics and Data Analysis. 2003:531-533. [31] Magidson J. Latent Class (Finite Mixture) Segments. How to find themand what to do with them. Sensometrics, Rotterdam. 2010. Presentation. [32] http://statisticalinnovations.com/products/latentgold_v4.html. [33] Roehrl MH, Lantz D, Sylvester C, Wang JY. Age-dependent reference ranges for automated assessment of immature granulocytes and clinical significance in an outpatient setting. Arch Pathol Lab Med 2011; 135(4):471-77. [34] David G, Bernstein L, Coifman RR. Generating evidence based interpretation of hematology screens via anomaly characterization. The Open Clinical Chemistry Journal 2011; 4:101-6. [35] Bernstein LH, Rucinski J.Measurement of Granulocyte Maturation May Improve the Early Diagnosis of the Septic State. Clin Chem Lab Med 2011; 49 (in press) Doi 10.1515/CCLM.2011688 [36] Brugler L, DiPrinzio MJ, Bernstein L. The five year evolution of a malnutrition treatment program in a community hospital. J Comm J Qual Improv 1999; 25(4):191-206. [37] Brugler L, Stankovic A, Bernstein L, Scott F, OSullivan-Maillet J. The role of visceral protein markers in protein calorie malnutrition. Clinical Chemistry and Laboratory Medicine 2002; 12:1360–1369. [38] Brugler L, Stankovic AK, Schlefer M, Bernstein L. A simplified nutrition screen for hospitalized patients using readily available laboratory and patient information. Nutrition 2005; 21:650–658. [39] David G, Bernstein L, Coifman RR. The Automated Malnutrition Assessment. Nutrition Nut-11-00351 (Elsevier) in review [40] Executive Summary. To Err Is Human. (Kohn LT, Corrigna JM, Donaldson MS, eds.) Committee on Quality of Healthcare in America. IOM. National Academy Press 2000. Washington, DC. http// www.nap.edu/books/0309068371/html. ISBN 9780-309-06837-6.