Cooperative Load Balancing in IEEE 802.11 Networks with Cell Breathing. Eduard Garcia. Rafael Vidal. Josep Paradells. Wireless Networks Group - Technical ...
Cooperative Load Balancing in IEEE 802.11 Networks with Cell Breathing Eduard Garcia Rafael Vidal Josep Paradells Wireless Networks Group - Technical University of Catalonia (UPC) {eduardg, rvidal, teljpa}@entel.upc.edu; +34 934137218 Abstract IEEE 802.11 WLANs (Wi-Fi) are widely deployed for providing Internet access in public spaces, known as Hot Spots. In these scenarios, users tend to be “gregarious” and essentially static. Since association and roaming decisions are made by client devices following signal strength criterions (i.e. a client station selects the AP that provides the strongest signal), the users and their load are unevenly distributed between neighboring APs. In this paper we propose a distributed algorithm with which the APs in an IEEE 802.11 WLAN are able to tune their cell size according to their load and also to their neighbor’s load. This technique improves the fairness and the performance levels and is known as Cell Breathing.
1. Introduction It could be said that WLANs based on the IEEE 802.11 set of standards are victims of their own success. The great popularity of these networks has led to its expansion in scenarios for which they had not been originally designed (e.g. mesh topologies, large scale networks, outdoor links, etc.). For example, various studies have shown (e.g. see [1]) that users tend to be concentrated both temporally and spatially, creating highly congested areas known as Hot Spots. Therefore, the load is unevenly distributed across a small number of Access points (APs) in the WLAN. Moreover, although mobility is increasing as users get into the habit of using wireless access, the mobility pattern can still be considered quasi-static in the sense that users tend to remain in the same location for long periods. This situation is compounded by the fact that the association with base stations is determined by the client devices on the basis of signal level measurements, which means that users are generally associated with the closest AP. In other words, although a Hot Spot is served by several APs, most of the users will be connected through the AP that provides the strongest signal. As an inherent consequence, over-loaded APs offer the users in congested areas a very low QoS while nearby APs remain under-utilized. This behavior is determined by the roaming process, which goes as follows [2].
978-1-4244-2703-1/08/$25.00 ©2008 IEEE
A station (STA) keeps track of the Beacon frames received from its current AP. When the quality of beacons drops below the cell search threshold (10< CSTh CSTh. But, as in [16], the power used to transmit data frames can be higher so that the user’s experience is not degraded. Hence, an optimum TPC algorithm is assumed (e.g. [18][19]) for the exchange of data frames between an AP and its clients, using the minimum power that does not degrade the performance of the communication. For this reason we distinguish between tx range (determined by the maximum transmission power allowed) and cell size (determined by beacons and Probe Responses). In our approach, APs are responsible for computing their own load and let their neighbors know about it by either periodic or triggered updates. Similar to [7], APs can be in one of the following three states, according to their load, as compared with their neighbors’: § Fair: the AP’s load is similar to the average load in the neighborhood. An AP in this state will not take any action regardless of its neighbor’s behavior. § Gull: the AP’s load is larger than the average load in the neighborhood. An AP in this state is willing to
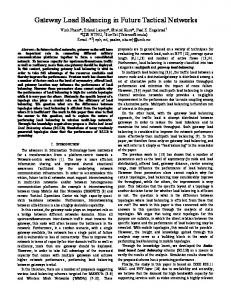
reduce its cell and will try ask its neighbors for help. § Willing: the AP’s load is below the average load in the neighborhood. An AP in this state is willing to increase its cell in response to a neighbor’s appeal. In order to determine the AP’s load we propose the AAC metric, defined as the capacity available for a new station that uses the fastest modulation [12]. Logically, as the congestion increases, the APs’ AAC decreases. Then, we consider that an AP i is Gull if AACi < AAC i - d , where AACi is the capacity available in AP i, AAC i is the average capacity in i’s neighborhood and δ a threshold value used to add hysteresis, thus improving the stability of the system. Analogously, an AP i is Willing if AACi > AAC i + d . If none of the previous conditions is met, the AP is in state Fair. The value of δ is set dynamically according to AAC i / 3 . The optimum value was chosen after a previous simulationbased study that is not detailed here for the sake of brevity. Two APs are neighbors if there is at least one client within transmission range of both APs. The behavior of Gull and Willing APs is detailed in figure 1. Note that initial and final states are connected
a)
b)
and that the process can be interrupted if the state of the AP changes. The first action taken by an AP is to arrange its cell size according to its state. Fair and Gull APs will run txPowerGull() to reduce the size of their cells so that the client receiving the poorest signal detects beacons with SNR > CSTh, or the minimum transmission power is reached; Fair APs will not take any further action. A Willing AP will run txPowerWill() increasing its cell size so that no STA associated to a neighboring AP roams to it, or the maximum transmission power is reached. We define S as the set of STAs (si) and A the set of APs (aj); Sas is the subset of the elements of S that contains the STAs associated to a given AP aj, and Srg is the list of STAs within aj’s range. Both lists are arranged in decreasing order according to the SNR computed from aj’s beacons. SNRj,i is the SNR of aj’s beacons as seen from si, while SNRi is the SNR of the beacons that si receives from its current AP. Then, for any aj:
S rgj = {s i "i Î S | SNR j ,i > SNRmin } S asj = {si "i Î S | SNR j ,i > SNRk ,i "k Î A}
We assume that Sas and Srg are always updated thanks to the complete collection of statistics provided by an independent process (see next section). A Gull AP will then select the first si from its Sas that is able to roam to a Willing AP. The Gull AP will send an SOS message to all APs within range of si . A Willing AP receiving a SOS message will compute the AAC value for that particular STA and will forward this value to the requesting Gull AP. This AAC is computed taking into account the fact that an optimal TPC is used for data exchange. The Gull AP then sends an acknowledgement only to the best AP candidate and adjusts its cell size expelling the selected STA (si ). In turn, the adoptive AP adjusts its cell size to accommodate si . In order to avoid undesired handovers, all APs receiving a SOS message will ban the announced si (e.g. via ACL) until the process is complete.
5. Implementation Issues
Fig. 1: Behavior of a) a Gull AP, and b) a Willing AP
Although the algorithm presented in this paper has not been fully implemented, some of the functionalities required have been previously tested in real testbeds. For example, the signaling required to communicate neighboring APs could be easily carried out by means of a common wired backbone. If there is no such common backbone, APs could still participate in the distributed algorithm using a wireless distribution system based on mesh concepts as proposed in [20]. As in [16] and [18], one of the requirements for the APs is the possibility to set the transmission power in a per-packet manner. In this way, APs can arrange their
Function txPowerWill:
Function txPowerGull:
end = false
end = false MaxSNRi = Max(SNRk,i " k Î A)
while !end do if Ptx + step > PtxMax then end = true for all Si Î Srg do if SNRi < CSth AND if SNRj,i > SNRi + DSNR + step then end = true done if !end then Ptx = Ptx + step done
cell size adjusting the transmitted power for Beacons and Probe Responses and at the same time running an effective TPC for data. The AAC computation adds another requirement for the APs: an updated collection of statistics is required at application level in order to allow the AAC estimation in real time. It is worth to mention that the extra processing load introduced by the AAC computation is affordable despite the AP’s limited resources, as stated in [12]. Nevertheless, the information needed by the APs to run the algorithm described in the previous section represents the main implementation issue. Any AP should know the complete list of STAs within transmission range and the list of APs that any of these STAs can reach, including SNR of beacons and potential SNR for data. The new standard [11], which includes the 802.11h amendments, along with the upcoming 802.11k standard [10] will ease the acquisition of this information, as detailed next. The potential SNR for data exchange between an AP and all the client STAs in range can be obtained by means of an 11h’s TPC Request/Report or an 11k’s Link Measurement Request/Report. These two mechanisms are similar and allow the estimation of the link margins between two stations. The requesting AP announces the transmitted power used to send the request (maximum allowed transmitted power) and the requested STA responds with the link margin according to the SNR of the received request. The response also includes the transmitted power used to send the frame. APs are also able to retrieve information about the SNR of received beacons using the Beacon Request/Report defined in 802.11k. A STA receiving a Beacon Request will respond with a Report containing statistics, including SNR, power, channel and BSSID, of received Beacons and Probe Responses. The AP still has to know the potential SNR for data between its in-range STAs and the neighboring APs. This could be solved either adding an extra signaling among APs or independently, using the 802.11k frames: Measurement Pilot. Similarly to Beacons, these frames are transmitted pseudo-
while !end do if Ptx - step < PtxMin then end = true for all Si Î Sgs do if SNRi < CSth AND if SNRi –step < MaxSNRi + DSNR then end = true done if !end then Ptx = Ptx - step done
periodically by APs at a small interval, but a Measurement Pilot is smaller than a Beacon and is transmitted more often than a Beacon. STAs also include statistics of received Measurement Pilots in Beacon Reports, so, if APs send these frames at the maximum allowed transmission power, APs could finally gather all required information. However, our approach is also feasible with no 802.11k enabled devices. We have to note that in this case, many of the parameters can only be approximated and that it is required that STAs perform active scans. In this way, all APs within the STA’s range are able to obtain the uplink margin from Probe Request messages, and thus estimate the downlink margin assuming that the path is symmetric and that the power used to send the Probe message is known (max. allowed power). These assumptions also allow APs to estimate the power of received Beacons (knowing the power of transmitted Beacons and the estimated path loss). Furthermore, more signaling is required to exchange this information among APs.
6. Performance Evaluation 6.1 Scenario The evaluation process we designed is based on extensive simulations in a 380x380 m square indoor scenario with 16 IEEE 802.11b APs evenly distributed. The simulator was developed in C and implements all the details of the algorithms described in 4. We ran a large number of independent simulations and obtained small confidence intervals, which are therefore not shown in the figures. The throughput carried by an AP and the throughput available to the STAs is computed according to the model presented in [12]. Using a path loss PL(d) = 40-33·log(d), where d is de distance between a transmitter and a receiver, ptxMax=15dBm and a ptxMin=10dBm (highest and lowest allowed transmission power), we assume that with all APs transmitting at ptxMin, there is no coverage gap in the scenario, and that transmitting at ptxMax no
50 40 30
def ault TPC CCB DCB
20 10 0 0
20
40
60
c (%)
80
100
70
b)
60 50 40 30 default TPC CCB DCB
20 10 0 0
20
40
60
80
Aggregate throughput (Mbps)
a)
60
Aggregate throughput (Mbps)
Aggregate throughput (Mbps)
70
100
70
c)
60 50 40 30 def ault TPC CCB DCB
20 10 0 0
20
40
60
80
Saturated users (%)
Number of Users
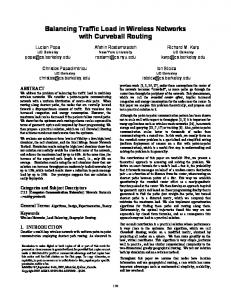
Figure 2: Aggregate throughput: a) 65 saturated STAs. b) Saturated STAs and c = 55%. c) 65 STAs and c = 55%
co-channel interference is produced (using a 4-coloring scheme). As stated in [1], users are static and tend to be spatially concentrated. We simulate these characteristics by placing users at random, but forcing that a given percentage of users, c %, are concentrated in a randomly selected area of 100x100 m. This ensures that a realistic scenario is met. The physical rate used for data transmissions depends on the distance between an STA and its selected AP: if d < 46m, rate = 11Mbps; if d < 61m, rate = 5.5Mbps; if d < 75m, rate= 2Mbps; and if d < 92m, rate = 1Mbps. For d ≥ 92m SNRmin = 1dB is not met. Finally CSTh = 20 dB and DSNR = 7 dB. The PER of each STA depends on the SNR and modulation used for data transmissions, according to the performance of an Intersil Prism HFA3863 [21]. A collision probability is also provided for each cell, depending on the number of active users (see [3]). Our approach (Distributed Cell Breathing – DCB) is compared against different mechanisms. The centralized approach (CCB) of [16] is used as a reference since, as we understand, a complete knowledge of the scenario will allow better assignments. Both DCB and CCB use AAC as the load metric. We call TPC the solution that implements solely an optimal TPC for data exchange, but that keeps the size of the cells fixed. Finally, the default behaviour of current IEEE WLANs is also represented in the simulations.
6.2 Simulation results The first conclusion derived from the simulations was that the proposed algorithm runs without loops, and converges rapidly in the scenario depicted in the previous subsection. Then we measured the aggregate throughput in different situations. Figure 2 a) and b) are obtained in saturation conditions, that is, all STAs have always buffered frames (1500 Bytes) ready for transmission. Figure 2 a) shows the effects of increasing the concentration (c %) with a fixed number of users (65), while b) has a fixed c (55%) and a varying number of users. It is not a surprise that the TPC solution presents the best results, since it always guarantees that all STAs use the best possible rate. In the case where STAs have different traffic profiles (packet size from
500 to 1000 Bytes and offered load ranging from 0.2 to 2Mbps), DCB outperforms the other approaches (see Figure 2 c), but as the number of saturated users increase, it becomes slightly worse. The aggregate throughput has a maximum with 3 or 4 STAs per AP and decreases with more users due to the increasing collision probability. Logically, as c increases (more users use less APs), the aggregate throughput decreases. However, a maximized aggregate throughput does not involve that the throughput of all STAs is maximized. For this reason we also measured the fairness degree among STAs and among APs. Fairness is measured using the known Jain’s Index: β is a value between 0 (unfair) and 1 (fair): 2
æ n ö ç å ri ÷ b = è i n ø ;0 £ b £ 1 nå ri 2 i
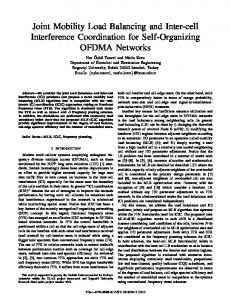
When we measure fairness among STAs, ri is the traffic carried by STA i and n is the number of STAs. When we measure fairness among APs, ri is the AAC of AP i and n is the number of APs. We observed that DCB presents the best fairness values in all the cases, regardless of the number of users, c or number of STAs in saturation (e.g. see figure 3). Another measure of fairness can be provided by measuring ri_min. In this case, since CCB is designed to maximize AACmin, its results are logically the best (see Figure 4a). But although CCB also provides the highest minimum carried throughput on average, (as shown in figure 4b), we have to note that DCB provided the best results in most of the simulations.
7. Conclusions In this paper we have presented a new distributed load balancing algorithm for IEEE 802.11 WLANs, based on the idea of cell breathing. In our approach, the APs have the ability to cooperate in order to redistribute the load among neighboring cells, in a way that is transparent to the end user, who can be equipped with standard devices. The most obvious conclusion that can
100
a) Fairness (STAs)
Fairness (APs)
1 0.9 0.8 0.7 0.6 0.5 0.4 0.3 0.2 0.1 0
default TPC CCB DCB 0
20
40
60
80
100
1 0.9 0.8 0.7 0.6 0.5 0.4 0.3 0.2 0.1 0
b)
default TPC CCB DCB 0
20
Number of Users
40
60
80
100
Number of Users
a)
AAC min (kbps)
1600
min carried throughput (kbps)
Figure 3: Jain’s Fairness index for a) APs and b) STAs. STAs in saturation and c = 55% 1800
default TPC CCB DCB
1400 1200 1000 800 600 400 200 0 0
20
40
60
80
100
1800
b)
1600
default TPC CCB DCB
1400 1200 1000 800 600 400 200 0 0
Number of Users
20
40
60
80
100
Number of Users
Figure 4: a) min AAC for an AP. b) min carried throughput for a STA
be derived from the evaluation is that the absence of any kind of power control reduces the potential capacity of the network drastically. Applying an optimal TPC for data exchange ensures a better utilization of the resources and therefore, the performance of the network is improved. However, in scenarios with a high density of nodes, the average user experience can be further improved, and the congestion level on APs alleviated, if we introduce the ability to dynamically change the cell size according to the environment. Our approach not only provides good network performance but also ensures an even share of bandwidth among clients and a balanced load among APs. Although it is not a strong requirement, the main implementation issue arises with the need to exchange information between client stations and APs. Since the needed information exchange is related to radio measurements, this requirement will be satisfied with the advent of new IEEE standards: IEEE 802.11h and 802.11k.
Acknowledgment This research work was funded by the ERDF, the Spanish Government through TEC2006-04504, and the i2CAT foundation.
References [1] T. Henderson, D. Kotz, and I. Abyzov, “The changing usage of a mature campus-wide wireless network,” in 10th Mobicom, pp. 187-201, September 2004. [2] N. Prasad, A. Prasad, “WLAN Systems and wireless IP for next generation communications”, Artech House, 2001. [3] G. Bianchi and I. Tinnirello, “Kalman Filter estimation of the number of competing terminals in an IEEE 802.11 network,” in 22nd Annual Joint Conference of the IEEE Computer and Communications Societies, INFOCOM'03,vol. 2, pp. 844-852, April 2003. [4] I. B. Dhou, “A Novel Load-Sharing Algorithm for Energy Eficient MAC Protocol Compliant with 802.11 WLAN," in IEEE 50th Vehicular Technology Conference, VTC 1999-Fall, vol. 2, pp. 1238{1242, September 1999. [5] G. Bianchi and I. Tinnirello, “Improving Load Balancing Mechanisms in Wireless Packet Networks," in IEEE International Conference on Communications 2002, ICC 2002, vol. 2, pp. 891-895, April 2002. [6] A. Balachandran, P. Bahl, and G. M. Voelker, “Hot-Spot Congestion Relief in Public-area Wireless Networks," in Proc. of 4th IEEE Workshop on Mobile Computing Systems and Applications, pp. 70-80, June 2002.
[7] H. Velayos, V. Aleo, and G. Karlsson, “Load balancing in overlapping wireless LAN cells," in IEEE International Conference on Communications, 2004. ICC'04, vol. 7, pp. 3833-3836, June 2004. [8] Y. Bejerano, S.-J. Han, and L. E. Li, “Fairness and load balancing in wireless LANs using association control," in Proc. of the 10th international conference on Mobile computing and networking, MobiCom'04, pp. 315-329, 2004. [9] A. Bazzi, M. Diolaiti, and G. Pasolini, “Measurement based Call Admission Control Strategies in Infrastructured IEEE 802.11," in The 16th IEEE International Symposium on Personal, Indoor and Mobile Radio Communications, PIMRC 2005., September 2005. [10] IEEE 802.11 WG. Draft Supplement to Standard for Telecommunications and Information Exchange Between Systems—LAN/MAN Specific Requirements—Part 11: Wireless Medium Access Control (MAC) and Physical Layer (PHY) Specifications: Specification for Radio Resource Measurement, IEEE 802.11k/D9.0. New York, USA: The Institute of Electrical and Electronics Engineers, Inc., September 2007. [11] IEEE 802.11 WG. IEEE Standard for Telecommunications and Information Exchange Between Systems—LAN/MAN Specific Requirements—Part 11: Wireless Medium Access Control (MAC) and Physical Layer (PHY) Specifications. New York, USA: The Institute of Electrical and Electronics Engineers, Inc., June 2007. [12] E. Garcia, D. Viamonte, R. Vidal and J. Paradells, “Achievable bandwidth estimation for stations in multirate IEEE 802.11 WLAN cells”, in proceedings of IEEE International Symposium on a World of Wireless, Mobile and Multimedia Networks, WoWMoM07, June 2007. [13] E. Garcia, R. Vidal and J. Paradells, “Load Balancing in WLANs through IEEE 802.11k Mechanisms,” in Proceedings of the IEEE Symposium on Computers and Communications (ISCC'06), pp. 844-850, June 2006.
[14] O. Brickley, S. Rea, and D. Pesch, “Load Balancing for QoS Optimisation in Wireless LANs Utilising Advanced Cell Breathing Techniques," in IEEE 61st Vehicular Technology Conference, 2005. VTC 2005-Spring, May 2005. [15] Y. Wang, LG. Cuthbert and J. Bigham, “Intelligent Radio Resource Management for IEEE 802.11 WLAN”, in IEEE Wireless Communications and Networking Conference, WCNC04, vol. 3, pp. 1365-1370, March 2004. [16] Y. Bejerano and S-J. Han, “Cell Breathing Techniques for Load Balancing in Wireless LANs,” in Proceedings of the 25th IEEE Annual Conference INFOCOM'06, April 2006. [17] D. Qiao, and S. Choi, “New 802.11h Mechanisms Can Reduce Power Consumption,” in IT Professional, vol. 8, 2, pp. 43-48, March 2006. [18] D. Qiao, S. Choi, A. Jain and KG. Shin, “MiSer: an optimal low-energy transmission strategy for IEEE 802.11a/h,” Proceedings of the 9th annual international conference on Mobile computing and networking, MobiCom03, pp. 161-175, 2003. [19] J. Rao, S. Biswas, “Transmission power control for 802.11: a carrier-sense based NAV extension approach,” IEEE Global Telecommunications Conference, GLOBECOM 05, vol. 6, pp. 3439-3444, November 2005. [20] E. Garcia, L. Faixó, R. Vidal, J. Paradells, “Inter-Access point communications for distributed resource management in 802.11 networks,” 4th ACM Workshop on Wireless Mobile Applications and Services on WLAN Hotspots, WMASH06, p. 11-19, 2006. [21] HFA3863: Direct Sequence Spread Spectrum Base-band Processor with Rake Receiver and Equalizer. Data Sheet. Intersil Inc., December 2001.