rectangular track is placed 9 cm (3 Rx positions) away from the edge of the positioning ... The âarray Xâ configuration is used for positions along the shorter edge, ...
Chapter Chapter 9
Cooperative Localization and Object Recognition in Autonomous UWB Sensor Networks Rudolf Zetik, Honghui Yan, Elke Malz, Snezhana Jovanoska, Guowei Shen, Reiner S. Thomä, Rahmi Salman, Thorsten Schultze, Robert Tobera, Hans-Ingolf Willms, Lars Reichardt, Malgorzata Janson, Thomas Zwick, Werner Wiesbeck, Tobias Deißler and Jörn Thielecke Additional information is available at the end of the chapter http://dx.doi.org/10.5772/55077
1. Introduction Ultra-wideband (UWB) radio sensor networks promise interesting perspectives for emitter and object position localization, object identification and imaging of environments in short range scenarios. Their fundamental advantage comes from the huge bandwidth which could be up to several GHz depending on the national regulation rules. Consequently, UWB technology allows unprecedented spatial resolution in the geo-localization of active UWB radio devices and high resolution in the detection, localization and tracking of passive objects. With the lower frequencies (< 100 Hz) involved in the UWB spectrum, looking into or through non-metallic materials and objects becomes feasible. This is of major importance for applications like indoor navigation and surveillance, object recognition and imaging, through wall detection and tracking of persons, ground penetrating reconnaissance, wall structure analysis, etc. UWB sensors preserve their advantages -high accuracy and robust operation- even in complicated, multipath rich propagation environments. Compared to optical sensors, UWB radar sensors maintain their capability and performance in situation where optical sensors collapse. They can even produce useful results in non-LOS (non-Line of Sight) situations by taking advantage of multipath. Despite the excellent range resolution capabilities of UWB radar sensors, detection and localization performance can be significantly improved by the cooperation between spatially distributed nodes of a sensor network. This allows robust localization even in the case of partly obscured links. Moreover, distributed sensor nodes can acquire comprehensive knowledge of the structure of an unknown environment and construct an electromagnetic image which is related to the relative sensor-to-sensor node coordinate system. Distributed observation allows the robust detection and localization of passive objects and the identification of certain features of objects such as shape, material composition, dynamic parameters, and time-variant behavior. This all makes UWB a promising basis for the ©2013 Malz et al., licensee InTech. This is an open access chapter distributed under the terms of the Creative Commons Attribution License (http://creativecommons.org/licenses/by/3.0), which permits unrestricted use, distribution, and reproduction in any medium, provided the original work is properly cited.
180 Ultra-Wideband Radio Technologies for Communications, Localization and Sensor Applications 2
Will-be-set-by-IN-TECH
autonomous navigation of mobile sensor nodes, such as maneuverable robots- in an unknown environment that may arise as a result of an emergency situation. The objective of the CoLOR project (Cooperative Localization and Object Recognition in Autonomous UWB Sensor Networks) was to develop and demonstrate new principles for localization, navigation and object recognition in distributed sensor networks based on UWB radio technology. The application scenario of the CoLOR project is described by mobile and deployable sensor nodes cooperating in an unknown or even hostile indoor environment without any supporting infrastructure as it may occur in emergency situations such as fire disasters, earthquakes or terror attacks. In this case, UWB can be used to identify hazardous situations such as broken walls, locate buried-alive persons, roughly check the integrity of building constructions, detect and track victims, etc. In this scenario, it is assumed that optical cameras and other sensors cannot be used. Data fusion of optical image information and UWB radar was not in the scope of this project.
y
x
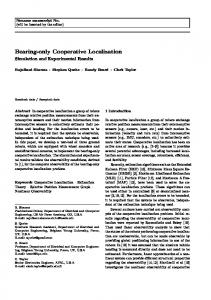
Figure 1. CoLOR scenario.
A possible scenario is shown in Fig. 1. The unknown environment is first explored by autonomous robots that deploy fixed nodes at certain positions. Those nodes being able of transmitting and receiving shall play the role as anchor nodes. They span a local coordinate system and should be placed at "strategic" positions, i.e. they span a large volume and ensure a complete illumination of the environment. Moving nodes will localize themselves relative to this anchor node reference. Moreover, when moving they collect information about the structure of the environment by receiving reflected waves. This way, they build an "electromagnetic image" of the environment and recognize basic building structures ("landmarks"). Step by step a map of the environment is built which can be used as another reference for navigation. This procedure is already well known from autonomous robot navigation as SLAM (Simultaneous Localization and Mapping). However, here we do not consider optical methods but UWB to recognize the feature vector. If there are solitary objects, the moving sensor may scrutinize shape and material composition by circling around. Other objects like humans may walk around and create time-variant reflections that identify their
Localization and Object Cooperative Localization and ObjectCooperative Recognition in Autonomous UWB Sensor Networks
Recognition in Autonomous UWB Sensor Networks3 181
moving trajectory. Humans and animals may also reveal themselves by time variant features resulting from vital functions such as breathing. The organization of this chapter is as follows. Section 2.1 describes the architecture of the sensor network and basic parameters of UWB sensor nodes that we used to achieve our objectives. Section 2.2 specifies the simulated test scenario that was applied for the development of the localization and imaging algorithms. Simulated data allowed us to develop algorithms in parallel to the demonstrator, which is presented in Section 2.3. The demonstrator was used to assess performance and to evaluate the developed data extraction algorithms in realistic scenarios. The algorithms were developed and evaluated using data obtained from the UWB wave propagation simulator described in Section 3. Within the CoLOR project algorithms were developed for: the cooperative localization of sensor nodes, see Section 4, the evaluation of sensor network topology, see Section 5, simultaneous localization and map building, see Section 6, object parameter estimation, see Section 7, imaging of environment, see Section 8 and the detection and localization of moving objects, see Section 9. Special attention was given to algorithms that promise real-time capability.
2. System architecture 2.1. Sensor network architecture To accomplish the tasks described above, the UWB sensor nodes used can be heterogeneous in terms of their sensing capabilities and mobility. Most simple nodes may act just as illuminators of the environment. This requires only transmitting operation, but no sensing and processing capability. However, multiple transmit signal access has to be organized. This could be CDMA (Code Division Multiple Access) or TDMA (Time Division Multiple Access). TDMA requires some time frame synchronization. CDMA, on the other hand, would need multiple orthogonal codes which would complicate transmitter circuit design and increase self-interference because of non-perfect orthogonality. We preferred TDMA switching. With its unprecedented temporal resolution, ToA (Time of Arrival) based localization methods are the natural choice for localization in the case of UWB. ToA, however, requires temporal synchronization between the nodes. This can be achieved by the RTToA (Round Trip Time of Arrival) approach which means that sensors involved must be able to retransmit received signals. Deployable nodes, placed at verified positions may act as location reference or anchor nodes for the localization of roaming nodes. Other nodes are spread around as static or moving observers. Static observers are well suited to observe moving objects since they can most easily distinguish between desired information and reflections from the static environment (clutter) by exploiting time variance. On the other hand, moving observers (or illuminators, since propagation phenomena are reciprocal) can collect information about static objects and environments (e.g. structure of walls). By applying coherent data fusion methods, moving nodes will create an image of the static propagation environment. This is a full multi-static approach which requires a number of widely distributed cooperating sensor nodes having precise (relative) location information and synchronization at least between subsets of sensors (e.g. between receivers or transmitters or both). Synchronization issues can be relaxed if we construct a more complex node containing, e.g. one transmitting antenna (Tx) and two receiving (Rx) antennas. Such a sensor already
182 Ultra-Wideband Radio Technologies for Communications, Localization and Sensor Applications 4
Will-be-set-by-IN-TECH
constitutes a small-baseline bi-static radar, which somehow resembles the sensing capability of a bat and allows the estimation of both object range and direction (by using time difference of arrival, TDoA). We will also refer to these nodes as "bat-type sensors". Their advantage is that mutual coherent processing is restricted to one platform. So, if several of those nodes are cooperating, they can directly exchange range and DoA (direction of arrival) information, which we call "non-coherent cooperation" since no exact phase synchronization between nodes is required. There is, of course, also a mixed approach which may consist of non-synchronized illuminators and locally coherent (differential) observers. So, with regard to the capabilities of sensor nodes involved and to their mutual cooperation, we distinguish between three basic structures of sensor networks: • The multi-static approach, which assumes full coherent cooperation. The position of those nodes is estimated and tracked w.r.t. the anchor nodes. • The "bat-type" approach consisting of self-contained sensor nodes which are able to detect and recognize characteristic features of the propagation environment on their own. This allows the building up of partial maps of the environment, the investigation of unknown objects in more detail, the identification of object features, etc. • The mixed approach is characterized by a cooperation of all types of sensors. For example, the multi-static sensors will support the localization of the scout sensors, and these will deliver additional reference information that relates the local sensor coordinate system to the structural details of the environment.
Figure 2. Basic architecture of UWB sensors node.
The basic architecture of a bat-type sensor is described in Fig. 2, see [47], [29], and see Chapter 14. The transmit signal is a periodic M-sequence spread spectrum signal which is generated by a high speed 12-stage digital shift register. It is clocked by a stable RF-clock generator - a dielectric resonance oscillator operating at 7 GHz which allows a usable frequency band up to 3.5 GHz (baseband). The sequence contains 4095 chips corresponding to 585 ns duration and about 175 m of usable distance. In the passband mode the signal is up-/down-converted by the same frequency which results in usable frequency band from 3.5 GHz to 10.5 GHz, which corresponds to the well-known FCC-specification. The receiver
Localization and Object Cooperative Localization and ObjectCooperative Recognition in Autonomous UWB Sensor Networks
Recognition in Autonomous UWB Sensor Networks5 183
applies 512 time subsampling which relaxes ADC (analog-to-digital converter) bandwidth requirements and still allows real-time data recording with a measurement rate of 50 impulse responses per second. Data measured in real-time by static anchor nodes allow the extraction of information about time-varying objects and people within the inspected scenario. Real-time data measured by moving nodes of the network allow the extraction of information about the geometric structure of the environment. In order to develop data extraction algorithms in parallel with the development of the demonstrator, we simulated a test scenario in terms of electromagnetic waves propagation. The simulated scenario is described in the following Section 2.2.
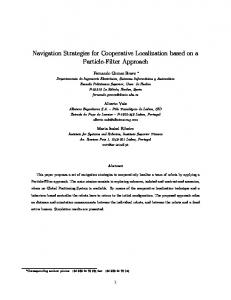
2.2. Simulated scenario As we did not have everything ready for the demonstration scenario, e.g. the robot was not available, a scenario was simulated using the ray tracing tool 3, in order to develop and test the algorithms for map building, localization and imaging independently. For the final demonstration, the scenario described in Section 2.3 was used. The simulated scenario is shown in Fig. 3. It consists of a room of the size 9x8x4 m with a pillar in its center. There are six different objects (shown in Fig 3 on the right side) distributed in the room. Their positions are marked in the figure. Metal is chosen as material for the walls and for the six objects. The bat-type sensor follows the track indicated by the dotted line. The sensor is equipped with one transmit and two receive antennas. The transmit antenna is located at the point (0,0,1) of the local Cartesian coordinate system of the robot (with x being the moving direction, y, and z the height) and the receive antennas at (0,0.5,1) and (0,-0.5,1). At 78 positions, indicated by the red circles on the track, the robot stops and takes measurements (the channel is simulated accordingly). Therefore, the transceiver array rotates in the azimuth plane (x-y-plane) with an angle resolution of 3◦ , so that at each position 120 simulations are performed. A horn antenna with a 3 dB beam-width of around 60◦ at 9 GHz was used as the radiation pattern for the transmit and receive antennas. The channel was simulated from 4.5 to 13.4 GHz in steps of 6.25 MHz in order to describe the frequency selective behavior realistically. The inclusion of high-frequency aspects in terms of the transmission channel is particularly important for the accuracy of the simulation results. Otherwise, unrealistic conclusions will result from the simulation. In order to achieve a realistic evaluation of the efficiency of sensing and imaging systems, the channel model must describe the multi-path propagation realistically. A description of the used channel simulator as well as some verification measurements are given in Section 3.
2.3. Demonstrator To prove robustness and applicability, research results obtained within CoLOR were experimentally validated in an extensive measurement campaign. The main focus was placed on a robust transfer of the algorithms from laboratory conditions to a more realistic indoor propagation scenario. The goals of these extensive multi-disciplinary measurements were • to verify UWB sensing algorithms in real indoor scenarios,
184 Ultra-Wideband Radio Technologies for Communications, Localization and Sensor Applications 6
Will-be-set-by-IN-TECH
Figure 3. Simulated scenario.
• to perform and evaluate the simultaneous working algorithm for the cooperative approach, • to determine to what extent previously achieved research results are applicable under these conditions. With regard to a final experimental validation, the investigations in CoLOR were accompanied by experimental practice throughout the project, i.e. algorithms were always validated with regard to real world conditions. The measurements made so far were simplified to limited sensor and/or object motions, to ideal movements by means of motorized linear arrays or by reducing the number of simultaneously performing cooperative algorithms. Therewith, only hardware complexity and mechanical effort could be reduced and meaningful validations of the investigated algorithms could be obtained. However, measurement scenarios and instrumental investments were extensively expanded within the scope of a demonstrator to fully meet the demands of a realistic indoor propagating scenario. Hence, an autonomous mobile security robot with professional motion units was fully equipped with UWB-devices, RF components, a power supply unit and a laptop for data acquisition and communication with the data fusion computer. This security robot serves as the previously mentioned mobile bat-type sensor.
Localization and Object Cooperative Localization and ObjectCooperative Recognition in Autonomous UWB Sensor Networks
Recognition in Autonomous UWB Sensor Networks7 185
Most algorithms of previous investigations could be adopted with manageable complexity to the mobile bat-type scenario. However, some challenges came up unexpectedly, e.g. erroneous robot motion due to uneven floor and slippage of robot tires, potentially more clutter in a realistic scenario, handling and transformation between a global coordinate system of the static environment and an additional local coordinate system of the dynamic robot. To provide a realistic indoor scenario with corners as well as edges and dimensions like that of a larger office room (56 m2 ), the fire detection laboratory of the University Duisburg-Essen was modified and used as the location for the measurement campaign. The modification consists of partly installed portable metallic walls to give the room a more complicated shape. The ground plane of the designed indoor scenario is depicted in Fig. 4 . 9.24 m 90° o2
o3 180°
7.91 m
possible track
0°
2.59 m 270°
5.6 m
o4
o5
o1 objects (not true to scale)
robot
3.9 m
2.75 m
Figure 4. Ground plane of measurement location and robot with possible track.
As previously mentioned, the bat-type sensor is realized by a mobile security robot which is schematically represented in Fig. 5 As super-resolution techniques in short-range UWB sensing have to be performed, certain demands on the motion accuracy result are necessary. However, localization accuracy is predominantly achieved by advanced algorithms described later in chapter 7. Additionally, some assisting robot specifications have also been taken into account to improve accuracy. There are three actuators in the robot, two in the motion unit at the bottom, and one at the top which rotates the antenna array. The actuators are all hollow-shaft servo motors, which offer unique features unsurpassed by conventionally geared drives. Used in highly demanding industrial and medical servo systems, they provide outstanding precision motion
186 Ultra-Wideband Radio Technologies for Communications, Localization and Sensor Applications 8
Will-be-set-by-IN-TECH
Figure 5. Schematic drawing of the motion unit (left) and of the robot (right).
control in sub-mm range and high torque capacity in a very compact package. The robot has 3 solid rubber tires on both sides which are connected by a chain-drive. Actually, both sides could be used autonomously with different acceleration, deceleration and speed, which results in curved tracks. However, for further accuracy different triggering is avoided so that the servo motors are driven synchronously. Evidently, the robot moves straight forward when the motors drive into the same direction and rotation is performed when the motors drive in the opposite direction. To maintain a more gliding rotation of the robot with reduced positioning errors, the circumference of the middle tire is minimally higher than those of the other ones. The dimensions of the robot as well as the tire position maintain a rotation center in the middle of the robot which also equals the middle of the bat antenna platform at the top. Hence, the movement of the robot was entirely restricted to translations and rotations, strictly avoiding curvature paths. Because of that, a track is split into several straight segments which are separated by a change of orientation. A resulting possible track is shown in Fig. 4. As mentioned previously, to further minimize erroneous robot motions, the bat is equipped with its own rotational unit. The orientation change can be performed by just rotating the bat, which is preferred compared to rotating the whole robot. This is more sensitive to errors due to an uneven or slippery floor. The robot is also equipped with a laser-based indoor navigation system. This highly accurate and well-proven localization system shall provide reference data for subsequent performance analysis. It has neither assisting nor guiding functionality in the localization process of CoLOR. The localization process is first and foremost handled by UWB-Radar technology. Due to the different localization and imaging applications in this project, the requirements placed on the antenna characteristics differ. Fig. 6 gives an image and a photograph of the antenna array used. It consists of three different antenna types. A broadband monopole antenna (Tx2_1 ), a dual-polarized broadside radiating antenna (Tx2_2 , Rx2_1 , Rx2_2 ) and an
Localization and Object Cooperative Localization and ObjectCooperative Recognition in Autonomous UWB Sensor Networks
Recognition in Autonomous UWB Sensor Networks9 187
end-fire radiating antenna (Tx1_1/1_2 Rx1_1/1_2 ). The requirements as well as the design of the antennas itself are described in detail in subsections 7 and 6 .
Figure 6. Schematic diagram (left) and picture (right) of the antenna array used
An array of switches, as shown in Fig. 6, allows the change between the different receiver and transmitter configurations.
3. Hybrid deterministic-stochastic channel simulation In the framework of this project, a realistic UWB multi-path propagation simulation tool was developed in order to test and compare different algorithms and antenna arrangements for indoor UWB sensing and imaging. Multi-path propagation implies that the transmitted signal does not only arrive over the direct propagation path at the receiver, but also over paths which are dependent on the propagation environment in a complex manner. The received signal is then a combination of a multiplicity of reflected, diffracted and scattered electromagnetic waves. Wave propagation models, in general, can be classified into deterministic and stochastic ones. Deterministic models are based on the physical propagation characteristics of electromagnetic waves in a model of the propagation scenario. In contrast, stochastic models describe the behavior of the channel through stochastic processes. By now, some statistical channel models have been established for the early design phase and for testing the ideas for possible applications. Statistical models randomly generate channel impulse responses of a channel based on the probability functions, which are usually obtained from measurements. However, if a system has to be tested in a specific environment, deterministic channel models are required, which approximate real physical phenomena. One of the most popular deterministic channel modeling approaches is ray tracing (RT), based on geometrical optics and the uniform theory of diffraction. In outdoor areas ray tracing simulations emulate the propagation conditions very well [18]. Furthermore, it has been shown that ray tracing can be also easily extended to simulate ultra-wideband channels. However, comparisons between the measurements and simulations with respect to UWB indoor channels show that the ray tracing results are often underestimated in terms of received power, mean delay and delay spread [26, 34, 42]. This is due to insufficient modeling or the complete neglect of diffuse scattering in the ray tracing model. Diffuse scattering causes contributions to the power delay profile, which are not resolvable (dense multipath components). Through these contributions the power delay profile is smoother than in the scenarios with reflection and diffraction only.
188 Ultra-Wideband Radio Technologies for Communications, Localization and Sensor Applications 10
Will-be-set-by-IN-TECH
In the model described in this section, a simple approach is proposed which combines the ray tracing method with statistically distributed scatterers. The approach is inspired by the diffuse scattering model for UWB channels presented in [33], by the spatiotemporal model for urban scenarios presented in [46] and by the geometrically-based stochastic channel model [40]. The scatterer placement and properties are bound to the geometry of the considered scenario. The parameters for the stochastic part of the model are derived from measurements. As only few additional scattering contributions per surface are added, the increase in computational effort is very little. The placement of scatterers ensures that part of the contributions are resolvable for the UWB system. Some preliminary results of this model were previously presented in [23], [24] and [25]. To get an impression of the sources of dense multipath components, the spatial behavior of the channel a stationary office scenario (scenario A), shown in Fig. 7, is analyzed.
(a) Schematic diagram of the measurement scenario
(b) Simulation environment
Figure 7. Schematic diagram of the measurement (left) and simulation scenario (right, view from outside through the windows) for the DOA analysis of dense multipath components.
The measurement setup used consists of a vector network analyzer, low noise amplifier and of a set of step motor controlled positioners. The frequency range sampled by the analyzer is 2.5 - 12.5 GHz. For the measurements in scenario A, the motor controlled turntable is used to rotate the strongly directive antenna array described in [2] around its z-axis. This antenna is used as a receiver (Rx) and placed approximately in the middle of the room. The transmitter (Tx) is equipped with a UWB omnidirectional monocone antenna and placed at 5 positions marked in Fig. 7 (left). In the same scenario, ray tracing simulations, as shown in Fig. 7 (right), with up to 5 reflections and up to 3 diffractions have been performed. At this point, no scattering is considered in the simulations. The transmission has not been considered here, earlier radar measurements in comparable rooms, [23], showed that no significant paths are to be expected from their side of the walls. On the other hand, objects inside the wooden cabinets may cause significant dense contributions. The patterns of the antennas used in the measurements have been measured in an anechoic chamber for the considered frequency band, and are considered in the simulations. In Fig. 8 the measured and simulated power delay profiles (PDP) are depicted for the transmitter position 1, see Fig. 7 (left). For each rotation angle indicated on the x-axis, the
Localization and Object Cooperative Localization and ObjectCooperative Recognition in Autonomous UWB Sensor Networks
Recognition in Autonomous UWB Sensor Networks 11 189
time dependent PDP is plotted along the y-axis. As the radiation pattern of the antenna array has a narrow main beam the directions of arrival of the propagation path, impinging on the antenna can be directly identified in the picture.
(a) Tx1 – Measurement
(b) Tx1 – Simulation
Figure 8. Measured and simulated angle-dependent power delay profiles for the transmitter position Tx1 .
The comparison shows that most of the strong contributions are present in both measurements and simulations. Moreover, the amplitudes of the measured and simulated reflection contributions have been captured with good accuracy. Nevertheless, a significant amount of power is missing in the simulations. Figure 9 shows the power delay profiles of Fig. 8 averaged over the delay time and over the angle. It can be observed that although some strong contributions such as the direct path and a reflection at τ = 25 ns is at the same level as that from the measurements, for most delay times the simulated power is considerably lower. From the PDP values averaged over the angle we may conclude that this effect is present for all observation angles. The dense components are not distributed evenly over the angle, but create clusters around the strong contributions. The observed dense contributions are not an effect of rough surfaces, as all surfaces in the room can be considered to be smooth within the frequency range used. Some contributions may arise from small objects such as doorknobs present in this scenario. Other contributions are most likely due to the scattering from the inhomogeneities within the walls or cabinets. In [44] it was shown that typical inhomogeneous building materials distort the transmitted signal significantly. Such distortions are expected to be present also in the reflected signal and are likely to cause dense components with delay times slightly larger than the delay time of the reflected signal. The amplitudes of such components are decreasing almost exponentially with the delay time. This means that if the dense contributions are to be modeled, their delay times and angles of arrival should be grouped around the significant contributions.
3.1. Scattering model To achieve the clustering effect, additional contributions are generated by placing point scatterers around the reflection points calculated by the ray tracing model, see Fig. 10. These scatterers represent small structures on the surface, which have not been considered in the
190 Ultra-Wideband Radio Technologies for Communications, Localization and Sensor Applications 12
(a) Tx1 – PDP averaged over the angle
Will-be-set-by-IN-TECH
(b) Tx1 – PDP averaged over the delay time
Figure 9. Averaged angle-dependent power delay profiles for the transmitter position Tx1 .
scenario data so far, as well as interactions with inhomogeneities inside the objects and with objects behind the walls. The delay time of the additional multi-path contributions due to the scattering points is approximately equal to the delay time of the reflected path. Their scattering coefficients are adjusted so that the resulting amplitudes of these multi-path components are slightly below the amplitude of the reflected path.
Figure 10. Modeling approach for single reflections.
The number of scatterers n = 1 . . . N is a model parameter and is assumed to be constant for all clusters. The scatterers are distributed uniformly on the objects’ surface within a radius r around the reflection point. The scatterers whose position is outside the considered area are discarded. In order to keep the model as general as possible, each scatterer is characterized by the complex full polarimetric scattering matrix S. The field scattered from the n-th scatterer Es is described in the frequency domain by: Es =
e− jk0 d · S · Ei d
(1)
where Ei is the incident field, k0 is the wave number, and d is the distance between the scatterer and the observation point. In this subsection, only the vertical co-polarized element Svv is considered. The parameterization of other scattering matrix components can be done in the same way. As the frequency band used is very wide, at least some of the contributions can be resolved by the system. Therefore, the scattering contributions in the model are coherently summed at the receiver. To obtain the amplitudes of scattered contributions in the same order of magnitude as the amplitudes of the reflected path, their scattering factors are related to the reflection coefficient Γ by a proportionality factor a, which is derived from the measurements as well. The reflection
Localization and Object Cooperative Localization and ObjectCooperative Recognition in Autonomous UWB Sensor Networks
Recognition in Autonomous UWB Sensor Networks 13 191
factor Γ is calculated at the position of the scatterer using the material parameters of the corresponding surface. Depending on the polarization of the impinging wave, the reflection coefficient either for parallel or vertical case is used. Thus, in the case of single reflection paths and assuming vertical polarization, the resulting field at the receiver consists of the reflection contribution and of the sum of scattered contributions Esv,tot given by: Esv,tot =
e− jk0 dn · aΓv,n · Eiv,n dn n =1 N
∑
(2)
Due to the single scattering approach, the model covers only the part of the power delay profile with relatively short excess delay times. For the reliable simulation of delay spreads longer multiple reflected propagation paths have to be considered. The intuitive approach would be to place additional scatterers around the higher order reflections points and to use the impinging reflected wave as an excitation, see Fig. 11. This would then have to be incorporated into the reflection path search algorithm of the ray tracing approach, which would require much computational effort. To keep the excess simulation time of the hybrid part of the model as short as possible, the multiple scattering processes are replaced here with ”virtual” single bounce scatterers. These scatterers are placed at the point of the multiple reflections. Their scattering factors contain an additional term e− jk0 δ , where δ corresponds to the path length between the point of the first interaction and the considered higher order interaction. This term adds δ/c0 to the delay corresponding to the distance between the transmitter and the scatterer dgeom .
(a) 1st order reflection
(b) 2nd order reflection - simplified approach
Figure 11. Modeling approach for multiple reflections
Thus, the delay time similar to the delay of a propagation path containing one or more reflections can be realized. However, the amplitude of such a path decreases proportionally to δ · dgeom whereas the amplitude of a path containing the reflection would experience a slower decay. To counterbalance this effect, an additional term p · δ is included in the scattering coefficients of the higher order scatterers resulting in the following expression for all scatterers: S = ( a + p · δ) · Γ · e− jk0 δ
(3)
For the scatterers placed around single reflection, this expression reduces to S = a · Γ since in this case δ = 0. Thus, the resulting model is characterized by 4 parameters: -
N - number of scatterers
-
r - placement radius
192 Ultra-Wideband Radio Technologies for Communications, Localization and Sensor Applications 14
-
Will-be-set-by-IN-TECH
a and p - proportionality factors.
These parameters are estimated from the measurements. The derivation approach is described in the following Sections.
3.2. Derivation of the model parameters For the derivation of the model parameters, a series of measurements with synthetic arrays at both transmitter (Tx) and receiver (Rx) have been conducted in three different office and lab scenarios in the IHE building of the Karlsruhe Institute of Technology. Two are office scenarios (scenario B and D), where the number of details in both rooms is small. The third scenario (scenario C) is a cluttered lab scenario [25]. Here, a large number of small details such as cables, tools, books etc. is distributed over the tables and shelves. These small objects were neglected in the scenario model. The transmitter is placed within a 0.12 m long linear positioner, and the receiver is moved on a 1.2 m by 0.6 m rectangle. Thus, a linear and a rectangular virtual array are obtained. The spacing between two consecutive antenna positions in both Tx and Rx arrays is 3 cm. With the exception of the antennas, the measurement setup used is identical with the setup described before. The simulation settings are also the same. For the derivation of the model parameters, the behavior of the channel characteristics (path loss L and delay spread σD ) in the measurements and the simulations are analyzed and compared [25]. To find adequate model parameters, simulations with different parameter sets are conducted and compared with the measurements. As the test of all possible parameter combinations would be computationally prohibitive, an initial parameter set has been chosen based on previous work findings in [23] and the parameters have been varied one by one. The scatterer generation is done only once in each realization for Tx position in the middle of the Tx array and for Rx position in the middle of the Rx arrays. For each other Tx/Rx configuration the same scatterers are used. Due to the statistical nature of the model, some variation of the simulated channel parameters for consecutive simulations with the same model parameter set is to be expected. Hence, for each parameter set 5 realizations are then simulated and the channel parameters derived from them are averaged. This number is small enough to be simulated quickly, and large enough to give approximate mean values for a given parameter set. To derive the model parameters, their influence on the chosen channel characteristics is analyzed. It can be observed that: -
the mean relative error in path loss has a minimum at a = 0.175, N = 22 and p = 0.075.
-
the mean error in delay spread rises with rising a and N. It changes also very quickly with p. The error minimum is at p = 0.025.
-
for r 0.5 m and r < 1.5 m, the error values are stable.
Considering this observation, first p is set to 0.03 because it has the strongest influence on the error. Thus, values of a = 0.2 and N = 16 are chosen which give a good tradeoff between path loss and delay spread errors. Finally, the scattering radius is set to r = 1 m. Another indirect model parameter is the order of reflection which is considered in the scatterer placement. The influence of the considered reflection order on the delay spread is shown for a
Localization and Object Cooperative Localization and ObjectCooperative Recognition in Autonomous UWB Sensor Networks
Recognition in Autonomous UWB Sensor Networks 15 193
single position in the middle of the Rx and Tx array of an office scenario. The measured delay spread for this point is 3.8 ns.
Figure 12. Influence of the considered reflection order on the delay spread in scenario 2.
The curves show that depending on the chosen model parameter (a and p have the strongest influence here) the inclusion of reflections of up to 3rd order influences the delay spread. The same has been observed in other scenarios and for the path loss. Thus, in the following the scatterers will be placed around the reflection points of up to the 3rd order.
3.3. Model performance To test the parameterized model, it is compared with measurements with respect to path loss, delay spread, azimuth spread, power delay profiles and azimuth spectra at the receiver [25]. For the estimation of the power delay profiles and azimuth spectra, the first Tx position and a rectangular track along the edges of the positioning table at Rx is considered. Each edge of the rectangular track is placed 9 cm (3 Rx positions) away from the edge of the positioning table. The estimation of azimuth angle is done using the sensor-CLEAN algorithm [8] using 4×4 elements with a spacing of 6 cm, with the midpoint at each comparison-track point. In contrast to the measurement the simulations can provide also the angle of arrival of individual paths. However, due to the enormous amount of data obtained if the properties of each individual path are recorded, it is more convenient to apply the estimation also to the simulation data. In this case, only the coherent sum of all paths for a particular Tx/Rx position has to be recorded. The placement of the comparison points and of the arrays used for calculating the angles of arrival (AoA) at the receiver is shown in Fig. 13 .
Figure 13. Placement of the comparison points and of the arrays used for the calculation of AoA at the rectangular positioner.
The ”array X” configuration is used for positions along the shorter edge, whereas the "array Y" configuration is used for positions along the longer edge of the rectangular positioner. The
194 Ultra-Wideband Radio Technologies for Communications, Localization and Sensor Applications 16
Will-be-set-by-IN-TECH
elevation is neglected here as the measurements with a 2-D array do not allow for resolution of paths impinging from below and above the array. The analysis of the corresponding PDPs shows that the impulse responses simulated with the hybrid approach bear much more similarity to the measurements. Although the scatterers are generated in a statistical way, their properties are tightly bound to the properties of underlying reflections so that their contributions do not dominate in the channel impulse response but fill the missing dense components of the impulse responses and angular spectra. In the next step, the mean error μe and the standard deviation of the error between the measurement and the hybrid model σe is calculated for the path loss L, delay spread σD and the angular spread σψR . For this purpose, all possible Tx/Rx positions as described in Subsection 3.2 are used. These values and the corresponding values of the error between the measurement and conventional ray tracing are shown in Table 1 . Scenario B Scenario C Scenario D . RT Hyb. RT Hyb. RT Hyb. μeL in dB σeL in dB μeσD in ns σeσD in ns μeψR in deg σψD in deg
4.34 0.57 1.70 0.78 22.35 9.00
1.64 0.77 0.83 0.59 10.26 9.86
1.98 1.25 1.23 0.60 19.85 7.10
-0.07 1.03 0.04 0.56 7.15 8.01
3.27 1.68 0.73 0.75 1.81 -0.76 0.66 0.67 4.33 -1.19 5.16 6.03
Table 1. Mean values and standard deviations of the error between the measurement and ray tracing simulation (RT) and between the measurement and hybrid simulation (Hyb.) .
Except for azimuth spread, the standard deviation values are very small. In the case of azimuth spread, however, additional errors are imposed due to path estimation. In a few cases, an insignificant rise is observed. The mean values are improved simultaneously for all considered channel characteristics. The spread of the error values of path loss, delay spread and capacity resulting from the statistical nature of the model is analyzed also. For this purpose 40 realizations of the channel with the same parameter set are generated. For each realization, the mean error of each channel parameter is calculated. To describe the spread, the standard deviation over all mean values is adopted. Finally, the derived model is applied to scenario A from Subsection 6.4 to prove the space-time distribution of the additional contributions. The angle dependent PDP simulated with the hybrid method is shown in Fig. 14 . The comparison with Fig. 8 shows that the additional contributions are properly placed in the azimuth-delay space, thus, depicting better the clustering effects in the scenario. With this, a simple and effective modeling approach for directional UWB channels is proposed. The ray tracing method is combined with a simple geometric-stochastic model which represents the dense part of the channel. The parameters of the stochastic model are connected to the properties of reflected paths so that they form a cluster with a certain delay and angle range around the reflected contribution. The stochastic clusters are also implemented around the points of multiple reflections. The
Localization and Object Cooperative Localization and ObjectCooperative Recognition in Autonomous UWB Sensor Networks
Recognition in Autonomous UWB Sensor Networks 17 195
Figure 14. Angle-dependent power delay profile for the transmitter position Tx1 in Scenario A simulated with the hybrid method.
model delivers very realistic channel impulse responses, azimuth spectra, and resulting channel parameters. The mean error between measurement and simulation is considerably improved in comparison to conventional ray tracing. This includes also the geometrical structure of the channel. Moreover, the deviation of the values of the simulated channel parameters due to the random placement of the scatterers is very small. Thus, a good reproducibility of the results is given.
4. Cooperative localization of mobile sensor nodes In the application scenario envisaged in the introduction, an unknown environment is inspected by a UWB sensor network. Static anchor nodes of the network are placed at strategic positions. They span a local coordinate system and passively localize people or other moving objects just by electromagnetic waves scattered from them. "Electromagnetic images" of the environment are provided by moving nodes of the network. All data extraction algorithms that evaluate data measured by the sensor network require a priori information about the position of corresponding sensor nodes. In this section, basic principles of the cooperative localization of sensor nodes are described. UWB localization is usually achieved in two steps, parameter extraction and data fusion, [20, 57]. The parameter extraction estimates parameters of signals received by sensor nodes that are required in the data fusion step. Typical parameters that are used in radio based localization systems are time of arrival (ToA), time difference of arrival (TDoA), angle of arrival (AoA) and/or received signal strength (RSS). The range-based schemes, ToA and TDoA, are shown to yield the best localization accuracy due to the excellent time resolution of UWB signals [19]. The range based ToA approach appears to be the most suitable approach for localization in UWB sensor networks. However, there are still many challenges in developing a real-time ToA based indoor UWB localization system. Due to the number of error sources, such as thermal noise, multipath propagation, direct path (DP) blockage and DP excess delay, the accuracy of the range estimation may get worse. In indoor environments, it is proven that the major sources of errors are multipath components (MPCs) and the NLOS situation [54, 56] that strongly influence the parameter estimation step - the range estimation. The quality of the range estimation is related to the SNR (or distance between Tx and Rx) and the LOS/NLOS
196 Ultra-Wideband Radio Technologies for Communications, Localization and Sensor Applications 18
Will-be-set-by-IN-TECH
situation. It could be improved if suitable a priori information is available. This information is usually obtained from subsequent location estimations. In what follows, we propose a novel UWB localization approach which does not require such a priori information and, instead, is based on the NLOS identification and mitigation.
4.1. UWB localization in realistic environments The first step in our approach is high precision ToA estimation. Conventionally, ToA estimation for UWB localization is performed via a correlator or equivalently, via a matched filter (MF) receiver, [19]. However, it is difficult and not practical to implement this estimator since the received waveform with many unknown parameters must be estimated. This is almost impossible especially in realistic indoor scenarios. Another approach is the maximum likelihood (ML) based method for joint estimation of path amplitudes and ToAs described e.g. in [31, 67, 76]. This is, however, a computationally extensive method that is not suitable for real-time operations. Although various low-complexity ranging algorithms exist, their performance is not sufficient for high precision ToA estimation. Examples of low-complexity threshold-based methods such as the peak detection method, the fixed threshold method, or the adaptive threshold approach are given e.g. in [11], [17] and [22]. In these approaches, the received signal is compared to an appropriate threshold δ, and the first threshold-exceeding sample index corresponds to the ToA estimate, i.e., tˆToA = tn , n = min {i |z[i ] ≥ δ} .
(4)
For the high precision ToA estimation we proposed an adaptive threshold-based ToA estimation algorithm, the maximum probability of detection (MPD) method, in [56]. It aims at improving the robustness in multipath and NLOS situations. The main idea is to compare the probabilities for a number of possible peaks in the obtained CIR of being the ToA estimates. The probability that a certain sample, e.g. the ith sample, is determined as the ToA estimate when its amplitude, z [i ], is equal to or greater than the threshold and the samples before are smaller than it, i.e., � Pd (i ) = P(nˆ ToA = i ) =
i −1
∏ P (z [n] < δ)
n =1
�
· P ( z [i ] ≥ δ ) ,
(5)
where, nˆ ToA denotes the estimated index, and i = 1, 2, . . . , N are the sample indices. The one which has the highest probability leads to the final ToA estimate. The next step in our localization approach is the NLOS identification and mitigation. The advantage of this approach is that, if the identification is correct, the accuracy of the localization can be considerably improved. Several attempts to cope with the NLOS identification problem have been proposed, such as, methods based on the sudden decrease of the SNR or on the multipath channel statistics, or method by comparing statistics of the estimated distances with a threshold in [7, 68]. However, these methods usually need to record a history of channel statistics. The advantage of our approach based on a hypothesis test proposed in [54] is that it could also be applied in cases, when the target node is static or within the halting period of a moving node. The algorithm compares the mean squared error (MSE) of the estimated range estimates with known variance of the LOS range estimates. The two hypotheses are:
Localization and Object Cooperative Localization and ObjectCooperative Recognition in Autonomous UWB Sensor Networks
Recognition in Autonomous UWB Sensor Networks 19 197
700
350
600
Estimated Distance [cm]
300 250
500
R2 R1
200 400
150
R4
100
300
50 200
0 ranging from AML Direct range tracking range modification by NLOS ident. Tracking of modif. ranges
100
0
20
40
60
80 100 Sample Time [s]
120
140
í50 í100
use original range estimates use direct range tracking results use NLOS identification use modified ranges
R3
í150
160
í100
0
100
200
(a)
300
400
500
600
(b)
Figure 15. Data processing results of scenario with 2 LOS nodes and 2 NLOS nodes. (a) Ranging results by using different approaches for one NLOS channel; (b) the localization results by using different approaches before. location tracking.
�
2 , H0 : M � σLOS 2 , H1 : M > σLOS
no NLOS node exists, NLOS nodes exist.
(6)
where M is the MSE of the estimated range estimates. After the NLOS identification, the location estimation is performed by using the identified LOS nodes only. For the implementation of the location estimation, trilateration systems are widely used. Many range-based location estimation methods with different complexity and restrictions have been proposed in the literature. All of them try to acquire a high precision of the location estimate from the range estimates. Different location estimation algorithms, which aim to find the closest position to the current coordinate of the target node, offer different accuracies and complexities. In [55], performances of a number of location estimation algorithms are compared, such as the least squares method, the Taylor series method and the approximate Maximum likelihood method.
4.2. Measurement-based verification In order to verify our localization approach described above, a measurement was performed in a radar laboratory environment. Two Rx antennas were situated in one room, another two antennas were situated in the neighboring room and in the corridor. The Tx antenna was mounted on a positioning unit and moved along a predefined rectangular track. The MPD-based algorithm was used for range estimation. The hypothesis test-based NLOS identification and mitigation algorithm, which compares the MSEs of range estimates with the variance of the LOS range estimates, was used for location estimation. For comparison, the approximately Maximum likelihood method was applied for the location estimation, too. For both, range tracking and location tracking, the Kalman filter was applied. The ranging results obtained for a sensor network containing one NLOS node is shown in Fig. 15(a). The result of the localization is displayed in Fig. 15(b). Both figures illustrate the feasibility of the proposed localization approach and its better performance in most cases compared with a number of other approaches.
MIMO Ambiguity Function Factorization
198 Ultra-Wideband Radio Technologies for Communications, Localization and Sensor Applications 20
Signal factor Factors
Topology factor
Relative position between transmitter array
Transmitter placement within the transmitter array
&
Receiver placement within the receiver array
receiver array
Motion factor Applicati ons
Will-be-set-by-IN-TECH
Evaluation
To evaluate the contribution of each individual factor
Optimization
To optimize a certain group of parameters via the corresponding factor
Figure 16. Factorization of MIMO ambiguity function and its potential applications.
5. Evaluation and optimization of the topology via ambiguity function analysis As discussed in the chapter, sensor network imaging is one of the important applications of UWB sensors. In the UWB sensor network, there are stationary sensors (e.g. anchors), and mobile sensors. In the perspective of radar imaging, the spatial distribution of the stationary sensors would form a "real array", while the movement of the mobile sensors would generate a "virtual array" (i.e. synthetic aperture). The beam patterns of this "real array" and "virtual array" highly depend on their spatial configurations (topologies). In other words, the resolving performance of the real/virtual array highly depends on the topology itself. Beyond the topologies of the real and virtual arrays, the signal parameters such as the waveform, bandwidth, etc., could also impact the resolving performance of the system. That is, the overall resolving performance of the system is jointly decided by the parameters, including the topologies of the real and virtual arrays, as well as the signal parameters. This makes the analysis of the topology even more challenging. Sensor networks are designed to be highly accurate for their intended purpose. Always, designers and engineers are required to know the level of resolution expected from a particular sensor configuration. In order to evaluate and optimize the topologies, ambiguity function analysis is introduced in this section. Via ambiguity functions, we could know how the topology of the real/virtual array (i.e. the array formed by stationary/mobile sensors) contribute to the resolving performance of the system, and then further optimize it [30, 69]. Generally, in the far field, the ambiguity function can be factorized into several factors such as the signal related factor, the topology factor (associated with the "real array"), and the motion factor (associated with the "virtual array") [69], as shown in Fig. 16. The combination of these factors results in the overall resolving ability of the system. Theoretically, each individual factor can be used to evaluate a certain aspect of the resolution characteristics or optimize certain parameters instead of using the complicated ambiguity function of the system as a whole. As described in the scenario, a number of UWB sensors are deployed to image the environment in order to provide necessary information for further applications. As shown in Fig. 17, it can consist of a number of moving transmitters (Ti ∈ { T1 , T2 , .., TM } ) and a number of stationary receivers (R j ∈ { R1 , R2 , .., R N } ) . In this way, a UWB sensor network is constructed. The transmitters can move along predefined tracks (e.g. Track 1 & 2) to probe
Localization and Object Cooperative Localization and ObjectCooperative Recognition in Autonomous UWB Sensor Networks 20
L1
x0
...
5 0 -5
...
Track1
-10
Ti Track2
-15 -15
Rj
...
y (m)
10
L2
...
15
Recognition in Autonomous UWB Sensor Networks 21 199
-10
-5
0
5
10
15
x (m) Figure 17. UWB MIMO imaging scenario. “Track 1 & 2” are the transmitter tracks; Triangles: nonlinear tracks.
the environment. The receivers collect the backscattered probing signals to produce an image of the environment. Meanwhile, they could also serve as anchor sensors to support other applications, such as localizing and tracking the position of the moving transmitters [61]. The sensor motion factor is shown in Fig. 18 (a) and (b), with respect to different tracks (Track1 and Track2, as defined in Fig. 17). In the figures, apparently, the ripples are narrower in the direction of L1 compared to the direction of L2. It indicates that the resolving performance in the direction of L1 is better than that of L2, due to the total angular rotation in the direction of L1 is far greater than the angular rotation in the direction of L2 with respect to the reference x0 . For similar reasons, the resolving performance of “Track1” is better than the resolving performance of "Track2" in the corresponding directions. In addition, it is shown in Fig. 18 (a) that a “ghost” object occurs in the direction of L2, due to an insufficient illumination of the object. Generally, it would generate a false object image, and consequently worsen the quality of the image. In Fig. 18 (a) and (b), the motion factors are given with respect to linear tracks. However, in practice, the sensors are not necessarily moving along linear tracks. There may be more practical irregular tracks as shown in Fig. 17 where the triangles indicate the transmission positions. The irregular movement of the sensors could improve the performance of ghost suppression, since the irregular tracks can provide a more sufficient illumination of the environment compared to the linear tracks. According to the sensor topology in Fig. 17, the topology factor is given in Fig. 18(c). In the figure, the ghost image is partially suppressed. As shown in the figure, the suppression residuals exist at the ghost image position. However, they are not as strong as the real object. Theoretically, the ghost image can be further suppressed by optimizing the sensor spatial placement. Figure 18 (a), (b) and (c) indicate the resolution contribution of the sensor motions and the sensor placement topology to the overall resolution. As given in Fig. 17, the overall performance of the system is the combination of all involved individual factors. It implies that we can try to realize a better overall resolving performance by (i) optimizing each individual factor, or (ii) trading-off between related factors. For example, in order to suppress the “ghost” image, on the one hand, we can optimize the movement tracks via the motion factor and the sensor placement topology via the topology factor. On the other hand, a compromise can be made between the motion factor and the topology factor. In this sense, due to the interaction
200 Ultra-Wideband Radio Technologies for Communications, Localization and Sensor Applications 22
-20
-20
-20
L2
L2
20 40
60
60
-40
-20 0 x (m)
20
(a) Motion factor: Track 1
40
y (m)
y (m)
y (m)
L1
40
-60
0
0
0 20
Will-be-set-by-IN-TECH
L1
20 40 60
-60
-40
-20
0
20
x (m)
(b) Motion factor: Track 2
40
-60
-40
-20
0
20
40
x (m)
(c) Topology factor
Figure 18. The motion and topology factors given at a certain frequency f . For the motion factor, v · PRT = 5c/ f , where v is the sensor speed, PRF is the pulse repetition time, and c is the signal propagation speed. For the topology factor, the sensor element interval is 5c/ f , and the number of sensor elements on each array is 30.
of the factors, the sensor network provides more degrees of freedom for the system designer, compared with a single sensor system.
6. UWB for map building and localization This section deals with the problem of building a map of the surrounding area using the bat-type scenario introduced in Section 2.1 . This scenario is characterized by the fact that no supporting infrastructure is used and no external information about the location of the mobile, robot-like sensor is needed. Our goal is to build a map of the surrounding for the robot, while at the same time the robot localizes itself relative to the map. In the field of robotics, this problem is known as simultaneous localization and mapping (SLAM). To solve the complete SLAM problem, many different approaches have been presented e.g. in [62], but there well established sensor technologies like LASERs or optical cameras are used that would not work in the envisaged scenario and cannot make use of the unique capabilities of UWB radar, see Section 2.1. Other solutions are based on WLAN [53], RFID [32] or other external sources of information and, thus, must also be discarded. There are other approaches for indoor localization and/or map building using UWB technology, but they are restricted to estimate the 2D dimensions of a strictly rectangular room [14] or need a priori information about the positions of walls to calculate virtual anchor nodes [39]. The solution presented here is more general and copes with arbitrary room shapes as long as adjacent walls are straight and orthogonal to each other. The main advantage of this approach in comparison with the object recognition or the imaging in Section 7 and 8, is the fact that it is able to deliver a solution with a far lower number of measurements. In the following section, a solution to the SLAM problem using a UWB radar in the bat-type scenario is described. It uses measurement models incorporating three different typical room characteristics: straight walls, corners and edges and a state-space description of the room and the robot. Algorithms for dynamic state estimation are used to calculate the desired states. Data association of measured propagation times and room features is vital here and is dealt with in great detail. Results using simulated and measured data then show the feasibility of the concept. Special requirements for the antennas are also discussed.
Localization and Object Cooperative Localization and ObjectCooperative Recognition in Autonomous UWB Sensor Networks
Recognition in Autonomous UWB Sensor Networks 23 201
6.1. Measurement model
(a) single reflection
(b) double reflection
(c) scatterer
Figure 19. Three room features used in the state-space measurement equation.
To detect and localize the features, the bat-type UWB radar is used to measure the round-trip-times between the transmitting antenna, features of the surroundings, and the receiving antennas, which are extracted from UWB impulse responses and stored in the measurement vector z. A two-dimensional geometrical model of the real world is used in the algorithm, similar to [4]. Walls and corners are represented as single and double reflections, respectively. Edges and small objects are represented as scatterers. Schematic illustrations of the propagation models are shown in Fig. 19 . Using an estimated initial position and orientation of the antenna array and an estimated initial position of a feature, an expected time-of-flight between transmitter, feature and receiver can be calculated. This can be used for dynamic state estimation, for example in an Extended Kalman filter or a particle filter, to iteratively improve the estimate of the positions. By measuring at different positions or rotating the antenna array, it is possible to distinguish the different features and calculate an initial estimate of their positions. To do this, a state-space description of the room and the robot is needed.
6.2. State-space description of the room and the robot To solve the SLAM problem, a state-space description is used. The state vector x to be estimated consists of three different parts. � �T x = xrobot , xsensor , xmap
(7)
xrobot contains the information about the robot position in x and y direction, p x and py , as well as the speed of the robot, represented as movement angle pφ and the absolute value of the speed v. All values are in relation to the local coordinate system. �T � xrobot = p x , py , pφ , v
(8)
202 Ultra-Wideband Radio Technologies for Communications, Localization and Sensor Applications 24
Will-be-set-by-IN-TECH
In xsensor relevant information about the sensors like biases, vector b, or the orientation φarray of the antenna array relative to the robot is stored. � �T xsensor = b, φarray
(9)
The map consists of the coordinates of recognized features of the surroundings, called landmarks, and are stored in xmap . �T � xmap = xlandmark1 , ylandmark1 , xlandmark2 , ylandmark2 , ...
(10)
This is the largest part of the state vector. To estimate the current state xk of the system in time step k, first the a priori state estimate xˆ − k is calculated using the previous state xˆ k−1 by using the system transition function g ˆ k −1 ) xˆ − k = g ( u, x
(11)
where u is a control vector used to model external influences like movement commands to the robot. In a second step, the state estimate xˆ k is updated from xˆ − k using the measurements from the UWB radar. In what follows, the index k is often discarded to make the text better readable. The remaining problem is that of data association discussed in the next subsection.
6.3. Data association A major task in employing the UWB radar for SLAM is data association, in this case the task of assigning the time-of-flight measurements of the radar to corresponding features of the surroundings. The solution presented in this subsection uses two different grouping algorithm, one working in the state space, the other working in the measurement space. In both cases, the estimation of the map is done using a Rao-Blackwellized particle filter, as presented in [13]. The principal challenge we are facing is the fact that in indoor environments there is always an abundance of echoes to deal with. It is not always obvious which particular echoes belong together comparing the two impulse responses from the left and the right receiver channel. It is even harder to identify the feature which caused a particular pair of echoes. In order to improve the current state estimate, the task of determining which pair of impulses belongs to which already identified landmark has to be performed. This is achieved by applying different data association algorithms. 6.3.1. Data association in state space The first method is a probabilistic method in state space. For a given data association vector c an importance distribution π j (i ) is calculated for all impulses i and landmarks j, using the a priori state estimate xˆ − and the time of flights zi . � � π j (i ) = p zi |xˆ − , ci = j p (ci = j)
(12)
Localization and Object Cooperative Localization and ObjectCooperative Recognition in Autonomous UWB Sensor Networks
Recognition in Autonomous UWB Sensor Networks 25 203
This is possible because the a priori state estimate xˆ − contains the position and orientation of the antenna array as well as the position of the landmarks, so an expected time of flight can be calculated using the measurement functions presented earlier. Here, a Gaussian distribution with known covariance is assumed. p (ci = j) represents the probability of impulse zi being associated with landmark j . From the normalized importance distribution π the data association vector c is drawn by means of the Monte Carlo method. In this way, even in the case of false measurements being closer to the predicted measurement than the correct measurement, there is a chance that the right one is chosen. It is important to note that the opposite case, a false measurement chosen over a correct one, is also possible. So, at first glance, this method has no advantage over a simple Nearest Neighbor method, where only the measurement closest to the prediction is used. The Monte Carlo method tends to produce slightly worse results than simply choosing the association with the highest probability. This method makes sense if not only one state is estimated but many hypotheses of possible states. That is what the particle filter can handle. The particle filter tracks many hypotheses. These hypotheses are depicted as points, or particles, in the multi-dimensional state space. Each particle sl is composed of the estimated state xˆ l , the covarianz matrix Pl of the state, a data association variable cl where the association between measurements and landmarks is stored, and a weight wl .
sl = xˆ l , Pl , cl , wl
(13)
The index l denotes the lth particle. The weight wl is an indicator of the likelihood that a certain hypothesis holds true. It is calculated using the weight from the previous iteration. Thus, the weight serves as a memory. In the long run, the hypothesis with the highest weight will be the one that best approximates the real world. � wkl = wkl −1 p zk |xlk , clk 6.3.2. Data association in measurement space
(a) Cluttered measurements
(b) Associated measurements
Figure 20. Left: Cluttered sample measurements over time, right: Associated measurement curves.
(14)
204 Ultra-Wideband Radio Technologies for Communications, Localization and Sensor Applications 26
Will-be-set-by-IN-TECH
One problem that arises in using a particle filter is that due to the probabilistic nature of the algorithm the number of particles can grow considerably high. This is because the number of possible data associations increases with every measurement step. Using more particles or discarding unlikely hypotheses by resampling can only partially solve this problem. To reduce the necessary number of particles, we use a second approach: Measurements are not directly associated to landmarks. Instead, they are first grouped in the measurement space. To do this, the fact is used that the antenna array moves only in small steps between consecutive measurements, so measurements originating from the same feature also change only slightly. This correlation can be exploited. By employing a simple Kalman Filter in the measurement space, it is possible to predict and group measurements that belong to the same feature. Only whole groups of measurements are passed to the particle filter, which greatly reduces the number of hypotheses needed and therefore the number of particles necessary. Figure 20 shows a simulation of this process. In the left figure, measurements are taken as the robot travels through the environment. Dots indicate extracted time-of-flights. The measurements are cluttered, but almost continuous echoes originating from room features can be made out. The right figure shows the result of the grouping algorithm. The disadvantage of this procedure is that the grouping introduces a time delay in the system. Moreover, it requires measurements to be made more frequently, and so partly weakens one advantage of the room reconstruction algorithm.
6.4. Simulations The algorithm was first tested with simulated data. The ray tracing algorithm described in Section 3 was used to calculate the impulse response function of a room. The outline of the room is shown in Fig. 3, alongside with 78 measurement points. At each point, 120 measurements were made by turning the bat-type antenna array in steps of 3 degrees. The simulated environment consisted of a rectangular room with the size of 8 m by 9 m, with a rectangular column the size of 1.5 m by 1.5 m roughly in the middle. Between the walls and the column, six complex objects used to test the object recognition algorithm from Section 7 were placed. Walls, objects and the column were assumed to be of metal. The frequency response function was calculated from 4.5 GHz to 13.4 GHz for an antenna array with three double-ridged horn antennas in the bat-type configuration. The distance between the antennas was set to 0.5 m. Figure 21 shows the complete radargram for one whole rotation of the antenna array at point 16. In this example, it can be seen that for every angle, there are clear peaks in the impulse response that connect to peaks in the next measurement step, so data association in measurement space is possible. Mapping the whole room just from this position is not possible, because some features simply cannot be seen from there. To map the whole room, measurements from all 78 points were used. The result can be seen in Fig. 23. Walls, shown as solid and dotted lines, and corners, shown as triangles, are mapped at an accuracy of approximately 20 cm. Due to their small size, the placed objects are detected as point scatteres which are depicted as stars. Their positions correspond to the object locations shown in Fig. 3. At this point, a separate object recognition algorithm as described in Section 7 could be used to identify and distinguish them. Note that the origin of the coordinate system is set arbitrarily at the point of the first measurements.
Localization and Object Cooperative Localization and ObjectCooperative Recognition in Autonomous UWB Sensor Networks
Recognition in Autonomous UWB Sensor Networks 27 205
20 18 16 14
tc in m
12 10 8 6 4 2 0
0
50
100
150 200 angle in degree
250
300
350
1
1
0.9
0.9
0.8
0.8 Normalized impulse response
Normalized impulse response
Figure 21. Radargram at position 16 of the simulated room.
0.7 0.6 0.5 0.4 0.3
0.7 0.6 0.5 0.4 0.3
0.2
0.2
0.1
0.1
0
0
5
10 distance in m
(a) Left receiver channel
15
20
0
0
5
10 distance in m
15
20
(b) Right receiver channel
Figure 22. Impulse responses at position 16 of the simulated room, facing 0 degrees.
Figure 22 shows the impulse responses for the left and right channel at point 16 of the scenario described in Section 2.2. On the x-axis, the time t times the speed of light c indicates the distance the pulse has travelled. Peaks reflected or scattered from different room characteristics can easily be separated.
6.5. Measurements To further verify the results, measurements were made in a laboratory room. The room included furniture, some metal pipes on the walls, and was filled with assorted laboratory equipment at one end of the room. The sensor array consisted of three double ridged horn antennas 0.46 m apart, similar to the simulation. The antenna array was placed in the middle of the room and rotated manually. Pictures of the room can be seen in Fig. 25. As in the simulation, no information about the current angle of
206 Ultra-Wideband Radio Technologies for Communications, Localization and Sensor Applications 28
Will-be-set-by-IN-TECH
3 2 1 0
distance in m
−1 −2 −3 −4 −5 −6 −7
−3
−2
−1
0
1 2 3 distance in m
4
5
6
7
Figure 23. Reconstructed room.
the array was passed to the algorithm. The algorithm only used the UWB measurements to reconstruct the room. Figure 24 shows a sample of a recorded impulse response. In a first test, the array was rotated only by 180◦ , illuminating the tidy side of the room. In this case, results similar to those of the simulation could be produced; walls and corners could be mapped with 10-20 cm accuracy. A reconstruction of the whole room was not possible. Many objects on the other, chaotic side of the room produced a large number of echoes and made it impossible to associate the measurements reliably. Here, the algorithm reached its limits. In a second scenario, measurements were made at 15 positions in an L-shaped corridor, as depicted in Fig. 26. The array was rotated in 3 degree steps at every position, resulting in 1800 measurements. To test the ability of the algorithm to cope with sparse measurements, only 24 measurements at 5 positions (station 1, 4, 6, 8 and 12 of the scenario) were used, resulting in a total of only 120 measurements. Here, additional information about the position of the robot had to be used, in this case odometry data about the way the robot traveled and the direction the antenna faced. The use of inertial measurement units is also possible.
Localization and Object Cooperative Localization and ObjectCooperative Recognition in Autonomous UWB Sensor Networks
Recognition in Autonomous UWB Sensor Networks 29 207
Figure 24. Impulse response showing the features of the room
(a) Tidy side of the room
(b) Chaotic side of the room
Figure 25. Room used for measurements
The results in Fig. 27 show that the algorithm is able to recognize the outline of the room using only these few measurements, although a higher number of measurements still improves the quality of the reconstruction. There is also a trade-off between the different data association methods. While grouping in measurement space is only possible if the measurements are taken frequently, data association in state space can cope with few measurements, but rely on additional sensor data.
6.6. Optimized antenna design for SLAM To further optimize the results of the SLAM algorithm described in this section, antennas with a broader 3 dB beam-width (>60◦ ) than for the object recognition in section 7 are needed. Apart from the broad frequency band of 3.5 to 10.5 GHz in order to meet further conditions the antenna also has to be dual-orthogonally polarized. The radiation phase center should be constant over frequency, and the two polarizations should have identical radiation conditions. In literature several types of UWB antennas can be found. Most of them are either biconical
208 Ultra-Wideband Radio Technologies for Communications, Localization and Sensor Applications 30
Will-be-set-by-IN-TECH
12
10 station 15
station 14
Distance [m]
8
station 12 station 10
station 13
station 8 station 7 station 6
station 9
station 11
station 5
6
station 4 4 station 3 2
station 2 station 1
0
−2
−18
−16
−14
−12
−10
−8 Distance [m]
−6
−4
−2
0
2
Figure 26. Outline of the measurement scenario.
12
12 10
10 path of the robot
Distance [m]
Distance [m]
path of the robot
8
8 6 4
6 4 2
2 0
0
−2
−2
−15
−10 −5 Distance [m]
0
−15
−10 −5 Distance [m]
0
(a) Reconstruction using 1800 measurements (b) Reconstruction using 120 measurements
Figure 27. Reconstructions of an L-shaped corridor using different numbers of measurements. Dotted lines show actual room outline.
structures [5], traveling wave radiators [16], or even a combination of both [6]. The requirement of a common phase center (over frequency) limits the possible solutions. For this purpose a planar solution, a broad-side radiating antenna is chosen and optimized. The antenna consists of two elliptically shaped dipoles surrounded by a metallic ground plane as shown in Fig. refschematic . The ellipses for each polarization (vertical and horizontal) are orthogonal to each other. Contrary to normal dipoles the feeding is separated and placed between the ground plane and the single ellipses. This is outlined by the arrows in the radiating element shown in Fig. 28. This type of feeding allows a separate feeding for each polarization and helps to keep the current distribution in the radiation zone symmetrical resulting in a constant phase center (of each polarization) exactly in the middle of the elliptical dipoles (two monopoles) [1].
Localization and Object Cooperative Localization and ObjectCooperative Recognition in Autonomous UWB Sensor Networks
Recognition in Autonomous UWB Sensor Networks 31 209
Figure 28. Schematic illustration of the dual polarized antenna element and the feeding networks, all units in mm).
The feeding networks themselves are placed orthogonally to the radiating element, see Fig. 29 (left). Similar to the Vivaldi structure, Fig. 32, a balun is used for microstrip to slotline transition. The slotline is then split up and used to feed the monopoles. The two polarizations are realized by shifting the two orthogonal feeding elements into each other as shown in Fig. 28. Therefore, a slot has to be cut into both (feeding) networks. The gaps in the metallic structures have to be closed again. This is realized by soldering through vias in the respectively orthogonal feeding network.
Figure 29. Schematic illustration (left) and photograph (right) of the 4-elliptical antenna
210 Ultra-Wideband Radio Technologies for Communications, Localization and Sensor Applications 32
Will-be-set-by-IN-TECH
As this type of antenna is radiating broad-side in both directions (forward and backward) and should be used as (mono-) directional radiating antenna, the backward radiation (illuminating towards the feeding network) must be absorbed by a carbon fiber housing as shown in Fig. 29. This results in a reduction of the radiation efficiency. An alternative would be to use a reflector, which, however, would limit the bandwidth of the antenna. The antenna characteristics are measured with a vector network analyzer in an anechoic chamber. The input impedance matching is around -10 dB between 3.5 and 10.5 GHz and the decoupling of the two ports is approximately 20 dB. Figure 30 shows the 2D gain over frequency and angle for both planes (E- and H-plane) of one polarization in co-polarization arrangement. The measured gain of the second polarization is very similar and not specifically shown.
Figure 30. Measured gain over frequency and angle in the E-plane (left) and H-plane (right).
This solution of a planar, dual-polarized UWB antenna covers the frequency range between 3.5 and 10.5 GHz. In this frequency range, the radiation pattern of the antenna remains stable and directive. Both polarizations have the same radiation phase center, which is frequency-independent.
7. Short range super-resolution UWB-radar sensing In recent years short range UWB radar sensing and imaging has gained steadily increasing interest in research. The demand for a wide absolute bandwidth results from the smallest dimensions to be resolved. However, the request for increased resolution capabilities strove for innovative algorithms, new hardware equipment, and for performance which is not restricted by the bandwidth defined by the hardware. In this chapter novel and pioneering methods, algorithms and antennas are presented which were investigated within CoLOR for UWB radar applications especially in short range UWB radar applications.
7.1. Antenna design and measurement results As the use of polarization diversity allows further information about the object characteristics to be obtained, for instant about the surface structure as it is shown in this section, the antenna has to be orthogonally polarized. Apart from orthogonal polarizations, further conditions for the (object recognition) antenna design are a high gain and a common phase center (for both polarizations).
Localization and Object Cooperative Localization and ObjectCooperative Recognition in Autonomous UWB Sensor Networks
Recognition in Autonomous UWB Sensor Networks 33 211
A common antenna for such an application is the so-called Vivaldi antenna. The radiation mechanism is based on exponentially tapered slots and the traveling wave principle [3]. This type of antenna has a convenient time domain behavior as shown in [59] and a relatively stable radiation pattern in the whole frequency range. In CoLOR the frequency range for the final demonstrator covers 3.5 to 10.5 GHz. A second band from 4.5 to 13.5 GHz was also used during the development process. Therefore, the objective of the antenna design is to cover the hole frequency range from 3.5 GHz to 13.5 GHz. A 3D illustration (left) and a photograph (right) of the fabricated antenna is shown in Fig. 31, see also [45]. Combining the integration of two tapered slot line antennas on a single substrate with embedding them into Polytetrafluoroethylene (PTFE) allows the total bandwidth to be covered. The integration of two radiation elements per polarization yields a higher gain and saves space compared with an array of two separated antennas. Furthermore, it is less cost intensive and easier to manufacture. The possibility of varying the tapering of the inner and outer structure, see Fig. 32, can be used to focus the beam.
Figure 31. Antenna, embedded in the dielectric.
Both radiating structures are fed by a network shown in Fig. 32 (left), and for the second polarization in Fig. 32 (right), respectively. Starting with microstrip, where the connector is soldered on, an aperture coupling transforms to slotline which finally divides the power and feeds it to the two elements. As already mentioned, the integration of the antenna elements into a dielectric reduces the effective wavelength. This affects several advantages compared to an antenna in free space. The antenna is capable of radiating a lower frequency, the far-field conditions are fulfilled in a closer distance and the shaping of the dielectric can (also) be used to focus the beam and for sidelobe suppression. For this work PTFE is chosen as dielectric. Its permittivity of �r = 2.1 is similar to that of the substrate used (Rogers Duroid 5880 with �r = 2.2). Furthermore, PTFE has low losses and can be easily shaped to adapt to the antenna design. The shaping and the dimensions of the PTFE structure are given in [45]. The conically shaped rod (in radiation direction) allows a smoother transition of the guided wave into free space. The two polarizations are realized by shifting two orthogonal elements into each other as shown in Fig. 31 left. For doing this, a slot has to be cut into both elements. Thus, the metalized structures are interrupted, see Fig. 32. They have to be galvanically connected again. This is realized by introducing vias in the orthogonal antenna.
212 Ultra-Wideband Radio Technologies for Communications, Localization and Sensor Applications 34
Will-be-set-by-IN-TECH
Figure 32. Schematic illustration of the antenna elements 1 (left) and 2 (right), in [mm].
The antennas are manufactured with aid of a circuit board plotter on a Duroid RT5880 substrate of a thickness of 0.79 mm. The measured S-parameter, see Fig. 33 left, show a good impedance matching for both polarizations and antenna elements, respectively, between 3.5 GHz and 13.5 GHz (and even higher). The decoupling (S21 , S12 ) between the two elements is over the biggest portion of the bandwidth better than -25 dB.
Figure 33. Measured S-parameter (left) and antenna gain in the main beam direction (right).
The gain and the pattern of the antenna were measured in an anechoic chamber. The results for antenna element 2 are presented in Fig. 34. The E-plane corresponds in this case to the azimuth direction, see Fig. 34 left, the H-plane to the elevation one. Antenna element 1 shows a similar characteristic. The maximum gain measured is around 15 dBi at 9 GHz. To evaluate the polarization properties, the gain for both co-polarizations (Co-Pol) and both cross-polarizations (X-Pol) in the main beam direction was measured, see Fig. 33 right. The difference (between Co-Pol and X-Pol regarding the antenna gain) provides the information about the polarization purity. The cross-polarization suppression is better than 20 dB at the low frequencies up to 10.5 GHz. Starting from 10.5 GHz, the values of the X-Pol of antenna 2 are increasing (deteriorating). This is due to the current distribution of higher modes which cannot be avoided for higher frequencies. Nevertheless the measured performance allows a successful use in polarization diversity systems even above 10.5 GHz, see [45].
7.2. Data pre-processing The raw radar data provided by the M-sequence radar needs some form of data pre-processing to smooth pulse shape, improve dynamic range, minimize the signal to interference plus noise ratio (SINR) by reducing range sidelobes and finally to enhance the
Localization and Object Cooperative Localization and ObjectCooperative Recognition in Autonomous UWB Sensor Networks
Recognition in Autonomous UWB Sensor Networks 35 213
Figure 34. Measured gain [dBi] and pattern of antenna element 2 in the E-plane (left) and H-plane (right) .
temporal resolution. The channel impulse response of the radar link can be extracted by deconvoluting with a reference pulse, as we assume the link as an LTI-system. However, it is well known that classical deconvolution by spectral division may drastically distort the result especially at low SNR values. A highly efficient method with low complexity to perform the deconvolution is to apply a simplified Wiener filter with the transfer function Hwiener ( f ) =
Hre f ( f )∗ | Hre f ( f )|2 = Hre f ( f ) | Hre f ( f )|2 + 1 | Hre f ( f )|2 + 1 1
(15)
where Hre f ( f ) is the Fourier transform of a previously measured offline reference pulse. Hence, the estimate of the deconvoluted channel impulse response hdeconv (t) is then obtained as hdeconv (t) = hwiener (t) ∗ hmeasured (t) , with hmeasured (t) being the measured impulse response under test. Depending on the power level, the Wiener filter either acts as an inverse or matched filter for the deconvolution. In Fig. 35 an example of the channel impulse extraction is shown. Note that both pulses are normalized to the same power to enable visual comparison in the plot. 0.1
Pulse under test Wiener deconvoluted pulse under test
Amplitude [V]
0.05
0
−0.05
−0.1 0
0.5
1 Time [ns]
1.5
2
Figure 35. Example of deconvoluted pulses normalized to the same power
7.3. Material characterization A material characterization in hostile and pathless scenarios requires a remote measurement. Hence, a method known from optics, the ellipsometry has been adapted to the UWB
214 Ultra-Wideband Radio Technologies for Communications, Localization and Sensor Applications 36
Will-be-set-by-IN-TECH
microwave range. The estimation of the dielectric characteristics, especially the permittivity and the emissivity are based on the ratio of the reflected power measured at two orthogonal polarizations. The orientation of the polarization is defined with regard to the plane of incidence. The plane of incidence is orthogonal to the surface of the object and is spanned by the incoming and the reflected ray. In Fig. 36 a drawing of the functional principle is given.
Rx
Tx
θi
θi
objects surface Figure 36. Schematic representation of the functional principle.
�r −→
3.5 3 2.5 2
0
0.1
0.2
0.3
0.4
Distance from border in meter −→ Figure 37. Permittivity (blue) and simulation values (red) as a function from the distance from the border.
The calculation of the permittivity is performed by the inverse application of the Fresnel-formulas. Assuming a material with a relative permeability μr = 1, the expressions for the calculation of the relative permittivity �r and the emissivity e can be written as follows, with E as the received electric field strength for each polarization:
�r =
�� � sin2 θi EE⊥ − 1 2 � + sin2 θi � � cos θi EE⊥ + 1 �
and
� � � 1 − √ � �2 � � r √ � . e = 1−� � 1 + �r �
(16)
Here, it is important to note that the given expression for the emissivity e is valid for a straight monitoring of the hot spot. The additional information about the hot spot dimension and distance e.g. to a radiometer can be supplied by the UWB radar. So, an estimation of the hot spot temperature is possible.
Localization and Object Cooperative Localization and ObjectCooperative Recognition in Autonomous UWB Sensor Networks
Recognition in Autonomous UWB Sensor Networks 37 215
The ellipsometry method allows an accurate characterization of plane surfaces with the main restriction to measure at a distance of at least 25 cm to any corner. The estimation of the permittivity of a small object or of objects with a complex shape is significantly influenced by effects of diffraction and scattering. As an example in Fig. 37, the deviation of the estimated relative permittivity of a MDF wall (with relative permittivity of approximately 2.9) is plotted as blue line over the distance from the antennas to the corner of the wall. In order to overcome this restriction, the UWB ellipsometry method is used in a combination with the object recognition process using the imaging methods as described later in this chapter. The distortions of the estimated permittivity values, which arise due to the diffraction effects, are then simulated (red curve in Fig. 37) and the calculated patterns of the permittivity curve are then compared with the corresponding measured pattern. For a first investigation, a simplified simulation algorithm (designed for online measurements) to consider the effects of reflection and diffraction for canonical 2 D objects was implemented. The results show that an accurate estimation of the dielectric characteristics of small objects is possible, with an accuracy of about ±3 % for typical indoor objects (e.g. composed of fiberboards or bricks) with dimensions greater than 10 cm. The effect of the object surface structure on the material estimation was analyzed by measurements of bulk materials. For slight roughness, i.e. height deviations much smaller than the wavelength, there is almost no influence on the estimation of the permittivity. For surfaces with a roughness in the order of the wavelength, the estimation of the permittivity has an uncertainty of less than 20 %. The surface roughness can be estimated by the analysis of the depolarization, i.e. measuring cross-polarized to the transmitted polarization. For the measured indoor materials with rough surfaces, the cross-polarized power is at least about 15 dB higher than for flat surfaces.
7.4. Pulse separation The fundamental problem common to all super-resolution approaches is the precise extraction of the round trip time of UWB pulses. While this approach can easily be performed for single reflection measurements, things become challenging when the distance between multiple scattering centers drops below the range resolution. Constructive and destructive interferences are caused, and the shape of the resulting superposed pulses is distorted massively. Common algorithms for this purpose were analyzed, evaluated and extensively tested under various circumstances. In most cases, they can hardly resolve richly interfered pulses which overlap almost the whole pulse width or have vast computational load. Often, to some extent a priori information is necessary (e.g. the number of pulses to be separated), otherwise these algorithms suffer from inflexible termination conditions or need huge post-processing. Within the CoLOR project a novel wavefront extraction algorithm called Dynamic Correlation Method (DCM) was proposed, [51]. The DCM is based on a correlation search using a set of two differently shifted reference pulses. Thus, the resulting correlation coefficients are no more just a function of one temporal parameter but rather of two parameters which result in a matrix of correlation coefficients. DCM does not ignore the interfering signature of backscattered pulses and provides a pair of pulses taking the interference pattern of them into account. Additionally, it terminates adaptively to different power levels which enables the detection of weak reflections and avoids post-processing. For a further detailed description and a comparison with alternative methods, see [51].
216 Ultra-Wideband Radio Technologies for Communications, Localization and Sensor Applications 38
Will-be-set-by-IN-TECH
7.5. Short range imaging algorithm In [28] , an imaging algorithm called Range Point Migration (RPM) was proposed that utilizes fuzzy estimation for the Direction Of Arrival (DoA). It extracts a direct mapping by combining the measured distance of the wavefront with its DoA. It realizes a stable imaging of even complex objects and requires no pre-processing like clustering or connecting discontinuous wavefronts. The 2D RPM was introduced in [28] for a planar sensor track nearby the object which allows either only a limited image of the lateral region of the object or requires huge scan distances. Consistently, the back region of the object is not scanned and, hence, not imaged. In [28] the RPM was extended to 3D where the sensors are placed on a planar surface in front of the 3D object. However, this 2D sensor track, too, is not capable of a full perspective of all stereoscopically distributed voxels (volume pixel) of 3D objects. In CoLOR, the RPM was extensively analyzed, validated with numerous measurements in different scenarios and further improved [49]. For a full perspective of the object, the sensor track and the antenna alignment need circumnavigation to extract entirely all stereoscopically distributed voxels. In order to reconstruct a full 3D object contour, the scan pattern of the sensors was modified and extended to a spatial scanning including the z-axis. Experimental validations were carried out based on complex test objects with small shape variations relative to the wavelength used (for results see Fig. 40). The main principle of the improved RPM, which is called Fuzzy imaging henceforth, shall briefly be described on the basis of the following illustration of a simple scenario with 3 measurements. �� � �� ���
��� � �� ��� ���� ���� �������
�
�
�
��
��� �� ��������
��
� ��
�� �� ��������
��
��� �� ��������
��
�� �� ��������
Figure 38. Measurement scenario to illustrate the principle of Fuzzy imaging
In the 1st scenario on the left side of Fig. 38, an object under test is measured at two antenna positions which are separated from each other by a distance d1 which equals c. Both positions provide the time of flight and the distances a and b, respectively. With a geometric approach (law of cosines), the intersection points of the wavefronts as well as the angle α12 are extracted. Afterwards, shown on the right side of Fig. 38 a 3rd measurement is performed at a distance of d2 < d1 and provides the new angle α13 . Evidently, for d2 → 0, the antenna configuration converges to a mono-static configuration. In that case, α13 → αideal which would result in an exact image point when combined with the corresponding time of flight measurement.
Localization and Object Cooperative Localization and ObjectCooperative Recognition in Autonomous UWB Sensor Networks
Recognition in Autonomous UWB Sensor Networks 39 217
The set of angles α1n with its n neighboring wavefronts are called crisp set in terms of Fuzzy logic. Each of these scalar values could be regarded as one Dirac delta function at the corresponding angle value and is used for further processing. However, this would only make sense in the case of ideal point scatterers. Once the dimensions of the object are expanded or if the object consists of additional complex structures (e.g. edges and corners), it would result in erroneous image points. Fuzzy technology is applied here to compensate such influences and to still use a kind of convergence of nearby wavefronts. Therefore, each angle of the discrete crisp set is Fuzzyfied by a Gaussian membership function. Hence, the result does not only depend on one scalar but on a Fuzzy set around each scalar. A scaling/clipping operation of the amplitude of the neighboring reflection point is performed to focus on strong reflections and scattering. Additional weighting is performed which scales the fuzzy sets as a function of the distance between the neighboring position and the one under test. Thus, it is ensured that the influence of sensors being further away is minimized. Afterwards, an accumulation of these differently weighted fuzzy sets is performed. The DoA can be estimated by a maximum defuzzyfication operator. Within CoLOR it was investigated whether the standard deviation of the Gaussian membership functions are crucial parameters for the image processing. Depending on these parameters, the algorithm either extracts straight parts of the contour of the object, if it is larger than several wavelengths, or it extracts object features, i.e. scattering centers (edges and corners). A strong echo, i.e. a specular reflection is received only when the main lobe of the antenna is aligned to the normal of a smooth surface of the object. However, in the case of a circular track this occurs very rarely, if the cross-section of the object is not a circle. Scattering and diffraction effects overbalance immensely within a circular track, even more if the scan track is spread over a large circular arc. To overcome this problem, weak echoes which spread spherically from the edges can be recorded from any line of sight position. For detailed information, an extensive discussion, as well as the extension to 3D imaging see [49].
0.3
2.2
Separated pulses
1
2.1
1.9
0
1.8
0 −0.1 −0.2
−0.5
1.7 1.6 0
0.1
norm
[V]
2
h
Distance [m]
0.5
Distance [m]
0.2
100
200 Angle [°]
300
−0.2 −0.1 0 0.1 0.2 Distance [m]
Figure 39. Radargram with extracted wavefronts on the left side and corresponding object on the right with extracted image points.
On the right side of Fig. 39 the object under test is depicted in blue. This object was scanned on a circular track with 1◦ grid resulting in the radargram shown on the left side. The wavefronts which are extracted with the DCM are also plotted in the radargram. With the previously discussed Fuzzy imaging the red image points shown on the right side are extracted.
218 Ultra-Wideband Radio Technologies for Communications, Localization and Sensor Applications 40
Will-be-set-by-IN-TECH
0.8 0.7 0.6
Z [m]
0.5
0.7
0.3
0.65 Y [m]
0.4
0.2 0.6
0.1 0.55
0.5
0 0.8 −0.1
−0.05
0 X [m]
0.05
0.1
0.2 0.6 Y [m]
0 0.4
−0.2
X [m]
Figure 40. Photograph of an 3D test object on the left. Extracted 3D Radar image with Fuzzy imaging in the middle and top view on the right.
7.6. Exploitation of polarimetric diversity gain The exploitation of polarization diversity in radar application provides additional information compared to mono-polarized sensing techniques. This polarization diversity gain enhances the efficiency of object classification according to the information contained in the backscattered signal. Hence, additional characteristics of objects such as shape, details of surface structure and orientation are gathered which may remain invisible for mono-polarized systems. However, in the literature polarization characteristics are rarely considered and most approaches use mono-polarized EM-waves. By the exploitation of polarization diversity the performance can be increased significantly. Unpolarized electromagnetic incident waves on an object are diffracted or scattered in all directions. The spatial distribution of scattered energy depends on the object geometry, material composition, the operating frequency and polarization of the incident wave. 7.6.1. Polarization diversity gain in short-range UWB radar object imaging Investigations and results shall be demonstrated by a complex edged 2D object with 6 corners. This object is measured on a circular track at a 1◦ grid which results in 360 measurements. The contour of the object can easily be recognized on the right side of Fig. 41. The sensors are the previously introduced crossed Vivaldi antennas embedded in PTFE which allow full polarimetric measurements. The imaging algorithm used in this work is Kirchhoff Migration (KM). KM relies on some form of coherent summation, which means that a pixel of the radar image is produced by integrating the phase-shifted radar data of the field amplitude measurements at each antenna position. KM image spots of high intensity correspond to the scattering centers of the object. The image contrast is higher with increasing number of recorded impulse responses at different antenna positions. Here, the object is of 1 m height with about 1 m distance to the object in a bi-static configuration with 0.25 m distance between the transmitter and receiver. Actually, the object is a column with no variation in the height. Thus, it has vertical predominant directions causing stronger reflection in co-polarization or VV, respectively
Localization and Object Cooperative Localization and ObjectCooperative Recognition in Autonomous UWB Sensor Networks
Recognition in Autonomous UWB Sensor Networks 41 219
(notation: the first index indicates the polarization of the transmitter, the second index the one of the receiver). 4 0.25 3 0.2 0.15
2.1
−0.15
1.8
−2
−0.2
−0.5
−3 −0.25
1.7 1.6 0
0 −1
[V] 0
0 −0.05 −0.1
norm
1.9
h
Distance [m]
0.5 2
1 0.05
Intensity
1
Distance [m]
2.2
2
0.1
50
100
150 200 Angle [°]
250
300
350
−0.2
−1
−0.1
0 0.1 Distance [m]
0.2
0.3
−4
Figure 41. Radargram of the object under test with cross-polarization and 45◦ rotated antennas on the left and the extracted KM image from this radar data.
However, this object has more or less parts which imitate the scattering and reflection characteristic of flat plates or 0◦ - dihedrals. In the field of polarization research it is well known that dihedrals have strong polarizing effects. For example, a 0◦ -dihedral (the angle between the fold line of the dihedral and the vertical axis) has only co-polarized components, whereas a 45◦ -dihedral has only cross-polarized components. Therefore, dihedrals are especially suitable for calibration in polarimetric measurements. In order to exploit polarimetric diversity gain a 45◦ shift is missing in the radar link [52]. As mentioned before, this would actually depolarize the wave. However, by rotating both antennas by 45◦ , the scattering characteristic of the object edges are comparable to 45◦ -dihedrals. Hence, in Fig. 42 both sensors are positioned diagonally. Using such a rotated configuration a cross-polarized measurement was performed with cross polarization. 4 0.25 3 0.2 0.15
2
0.1
2.1
[V] 0
norm
1.9
h
Distance [m]
0.5 2
1.8
1 0.05 0
0
−0.05 −1 −0.1 −0.15
−2
−0.2 −3
−0.5 −0.25
1.7 1.6 0
Intensity
1
Distance [m]
2.2
50
100
150 200 Angle [°]
250
300
350
−1
−0.2
−0.1
0 0.1 Distance [m]
0.2
0.3
−4
Figure 42. Radargram of the object under test with cross-polarization and 45◦ rotated antennas on the left and the extracted KM image from this radar data.
220 Ultra-Wideband Radio Technologies for Communications, Localization and Sensor Applications 42
Will-be-set-by-IN-TECH
In Fig. 42, it can clearly be seen that only the corners are focused in the resulting image but not the flat structures. The reason for this effect is that a flat plate does not depolarize but a 45◦ -dihedral does. Thus, the detection capability of a UWB radar system can be improved by exploiting polarization diversity. Under certain circumstances, the radar images detect object features which would have remained invisible in mono polarized radar systems. Supplementary information about the contour, orientation and dimensions of the object can thus be obtained, which upgrades super-resolution UWB radar significantly. 7.6.2. Polarimetric investigation of bulk goods with rough surfaces One possible discrimination criterion between smooth and rough surfaces is to exploit specific depolarization effects. Rough in this context means that the standard deviation of the outer surface height distribution is in the range of some wavelengths of the operating carrier frequency, i.e. 9 GHz in this case. To obtain results which are independent both of material and shape, extensive measurements were performed. Four metallic objects with smooth surfaces were used for the investigations, 2 objects with a square cross section of different size, an object with isosceles triangular cross section, and an object with a rectangular cross section. Details are shown in Fig. 44. For comparison with rough surfaces 4 polystyrene bins were built which were filled with bulk goods made of chunky gas concrete, chunky sand-lime brick, medium density fiberboard (MDF) blocks with 0.01 m edge length and M16 × 25 mm screws. Due to the material composition, the polystyrene bin itself has a vanishing radar cross section so that reflections caused by the bin are negligible. For depolarization investigations, these 8 objects under test were scanned in both co- as well as in both cross-polarized configurations on a circular track with a radius of 1 m at a 1◦ grid. The depolarization is expressed by the relation of signal powers PVH /PVV . In Fig. 43 the results for an object with a square cross section are compared with those of bulk good objects. Expectedly, objects with a smooth surface depolarize least, i.e. about -20 dB in the mean of all measurements. This complies with the 20 dB cross-polarization suppression of the antenna characteristic. The depolarization is least when an edge with predominantly vertical orientation is illuminated. Gas concrete and MDF are the bulk goods which depolarize most. The higher the permittivity is the more the bulky material depolarizes, i.e. sand-lime brick with about 8 dB more and the screws which depolarize most with over 10 dB more than the objects with a flat surface. So UWB radar seems to be capable of discriminating objects of different materials by the roughness of their surface, subject to the condition that the height deviation is not much smaller than the wavelength. These results highlight the superior capabilities of fully polarimetric systems and recommend their use in future radar systems.
7.7. Object recognition for full and restricted circumnavigation The object recognition (OR) method proposed in this work is part of the previously introduced super-resolution radar imaging system. The investigated objects and the reference alphabet derived from these consist of simple canonical and some polygonal complex objects shown in Fig. 44.
Localization and Object Cooperative Localization and ObjectCooperative Recognition in Autonomous UWB Sensor Networks �
�
�
� ""&��%'$����
����� �
��
����� �
��
�
�
��#"��$�*�&�"!��
�
�
���
��� !�����+�
���
�
��
��
�
�
��
�%��"!�$�&�
ï�
��
��
�
� �
�
�
����)��� �%�$�(% ��!�� ���$���
ï�
��#"��$�*�&�"!��
��#"��$�*�&�"!������������� �
ï�
Recognition in Autonomous UWB Sensor Networks 43 221
� �
�
�
���
��� !�����+�
���
� �
���
��� !�����+�
���
Figure 43. Results of the depolarization investigation of the object with square cross section, with 0.3 m edge length and the bin with same inner dimension, respectively. The depolarization coefficient PVH /PVV of the smooth surface is depicted on the left. The same coefficient is shown of the bulk goods in the middle and on the right side.
As mentioned above, the OR algorithms in [50] and [48] yield very robust results with the method of moment invariants and Fourier descriptors, which was proven for images obtained on complete circular tracks around the objects. However, in many cases such complete tracks are not possible as they lead to unfinished object images. To perform an OR also in such situations the method of Curvature Scale Space (CSS) was applied due its ability to robustly recognize contour parts [35]. 7.7.1. Object recognition algorithm with the curvature scale space The CSS representation is invariant against rotation of objects as this causes a circular shift of the CSS which has no effect on the recognition process, since the CSS of an object under test is compared by a correlation to the CSS of all reference objects. Moreover, CSS is highly robust against noise as most of its influence is compensated for to some degree by a smoothing Gaussian filter. Another property of the CSS is that it retains the local properties of shapes. Each peak of the CSS corresponds to a concavity or a convexity. A local deformation of the shape causes a change just in the corresponding local contour of the CSS image. Thus, a restricted curve can exactly be found in the CSS of the whole curve. Moreover, the absolute value of a CSS peak indicates the curvature radius, and the algebraic sign of the peak indicates whether the curve is concave or convex. In Fig. 45 a plane curve with 8 convex or concave parts is drawn in blue. The Gaussian smoothed curve is drawn in red. On the right side of Fig. 45 , the corresponding curvature of the smoothed red curve is plotted.
222 Ultra-Wideband Radio Technologies for Communications, Localization and Sensor Applications 44
��
Will-be-set-by-IN-TECH
��
��
��
��
��
�
�
��
���
���
���
��
Figure 44. Cross-section of the 12 reference objects. The first 6 objects o1 - o6 were used for experimental OR investigations. �
�
�
�
�
�
�
� �
�
� �
� � �
�
Figure 45. A plane curve in blue with its Gaussian smoothed version on the left, and the curvature of the smoothed curve on the right.
7.7.2. Object recognition performance test The previously discussed OR algorithm based on the comparison of CSS was applied to Objects o1 - o6 in a vast measurement series. Every object under test was measured for 400 different orientations and different locations with an offset up to 0.2 m for a full circular track, a restricted track of 270◦ and 180◦ , respectively. In the evaluations, every CSS of an object under test was compared with all 12 reference CSS data by a correlation function. The global maximum of the 12 correlation functions then indicated the recognized object.
Localization and Object Cooperative Localization and ObjectCooperative Recognition in Autonomous UWB Sensor Networks 1 Probability of occurrence
Probability of occurrence
1 0.8 0.6 0.4 0.2 0
Recognition in Autonomous UWB Sensor Networks 45 223
0.8 0.6 0.4 0.2 0
1 2 3 4 5 6 7 8 9 10 11 12 Object Nr.
1 2 3 4 5 6 7 8 9 10 11 12 Object Nr.
Figure 46. Discrete probability density function of the recognition process of object o1 for 270◦ track (left) and 180◦ track (right).
Figure 46 shows that object o1 can clearly be recognized even with the restricted track of 270◦ . Only for the 180◦ angle restriction, object o3 is recognized instead of o1 which is not unexpected since o3 equals a part of o1. 1
0.8 0.6 0.4 0.2 0
0.8 0.6 0.4 0.2 0
1 2 3 4 5 6 7 8 9 10 11 12 Object Nr.
1 Probability of occurrence
Probability of occurrence
Probability of occurrence
1
0.8 0.6 0.4 0.2 0
1 2 3 4 5 6 7 8 9 10 11 12 Object Nr.
1 2 3 4 5 6 7 8 9 10 11 12 Object Nr.
Figure 47. Discrete probability density function of the recognition process of object o5 for a full track (left), 270◦ track (middle) and 180◦ track (right).
Figure 47 shows that object o5 can be recognized in about 80% of all cases for a full track. This value drops to about 60% when the track is restricted to 270◦ . For 180◦ track o5 cannot be recognized anymore and is confused with o3.
0.6 0.4 0.2
1 2 3 4 5 6 7 8 9 10 11 12 Object Nr.
Probability of occurrence
0.8
0
1
1 Probability of occurrence
Probability of occurrence
1
0.8 0.6 0.4 0.2 0
1 2 3 4 5 6 7 8 9 10 11 12 Object Nr.
0.8 0.6 0.4 0.2 0
1 2 3 4 5 6 7 8 9 10 11 12 Object Nr.
Figure 48. Discrete probability density function of the recognition process of object o6 for a full track (left), 270◦ track (middle) and 180◦ track (right).
Object o6 has approximately the same recognition characteristic as o5, as shown in Fig. 48. As both edge lengths of o6 are 0.3 m, o1 is falsely recognized as a certain part of its cross section has the same form as o5 or o6.
224 Ultra-Wideband Radio Technologies for Communications, Localization and Sensor Applications 46
Will-be-set-by-IN-TECH
7.8. Transfer onto the mobile robot Research investigations and algorithms had to be transferred onto a new mobile platform to demonstrate the essential results obtained in CoLOR. Many challenges in the area of robotics, localization and robot motion resulted. Additionally, an optimal alignment of the sensors and robust UWB radar sensing conditions had to be taken into account for the motion of the robot. The motion algorithm for the robot when moving around the objects are designed to be contour adaptive, exhibit collision avoidance features, and use the shortest tracks through a room while maintaining optimal antenna alignments.
0 1.5 1
−0.5
0.5 −1 20 40 60 80 Number of Measurement
0.5 0
2
1 0.8
0
0.6 −2
0.4
0
0.5 1 1.5 Distance [m]
Intensity
0.5
2
1.2
1
Distance [m]
2.5
1 hnorm [V]
Distance [m]
3
Distance [m]
1.5
0.2 0.4 0.6 0.8 1 Distance [m]
Figure 49. Example of the inspected object o1. The obtained radargram (left), the wavefront-based imaging of the object with robot track (middle) and the same object with a migrated image (right).
8. UWB Imaging 8.1. Imaging in distributed multi-static sensor networks Although imaging in distributed multi-static sensor networks results in a rough image of the environment, its quality is usually better than the quality of the image obtained by a single bat-type sensor autonomously operating in an unknown environment. Sensor networks offer more diverse information for imaging algorithms. The resulting quality of the image greatly depends on the number and the positions of the illuminating and observing nodes. If there are enough illuminating and observing nodes available simultaneously, then the instantaneous information can be used even for imaging of time variant scenarios with moving objects. For imaging of static environments, one moving observer is enough. The moving observer collects data, and the image is built sequentially and improved gradually by an imaging algorithm. The time domain imaging algorithms are referred to as Kirchhoff migration. They rely on Born’s approximation, which presumes undisturbed ray-optical propagation [9]. Their basic principle is depicted in Fig. 50 (a). The illuminator transmits a signal at the fixed point [ x T , y T ]. At the variable position [ x Ri , y Ri ] the receiver collects the impulse responses. Assuming single bounce reflection and the propagation velocity v, the echo reflected from an object situated at the position [ xo , yo ] can be found at the time delay τi = (r T + r Ri )/v in the measured impulse response Ri (τ ). One observation determines an ellipse around the transmitter-receiver pair. In order to focus the image, observations from different positions must be fused. Conventional migrations propose to fuse the observations by a simple summation o ( xo , yo ) =
1 N Ri (τi ) N i∑ =1
(17)
Localization and Object Cooperative Localization and ObjectCooperative Recognition in Autonomous UWB Sensor Networks
Recognition in Autonomous UWB Sensor Networks 47 225
Object
Object Rxref
[x0,y0] rT Tx [xT,yT]
y
rRref
[xRi,yRi] rR1
rT Tx
Rx [x ,y ] R2 R2 [xR1,yR1]
[xT,yT]
y
[xRi,yRi] rR1
Rx [xR1,yR1]
[xR2,yR2]
x Non-zero cross-correlation between Rxi and reference receiver Rxref
x
(a) Kirchhoff migration
(b) Cross-correlated imaging
Figure 50. Principle of imaging algorithms.
where N is the number of observations available for the data fusion. A disadvantage of this fusion is indicated in Fig. 50 (a). The signal energy does not only cumulate at the desired pixel. Other local maxima arise at every position where ellipses are crossing. Moreover, the elliptical traces are added to the focused image as well. Both effects decrease the image quality. In [73] we have proposed a data fusion method which reduces these artifacts and enhances the image quality. The algorithm is based on the cross-correlation of multiple observations. The spatial scheme for the cross-correlation algorithm is indicated in Fig. 50 (b). The observation from the reference receiver Rxre f is cross-correlated with each observation of the moving receiver. The cross-correlation results in non-zero values only at positions where the ellipse related to the reference receiver crosses the ellipse related to the moving receiver. The non-zero values which result from the cross-correlation are summed by the data fusion algorithm according to o ( xo , yo ) =
T/2 �
1 N Ri (τi + ζ ) Rre f (τre f + ζ )dζ N i∑ =1− T/2
(18)
where τre f = (r T + r Rre f )/v is the time delay which is related to the echo measured by the reference receiver, and T is the pulse duration of the autocorrelation function of the stimulation signal. In order to improve image quality, the number of reference receivers can be increased. The performance of this imaging algorithm strongly depends on the spatial arrangement of the cross-correlated receivers. If the arrangement of the receivers is disadvantageously chosen, the performance of this algorithm tends toward the conventional migration described by (17). If the spatial arrangement is selected in an optimum way the performance of the cross-correlated imaging outperforms the conventional algorithm. In order to illustrate the differences between the conventional and the cross-correlated algorithm, data simulated by the ray tracing algorithm [60] were used for the data fusion. The simulated scenario consisted of a sensor node which moved through a rectangular room of size 8 m by 9 m. The inspected room contained seven objects, namely, one large distributed object (some meters) and six smaller objects (decimeters). The sensor node had one transmitting and two receiving antennas and operated in the frequency band from 4.5 GHz to 13.4 GHz. The antennas were directional, therefore, the moving sensor scanned the room by a full turn at selected positions. Almost 10 thousand impulse responses were simulated for this scenario. Figure 51 (a) shows the result obtained by the conventional migration algorithm. The focused image contains intersecting ellipses. However, as indicated before, the intersections are not exclusively at the target positions. The ellipses also intersect at positions where no target
226 Ultra-Wideband Radio Technologies for Communications, Localization and Sensor Applications 48
Will-be-set-by-IN-TECH
0
0
1
1
2
2
3
3 Y−direction [m]
Y−direction [m]
is situated and even traces of these ellipses make the interpretation of the image difficult. Figure 51 (b) illustrates the image of the same scenario obtained by the cross-correlated algorithm. The color scaling of both images in Fig. 51 (a) and (b) is the same. The reduction of image artifacts by means of the cross-correlated algorithm is evident. Elliptical traces were significantly reduced. This helps to identify the inspected environment in this figure more clearly. A more detailed discussion on the cross-correlated imaging with measurement examples is given in [74] and [75].
4 5
4 5
6
6
7
7
8 9
8
0
1
2
3
4 5 X−direction [m]
6
(a) Range migration
7
8
9
0
1
2
3
4 5 X−direction [m]
6
7
8
(b) Cross-correlated imaging
Figure 51. Imaging in sensor networks.
8.2. Stationary target detection in an unknown indoor environment Indoor stationary object detection in an unknown environment is important for many civilian and military applications, such as indoor surveillance, search and rescue operations, logistics, security and so on. Compared with target detection in a known environment, it presents some challenges: • The detection takes place in an unknown environment (e.g. an environment after disaster). Thus, it is not possible to probe the environment before the presence of target. A range of techniques based on “a priori” information of the background cannot be utilized (e.g. [41, 64]). Additionally, the statistical distributions of clutter and noise are sometimes unknown, leading to further complications in the detector design. • The targets concerned are stationary with respect to the background. There is no distinct speed difference between the targets and the background. Hence, it prevents the application of the motion-based detection techniques, such as Doppler based approaches, subtraction (or cancellation) between sequence snapshots, etc [58]. • It is a highly cluttered environment. The targets (objects of interest) are typically surrounded by clutter (objects, which are not of interest, as shown in Fig. 52). In this case, the response of targets is not always stronger than clutter. In other words, the Signal to Interference and Noise Ratio (SINR) of the system is not always high enough to ensure a reliable detection. 8.2.1. Signal enhancement Due to the challenges mentioned above, a possible detection scheme is given in Fig. 53. In the scheme, the objective of the first step, "signal enhancement" which is realized by a “time-shift & accumulation” operation, is to raise the SINR of system, and to transform the unknown environment into a Gaussian clutter and noise environment so that the detector could be
Localization and Object Cooperative Localization and ObjectCooperative Recognition in Autonomous UWB Sensor Networks
Recognition in Autonomous UWB Sensor Networks 49 227
RM Down Converter
Rm
Clutter
LL
R2
Cj
R1 Ll wall
T1
Tn
Oi
TN Target
L1
Figure 52. Measurement configuration. T1 ...Tn ...TN are different transmission positions on the track Ll . “R1 ...R M ” are sparsely spaced receivers with different reception angles. The dashed curve is an ellipse segment with the foci Rm and Tn . Unknown environment Signal Enhancement (time-shift & accumulation)
Gaussian clutter and noise Stationary Target detection Detector design based on reflection characteristic deviations
Figure 53. Flow chart of the algorithm .
designed based on Gaussian clutter and noise. Mathematically, the “time-shift & accumulation” operation is described as N
di f f
∑ sRm,Tn (t + tTn,T1 )
(19)
n =1
where s Rm,Tn (t) is the signal received by the receiver Rm with respect to the transmission di f f
position Tn , and t Tn,T1 = |Tn − T1 | /c is the time-delay to be compensated for. Tn and T1 are the position vectors of Tn and reference transmission position T1 , respectively. In the operation, • the responses of the objects (Oi ) in the direction of interest (for example the direction of Ll in Fig. 52, are time-shifted, aligned and then accumulated. It is a coherent operation di f f
in which the parameter t Tn,T1 is used for time-delay correction. Hence, responses are enhanced by N times compared to the case of single channel data. • The responses of objects (Cj ) out of the direction of interest, are non-uniformly time-shifted, disturbed and then accumulated. It is an incoherent operation. As a consequence, for a certain time-slot, the responses from objects located on different ellipses (or ellipsoids) are non-uniformly time-shifted and accumulated. Hence, these responses are attenuated compared to the output of the coherent operation above, [70].
228 Ultra-Wideband Radio Technologies for Communications, Localization and Sensor Applications 50
Will-be-set-by-IN-TECH
Figure 54. Measurement environment. R3 and R4 are placed behind the wall. Normalized Amplititude
fR4 fR3 fR2 fR1
R1 R2 R3 R4
1 0.8 0.6 0.4 3900
4000 4100 4200 Frequency Sampling Bins
4300
Figure 55. Measured spectrum-shift
8.2.2. The detection principle For a detection problem, generally, detection algorithms are designed based on the differences (or deviations) between the targets and the background (clutter, noise). The ability to distinguish objects depends on how much their properties (e.g. electromagnetic properties, motion properties) deviate from the properties of the background. For the concerned stationary target which has no speed differences relative to the environment it can be detected based on the reflection characteristic deviations between the target and the background. Here, we take a planar-surface target as an example to illustrate the principle of indoor stationary target detection. Consider a detection scenario as shown in Fig. 52 and Fig. 54. The transmitter moves along track Ll to probe the environment, and to enhance the signal. The target is a concrete brick-like object with a square plane-surface (50cm × 50cm). It is located at x = 24cm on the track Ll , with an orientation angle of 60◦ . The receivers R1 , R2 , R3 and R4 receive the scattered signals from the surroundings. They are located at different directions with respect to the target. The transmitter-target-receiver angles are 13.9◦ , 20.3◦ , 26.3◦ and 31.7◦ , respectively. The antennas of the transmitter and receivers are omnidirectional and horn antennas, respectively. The receivers R1 and R2 are in the same room with the target and the transmitter, while the receivers R3 and R4 are placed behind a 20cm-thick concrete wall. Theoretically, it can be proved that if the target is a planar-surface object with diffuse reflections, after passing through the down-converter and certain mathematical transforms, the received signals from different directions would have a spectrum-shift, which is given by Ω j,i = ωc (γ j,i − 1) under the illuminating geometry in Fig. 52. Here, the subscripts i and j are the indices of the receivers located at the different directions, ωc is the angular central frequency, and γ j,i is a parameter associated with the reflection angles, � (20) γ j,i ≈ 1 + sinθ Rj − sinθ Ri / (|Vbi | sinθbi )
Localization and Object Cooperative Localization and ObjectCooperative Recognition in Autonomous UWB Sensor Networks
Recognition in Autonomous UWB Sensor Networks 51 229
where, θ Ri and θ Rj are the reflection angles of the receiver Ri and R j ,respectively. Vbi is the bisector of the angle � Ri XT1 . θbi is the reflection angle of Vbi . According to this principle, stationary plane-surface objects can be detected. In practice, (20) is demonstrated in Fig. 55, where the spectra of receivers R1 -R4 are f −f γ −1 measured based on the scenario of Fig. 54. It can be shown that f Ri − f R1 ≈ γi,1 , where j,1 −1 R1 Rj
f Ri , f R j ∈ [ f R1 , f R2 , f R3 , f R4 ] are the frequencies at which the maximum amplitudes are located. The differences between f R1 - f R4 indicate the spectrum shifts between R1 , R2 , R3 and R4 , correspondingly.
8.2.3. Detection According to the principle discussed above, if we take the observation of R1 , s¯R1,Tn (τ ), as a reference signal, the observation of receiver R j can be given by s¯Rj,Tn (τ ) ≈ s¯R1,Tn (τ ) exp(− jγ j,1 τ ), where γ j,1 is determined by the illuminating geometry according to (20). Based on this relationship, if we consider the effects of unwanted contributions due to clutter c and noise n, the signal model for detection can be given as y = s¯ re f ⊗ K + c + n = x + c + n
(21)
where y is an NMN × 1 vector. NMN = M × N, where M and N are the numbers of receivers re f re f re f and transmission positions, respectively. x = s¯ re f ⊗ K, where s¯ re f = [s¯T1 , s¯Tn , ..., s¯TN ] T , re f
s¯Tn = s¯R1,Tn (τ ), and K = [1, exp(− jγ2,1 τ ), ..., exp(− jγ M,1 τ ] T . The symbol ⊗ denotes the Kronecker product. According to the Central Limit Theorem (CLT) of the probability theory, if a large number of clutter from different sources (scattered from different objects) is accumulated, the statistical distribution of the sum will approach a Gaussian distribution. As the scenario concerned takes place in a cluttered indoor environment which has many scatterers, we assume that the clutter c and the noise n can approach a Gaussian distribution due to the “time-delay & accumulation” operations given by (19). Hence, our detection problem simplifies to searching targets in Gaussian clutter and noise. We assume that the noise n and the clutter c are NMN × 1 independent zero-mean complex Gaussians with NMN × NMN known covariance matrices Mc+n = E[(c + n)(c + n) H ]. Mc+n is a positive semidefinite and Hermitian symmetric matrix [63]. The superscript H indicates conjugate transpose of a matrix. Based on the signal model above, a matched filter detector is given as 1 −1 re f ⊗ K) h = M− c+n x = Mc+n ( s¯
(22)
The probability of detection can be given as Pd = 1 − Φ( kth −Dh x ), and the probability of false alarms can be given as Pf = 1 − Φ( kDth ). Here, k th is the threshold for a likelihood �x 2 1 test and Φ( x ) = √1 −∞ e−t /2 dt. The parameter D is defined as D2 = x H M− c+n x = H
x2
2π
NMN E[(y−x)avH (y−x)] , where x2av is the average signal power of x. Generally, can be regarded as the SINR at the output of the detector [43].
x2av E[(y− x ) H (y− x )]
In terms of the Neyman-Pearson criterion, the threshold k th could be set as k th = DΦ(1 − Pf ), and the detection probability can be given as Pd = 1 − Φ(Φ−1 (1 − Pf ) − D ).
230 Ultra-Wideband Radio Technologies for Communications, Localization and Sensor Applications 52
Will-be-set-by-IN-TECH
9. Detection and localization of moving objects In this section we describe methods for the detection and localization of several moving persons who do not have a tag or device attached to them. This is useful for applications where the targets being tracked are not expected to cooperate with the system. A single UWB sensor suffers from narrow-band interferences as well as shadowing when detecting multiple targets. Often, the closest target can be observed best. Due to shadowing caused by the closest target, the other targets are usually invisible, although they lie within the coverage of the sensor. The closest target attenuates the electromagnetic waves that propagate toward the targets located behind it. Thus, the shadowed targets are almost impossible to detect by a single sensor node. Using a distributed network of UWB radars, the estimated target positions are refined by fusing the information available from the multiple sensors which are able to detect the targets. It also allows for the observation of the targets from different viewing angles. A network of multiple static bat-type sensors distributed around the inspected area is used. Each bat-type sensor node is capable of autonomously detecting and localizing the present targets. The weak echoes of the targets are first detected in the backscattered signal, after which the detections are correctly assigned to the targets and finally, the target information from all sensors is fused together resulting in location estimates of the targets in the scenario. Here we describe two methods that can cope with this challenging task. The first one uses simplification assumptions of one target detection per sensor to combat the data association problem. It is described in Section 9.1. The second one is based on the probabilistic hypothesis density (PHD) filter for range estimation and position tracking and is described in more detail in Section 9.2. In both methods, background subtraction is used for target detection [9, 21, 38, 71]. The echoes evoked by the moving targets are usually weak and must be detected in the presence of other strong multipath signals. The disturbing signals are usually time invariant and overlay echoes from the target. Therefore, one received impulse response is insufficient to separate them. However, due to their time-invariance these background signals can be estimated by a suitable estimation technique from a sequence of received impulse responses. The subtraction of the estimated background from the measured data leads to a signal where the weak target echo can be recognized (see Fig. 56(b)) and its range can be estimated more easily. For the verification of the methods, a sensor network constellation as in Fig. 56(a) is used. Five UWB bat-type sensors are placed around a large foyer, and one bat-type sensor is placed behind one of the walls, directed towards the area of interest. Directional horn antennas with different size and quality are used, resulting in variable target detection performance between the sensors. A scenario with three moving persons was used. All three persons move in the area of interest during the whole measurement time. They move in a straight line from one wall to the opposite and back. The starting position of the targets is shown by a star in Fig. 56(a). The arrow signifies the direction of movement at the start of the measurement.
9.1. Low complexity method for the localization of multiple targets in sensor networks The method presented in this section was proposed as a computationally efficient method for the localization of multiple targets in dense sensor networks. Each target can be usually observed by at least one sensor node. As can be seen in Fig. 56(b), the closest target
Localization and Object Cooperative Localization and ObjectCooperative Recognition in Autonomous UWB Sensor Networks
Recognition in Autonomous UWB Sensor Networks 53 231 100 90
Sensor 3 6
Windows Sensor 6
80
Sensor 2 Transmitter
5
Y [m]
Receiver
4 3 2
Sensor 5
Time of Arrival [ns]
Receiver
7
70 60 50 40 30
1
Coridoor
Coridoor Sensor 1
0 −1
Sensor 4
20 10
Staircases −7 −6 −5 −4 −3 −2 −1
0
1
2
X [m]
(a)
3
4
5
6
7
8
5
10
15
20
25
30
35
40
45
Measurement time [s]
(b)
Figure 56. a) The verification scenario and b) the received impulse responses after background subtraction
to the sensor evokes the strongest echo, and almost completely shadows the other two targets when it is very close to the sensor. In order to simplify the localization algorithm, we make the assumption that each sensor node can observe only the closest target. This assumption allows the algorithms for multi-target detection such as the constant false alarm rate (CFAR) techniques [15], algorithms for data association, or multi-hypotheses tests to be skipped. This makes the proposed algorithm computationally efficient and suitable for real-time applications. On the other hand, this simplification restricts the number of targets that can be localized by the approach. A sensor network with N sensor nodes can localize up to N targets in real time. A more detailed description of this method is presented in [72]. 9.1.1. Single target range estimation After the time-invariant background signals have been removed from the received impulse response, the targets’ ranges need to be estimated. The distance from the transmitter to the target and back to the receiver is considered as target range. The target range of the closest target can be estimated by using one of the various threshold-based approaches where the leading edge of the received signal is detected [10–12, 22, 56]. Threshold-based approaches offer simple techniques which detect the leading edge of a received signal by comparing the received signal magnitude or energy with a predefined threshold. The choice of an appropriate threshold is mandatory for a good performance of this estimator. 9.1.2. Localization As in our scenario each sensor has two receivers, from each sensor node we have the estimated range of the closest target by the two receivers. The estimated ranges determine two ellipses whose focal points are determined by the locus of the transmitting antenna and the locus of the respective receiving antenna. The target position is determined as the intersection of the two ellipses within the area of detection of the respective sensor. The location estimates with respect to each of the six sensor nodes is shown in Fig. 57(a). Here, the estimates are represented by the same color as the respective sensor node.
232 Ultra-Wideband Radio Technologies for Communications, Localization and Sensor Applications 54 Sensor 6
Sensor 3
Sensor 2
6
7
5
6
4
5
3
4
2
Sensor 5
1 0 −1 −2 −3
Y−direction [m]
Y−direction
7
Will-be-set-by-IN-TECH
Transmitters
Receivers
Target 1
3
Target 2
2 1 0 −1 −2
Sensor 1
Sensor 4
Target 3
−3
−6
−4
−2
0 2 X−direction [m]
4
6
8
−6
(a)
−4
−2
0 2 X−direction [m]
4
6
8
(b)
Figure 57. The target position estimates a) by each sensor and b) after data fusion
9.1.3. Data fusion The location estimates from all sensor nodes must be fused together by an appropriate algorithm. We propose an imaging algorithm that does not require any data association. It creates a sampled image of the inspected area at a given time i which is stored in a matrix Pi . Each element of the matrix corresponds to the spatial coordinates within the inspected area. The image is updated according to Pi = αPi−1 + (1 − α)Ui
(23)
where Ui is the innovation matrix and α is the forgetting factor. Thus, the new image estimate Pi takes a fraction of the previous estimate Pi−1 and a fraction from the innovation matrix Ui . The innovation matrix Ui maps the location estimates of all sensor nodes. The matrix Pi indicates moving targets in the environment as hot spots within the image. An example of the data fusion is given in Fig. 57(b). It depicts one snapshot of the inspected area computed for a certain measurement time. Due to the exponential averaging each target appears in the snapshot like a "comet" with a tail. This tail indicates previous locations of the objects. Its length can be adjusted by adjusting the weighting factor α in Eqn. 23.
9.2. Localization and tracking of multiple targets in sensor networks based on the PHD filter Unlike the method presented in Section 9.1, this method uses the range information related to all targets detected by each sensor. Traditionally, multiple targets are tracked using two-step approaches: data association of the observations to targets followed by single target tracking on the associated data. The traditional approaches are generally computationally expensive, thus, we use a less computationally expensive alternative based on random finite sets (RFS) [36, 37]. It allows for tracking of time-variant number of unknown moving targets in the presence of false alarms, miss-detections and clutter. An approximation of the Bayesian multi-target tracking represented by RFSs, by its first order moment leads to the PHD filter [27]. There are two implementations of the PHD filter, one based on a sequential Monte Carlo approach [65], and the other based on Gaussian mixtures [66]. Here, we use the
Localization and Object Cooperative Localization and ObjectCooperative Recognition in Autonomous UWB Sensor Networks
Recognition in Autonomous UWB Sensor Networks 55 233
Gaussian mixture (GM) approach. We first use it for estimating the target ranges with respect to each sensor, and later for fusion of the target location estimates by all sensors. The method is explained in greater detail in [27]. 9.2.1. Multiple target range estimation In Fig. 58 we describe the processing done on a measured impulse response from raw measurement to range estimation. The impulse response presented is from a scenario with three moving targets. First the measured impulse response is shown in dark blue. As can be seen, the target echoes are non-detectable. After subtracting the time-invariant background (resulting signal shown in green) the echoes of the moving targets are detectable more easily. A Gaussian adaptive threshold constant false alarm rate (CFAR) method as in [15] is used for extracting the ranges from the resulting signal. The adaptive threshold calculated is shown in cyan. A Neyman-Pearson detector is used to discriminate between the noise and the target echo. The ranges extracted using the CFAR approach are shown as points in magenta. The CFAR detector is not immune to clutter noise and false detections. As we can see in Fig. 58, four targets are detected by the CFAR method although there are only three targets in the scenario. In addition, there are also multiple detections per target, making it difficult to decide if there are multiple targets in the vicinity of each other, or it is only a single target. By using a GM-PHD filter we improve the target range estimates. The ranges extracted by the CFAR method are used as observations for the PHD filter, and a linear Gaussian model is assumed. The target detection and survival probability are assumed to be state independent. To estimate the number of targets and their states, first the Gaussian terms with low weights are pruned and the Gaussian terms that are within a small distance of each other are merged together. The number of targets is estimated by the number of Gaussian terms with a weight above a predefined threshold, and their state is represented by the mean terms of these Gaussian mixtures. The surviving Gaussian terms for the impulse response given in Fig. 58 are shown in black. 9.2.2. Target localization As in Section 9.1.2, the target locations are computed using the ranges estimated by the two receivers of the sensor. As multiple targets are detected by each receiver, the range estimates from both receivers corresponding to the same target need to be associated. An intersection threshold Ts is defined for each sensor. The ranges of a target in the inspected area with respect to both receivers of a sensor s are first calculated as rks,1 and rks,2 . The intersection threshold is then defined as the maximum possible absolute difference between these ranges such that the target lies in the area of interest. Ts = max |rks,1 − rks,2 | k∈ A
(24)
As the size of the inspected area is known or approximated by the sensor detection range, the intersection threshold is calculated prior to scanning the environment. The range association is done such that for each range estimate from the first receiver, we associate the range estimate from the second receivers which satisfies
|rks,1 − rks,2 | < Ts
(25)
234 Ultra-Wideband Radio Technologies for Communications, Localization and Sensor Applications 56
Will-be-set-by-IN-TECH
Normalized measured impulse response 1
0
−1
Normalized magnitude after background subtraction
1
0.5
0
Target range estimates
1
0.5
0
0
20
40 60 Time of flight [ns]
80
100
Figure 58. Target echo detection - measured impulse response (blue), normalized signal magnitude after background subtraction (green), CFAR test statistic (red), CFAR adaptive threshold (cyan), indices of detected targets by CFAR (magenta) and Gaussian mixtures representing the estimated target ranges (black) are shown
as a range estimate that corresponds to the same target. When multiple range estimates comply with this rule, the range estimate which results in the smallest absolute difference is chosen. The target location is analytically calculated as the intersection of the ellipses defined by the associated range estimates. The location estimates with respect to each of the six sensor nodes is shown in Fig. 59(a), where the estimates are represented by the same color as the respective sensor node. 7
7
Sensor 3 6
Sensor 3
Sensor 2
Sensor 6
6 5
4
Y [m]
Y [m]
5
3
4 3 2
2
Sensor 5
Sensor 5 1
1
0
0 −1
Sensor 2
Sensor 6
Sensor 1
Sensor 4 −7 −6 −5 −4 −3 −2 −1
0
1
2
3
4
X [m]
(a)
5
6
7
−1
8
Sensor 1
Sensor 4 −7 −6 −5 −4 −3 −2 −1
0
1
2
3
4
5
6
7
8
X [m]
(b)
Figure 59. a)The target position estimates by each sensor and b) the target tracks after data fusion
9.2.3. Data fusion and target tracking The location estimates from all sensors are fused together resulting in a single target location per target. The estimated target locations are not in a track form and contain a significant
Localization and Object Cooperative Localization and ObjectCooperative Recognition in Autonomous UWB Sensor Networks
Recognition in Autonomous UWB Sensor Networks 57 235
amount of noise due to small errors in the range estimation. A simplified GM-PHD filter is applied for fusing the target location estimates from all sensors. The location estimates are used to form the observation RFS for the GM-PHD filter. The target state is defined by the 2D target coordinates and velocity vector, x = [ x x˙ y y˙ ] T . The targets are identified using nearest neighbor association, and the results for the three-target scenario can be seen in Fig. 59(b). Both methods presented in this section can be used for the localization of multiple non-cooperative targets using distributed UWB sensor network with static sensors as in the scenario described in Section 2.1 .
10. Conclusion The CoLOR project was devoted to the recognition of unknown environments using UWB technology. This topic encompasses a number of partial challenges. In order to obtain a complex picture of some catastrophic scenario, like the detection of victims after some natural disasters, their location in collapsed buildings, the geometrical information and the status of the buildings, we derived new detection, localization and imaging algorithms. Their performance was analyzed on simulated data and data measured in realistic scenarios using UWB sensors. These UWB sensors are capable of real-time operation in MIMO configuration. This allows us to analyze the application of UWB sensor networks and cooperative approaches for the localization of sensor nodes within the network, for the localization of people, for the detection and monitoring of their live signs, and for the imaging of their surroundings. It was shown that by using a mobile UWB radar with multiple antennas, it is possible in an efficient way to reconstruct the basic layout of rooms and the position of freestanding objects. The detected features are added to a map while at the same time the own position is estimated (SLAM). To minimize the computational cost and the number of measurements needed, simplified models for wave propagation and stochastic, dynamic state space estimators where enhanced. The method of data association proved to be most critical regarding the precision and reliability of the map. Using this map as a-priori information, the detection, localization and the imaging of the objects within an indoor scenario can be performed using the developed localization and imaging algorithms. By knowing the location of the individual objects, the potential of UWB radar was fully tapped by obtaining super-resoluted local information about 2D as well as 3D complex objects (concerning the outer contour). The interior of objects was gathered by novel algorithms which are based on exact radiation patterns depending on the permittivity of the medium while showing low computational load. The obtained radar images are post-processed by means of object recognition algorithms designed for full, fragmented or restricted illumination to provide recognition of the object under test from a finite alphabet. By the adaption of classical ellipsometry to the UWB-range, an estimation of dielectric surface properties can robustly be performed even for small dimensioned objects with a size of a couple of wavelengths. In addition polarimetric measurements as well as polarimetric data processing were taken into account to obtain object features which may remain invisible in mono polarized systems. In order to test and compare different algorithms and antenna arrangements for indoor UWB sensing and imaging, a realistic UWB multi-path propagation simulation tool was developed. The propagation model is based on a hybrid approach which combines the deterministic ray tracing method (based on geometrical optics and the uniform theory of diffraction)
236 Ultra-Wideband Radio Technologies for Communications, Localization and Sensor Applications 58
Will-be-set-by-IN-TECH
with statistically distributed scatterers. Verification measurements show that the new model delivers very realistic channel parameters like channel impulse response, azimuth spectra, and path loss. Thus, it is suitable for an application in UWB system simulations. Further within CoLOR a flexible and dual-polarized UWB antenna array has been developed. The major challenges beside the huge bandwidth itself were to design antenna elements which are able to meet the requirements regarding size, pattern, beam-width, polarization and the location of the phase center (over frequency). Via switches it is possible to select and control the single elements of this array, which allows its adaption to the different localization, imaging and object recognition algorithms and applications in this project. Due to the dual polarized antenna elements, the possibility to take advantage of polarization diversity is given and demonstrated. Our results show that the UWB technology and especially the cooperative approach that fuses diverse information from multiple sensors provide a big potential for safety, security and emergency applications.
Author details Rudolf Zetik, Honghui Yan, Elke Malz, Snezhana Jovanoska, Guowei Shen and Reiner S. Thomä Ilmenau University of Technology, Germany Rahmi Salman, Thorsten Schultze, Robert Tobera and Hans-Ingolf Willms University Essen-Duisburg, Germany Lars Reichardt, Malgorzata Janson, Thomas Zwick and Werner Wiesbeck Karlsruhe Institute of Technology (KIT), Germany Tobias Deißler and Jörn Thielecke Friedrich-Alexander University Erlangen-Nürnberg, Germany
11. References [1] Adamiuk, G., Beer, S., Wiesbeck, W. & Zwick, T. [2009]. Dual-orthogonal polarized antenna for UWB-IR technology, Antennas and Wireless Propagation Letters, IEEE 8: 981 –984. [2] Adamiuk, G., Janson, M., Wiesbeck, W. & Zwick, T. [2009]. Dual-polarized UWB antenna array, IEEE International Conference on Ultra-Wideband, ICUWB’09, Vancouver, Canada, pp. 159–163. [3] Adamiuk, G., Zwick, T. & Wiesbeck, W. [2008]. Dual-orthogonal polarized vivaldi antenna for ultra wideband applications, 17th International Conference on Microwaves, Radar and Wireless Communications, 2008. MIKON. [4] Araujo, E. G. & Grupen, R. [1998]. Feature detection and identification using a sonar-array, In Proceedings of the IEEE International Conference on Robotics and Automation, IEEE Computer Society Press, pp. 1584–1589. [5] Balanis, C. A. [1996]. Antenna Theory: Analysis and Design, New York: Wiley. [6] Blech, M. & Eibert, T. [2007]. A dipole excited ultrawideband dielectric rod antenna with reflector, Antennas and Propagation, IEEE Transactions on 55(7): 1948 –1954. [7] Borras, J., Hatrack, P. & Mandayam, N. B. [1998]. Decision theoretic framework for NLOS identification, Proc. 48th IEEE Vehicular Technology Conf. VTC 98, Vol. 2, pp. 1583–1587.
Localization and Object Cooperative Localization and ObjectCooperative Recognition in Autonomous UWB Sensor Networks
Recognition in Autonomous UWB Sensor Networks 59 237
[8] Cramer, R.-M., Scholtz, R. & Win, M. [2002]. Evaluation of an ultra-wide-band propagation channel, IEEE Transactions on Antennas and Propagation 50(5): 561–570. [9] Daniels, D. J. (ed.) [2004]. Ground penetrating radar (2nd Edition), Vol. 15 of IEE radar, sonar, navigation, and avionics series, Institution of Electrical Engineers, London, UK. [10] Dardari, D., Chong, C.-C. & Win, M. Z. [2006]. Analysis of threshold-based TOA estimator in UWB channels, Proc. Eur. Signal Process. Conf. (EUSIPCO), Florence, Italy. [11] Dardari, D., Chong, C.-C. & Win, M. Z. [2008]. Threshold-based time-of-arrival estimators in UWB dense multipath channels, IEEE Transactions on Communications 56(8): 1366–1378. [12] Dardari, D. & Win, M. Z. [2006]. Threshold-based time-of-arrival estimators in UWB dense multipath channels, Proc. IEEE International Conference on Communications, Vol. 10, pp. 4723–4728. [13] Deissler, T., Salman, R., Schultze, T., Thielecke, J. & Willms, I. [2010]. UWB radar object recognition for slam, Proceedings of the 11th International Radar Symposium, pp. 378–381. [14] des Noes, M. & Denis, B. [2012]. Benefits from cooperation in simultaneous anchor-less tracking and room mapping based on impulse radio - ultra wideband devices, 19th International Conference on Systems, Signals and Image Processing, IWSSIP 2012. [15] Dutta, P., Arora, A. & Bibyk, S. [2006]. Towards radar-enabled sensor networks, Information Processing in Sensor Networks, 2006. IPSN 2006. The Fifth International Conference on, pp. 467 –474. [16] Elsherbini, A., Zhang, C., Lin, S., Kuhn, M., Kamel, A., Fathy, A. & Elhennawy, H. [2007]. UWB antipodal vivaldi antennas with protruded dielectric rods for higher gain, symmetric patterns and minimal phase center variations, Antennas and Propagation Society International Symposium, 2007 IEEE, pp. 1973 –1976. [17] Falsi, C., Dardari, D., Mucchi, L. & Win, M. Z. [2006]. Time of arrival estimation for UWB localizers in realistic environments, EURASIP Journal on Applied Signal Processing 2006: 1–13. URL: http://www.hindawi.com/journals/asp/2006/032082.abs.html [18] Fügen, T., Maurer, J., Kayser, T. & Wiesbeck, W. [2006]. Capability of 3-D ray tracing for defining parameter sets for the specification of future mobile communications systems, IEEE Transactions on Antennas and Propagation 54(11): 3125–3137. [19] Gezici, S. [2008]. A survey on wireless position estimation, Wireless Personal Communications 44: 263–282. URL: http://www.springerlink.com/content/w1481x761266m417 [20] Gezici, S. & Poor, H. [2009]. Position estimation via ultra-wide-band signals, Proceedings of the IEEE 97(2): 386 –403. [21] Gezici, S., Tian, Z., Giannakis, G., Kobayashi, H., Molisch, A., Poor, H. & Sahinoglu, Z. [2005]. Localization via ultra-wideband radios: a look at positioning aspects for future sensor networks, 22(4): 70 – 84. [22] Guvenc, I. & Sahinoglu, Z. [2005]. Threshold-based TOA estimation for impulse radio UWB systems, Proc. IEEE International Conference on Ultra-Wideband ICU 2005, pp. 420–425. [23] Janson, M., Fügen, T., Zwick, T. & Wiesbeck, W. [2009]. Directional channel model for ultra-wideband indoor applications, IEEE International Conference on Ultra-Wideband, ICUWB’09, Vancouver, Canada. [24] Janson, M., P., J., Zwick, T. & Wiesbeck, W. [2010]. Directional hybrid channel model for ultra-wideband MIMO systems, 4th European Conference on Antennas and Propagation, EuCAP’10.
238 Ultra-Wideband Radio Technologies for Communications, Localization and Sensor Applications 60
Will-be-set-by-IN-TECH
[25] Janson, M., Pontes, J., Fügen, T. & Zwick, T. [2012]. A hybrid deterministic-stochastic propagation model for short-range MIMO-UWB communication systems, accepted for publication in Frequenz, Journal of RF-Engineering and Telecommunications . [26] Jemai, J., Eggers, P., Pedersen, G. & Kurner, T. [2009]. Calibration of a UWB sub-band channel model using simulated annealing, IEEE Transactions on Antennas and Propagation 57(10): 3439 –3443. [27] Jovanoska, S. & Thomä, R. [2012]. Multiple target tracking by a distributed UWB sensor network based on the PHD filter, Proc. 15th Int. Conf. Information Fusion (FUSION), Singapore, Singapore. submitted for publication. [28] Kidera, S., Sakamoto, T. & Sato, T. [2010]. Accurate UWB radar three-dimensional imaging algorithm for a complex boundary without range point connections, Geoscience and Remote Sensing, IEEE Transactions on 48(4): 1993 –2004. [29] Kmec, M., Sachs, J., Peyerl, P., Rauschenbach, P., Thomä, R. & Zetik, R. [2005]. A novel Ultra-wideband real-time MIMO channel sounder architecture, XXVIIIth URSI General Assembly, New Delhi, India. [30] Li, J. & Stoica, P. (eds) [2008]. MIMO radar signal processing, Hoboken, NJ: Wiley. [31] Li, X. & Pahlavan, K. [2004]. Super-resolution TOA estimation with diversity for indoor geolocation, IEEE Transactions on Wireless Communications 3(1): 224–234. [32] Loeffler, A., Wissendheit, U., Gerhaeuser, H. & Kuznetsova, D. [2010]. A multi-purpose rfid reader supporting indoor navigation systems, IEEE International Conference on RFID-Technology and Applications (RFID-TA) 1: 43–48. [33] Lostanlen, Y. & Gougeon, G. [2007]. Introduction of diffuse scattering to enhance ray-tracing methods for the analysis of deterministic indoor UWB radio channels, International Conference on Electromagnetics in Advanced Applications, ICEAA’07, pp. 903–906. [34] Lostanlen, Y., Gougeon, G., Bories, S. & Sibille, A. [2006]. A deterministic indoor UWB space-variant multipath radio channel modelling compared to measurements on basic configurations, First European Conference on Antennas and Propagation, EuCAP’06, pp. 1–8. [35] Mackworth, S. & Mokhtarian, F. [1988]. The renormalized curvature scale space and the evolution properties of planar curves, Computer Vision and Pattern Recognition, 1988. Proceedings CVPR ’88., Computer Society Conference on, pp. 318 –326. [36] Mahler, R. [2003]. Multitarget Bayes filtering via first-order multitarget moments, 39(4): 1152–1178. [37] Mahler, R. P. S. [2001]. Random set theory for target tracking and identification, Handbook of Mutlisensor Data Fusion, CRC Press, London, p. 14. [38] McIvor, A. M., Zang, Q. & Klette, R. [2001]. The background subtraction problem for video surveillance systems, RobVis, pp. 176–183. [39] Meissner, P. & Witrisal, K. [2012]. Multipath-assisted single-anchor indoor localization in an office environment, 19th International Conference on Systems, Signals and Image Processing, IWSSIP 2012. [40] Molisch, A., Kuchar, A., Laurila, J., Hugl, K. & Bonek, E. [1999]. Efficient implementation of a geometry-based directional model for mobile radio channels, IEEE VTS 50th Vehicular Technology Conference, 1999. VTC 1999 - Fall 3: 1449–1453. [41] Moura, J. M. F. & Jin, Y. [2008]. Time reversal imaging by adaptive interference canceling, IEEE Transactions on Signal Processing 56(1): 233–247. [42] Nasr, K. [2008]. Hybrid channel modelling for ultra-wideband portable multimedia applications, Microwaves, Antennas & Propagation, IET 2(3): 229–235. [43] Poor, H. V. [1994]. An introduction to signal detection and estimation, Chapter III, 2nd edn, Springer-Verlag.
Localization and Object Cooperative Localization and ObjectCooperative Recognition in Autonomous UWB Sensor Networks
Recognition in Autonomous UWB Sensor Networks 61 239
[44] Porebska, M., Adamiuk, G., Sturm, C. & Wiesbeck, W. [2007]. Accuracy of algorithms for UWB localization in NLOS scenarios containing arbitrary walls, 2nd European Conference on Antennas and Propagation, EuCAP’07, Edinburgh, UK. [45] Reichardt, L., Kowalevski, J., Zwirello, L. & Zwick, T. [2012]. Compact, teflon embedded, dual-polarized ultra wideband (UWB) antenna, accepted for pulicatiob on IEEE, Antennas and Propagation Society International Symposium. [46] Ren, Y.-J. & Tarng, J.-H. [2007]. A hybrid spatio-temporal model for radio propagation in urban environment, 2nd European Conference on Antennas and Propagation, EuCAP’07, Edinburgh, UK. [47] Sachs, J., Peyerl, P., Zetik, R. & Crabbe, S. [2003]. M-sequence ultra-wideband-radar: state of development and applications, International Radar Conference, Adelaide, Australia, pp. 224 – 229. [48] Salman, R. & Willms, I. [2010]. A novel UWB radar super-resolution object recognition approach for complex edged objects, Ultra-Wideband (ICUWB), 2010 IEEE International Conference on, Vol. 2, pp. 1 –4. [49] Salman, R. & Willms, I. [2011a]. 3d UWB radar super-resolution imaging for complex objects with discontinous wavefronts, Ultra-Wideband (ICUWB), 2011 IEEE International Conference on, pp. 346 –350. [50] Salman, R. & Willms, I. [2011b]. Super-resolution object recognition approach for complex edged objects by UWB radar, Object Registration, InTech. [51] Salman, R. & Willms, I. [2012]. Joint efficiency and performance enhancement of wavefront extraction algorithms for short-range super-resolution UWB radar, Microwave Conference (GeMiC), 2012 The 7th German, pp. 1 –4. [52] Salman, R., Willms, I., Reichardt, L., Zwick, T. & Wiesbeck, W. [2012]. On polarization diversity gain in short range UWB-radar object imaging, 2012 IEEE International Conference on Ultra-Wideband (ICUWB). [53] Seitz, J., Vaupel, T., Jahn, J., Meyer, S., Boronat, J. G. & Thielecke, J. [2010]. A hidden markov model for urban navigation based on fingerprinting and pedestrian dead reckoning, Information Fusion (FUSION), 2010 13th Conference on, IEEE, pp. 1–8. [54] Shen, G., Zetik, R., Hirsch, O. & Thomä, R. S. [2010]. Range-based localization for UWB sensor networks in realistic environments, EURASIP Journal on Wireless Communications and Networking pp. 1–9. URL: http://www.hindawi.com/journals/wcn/2010/476598.html [55] Shen, G., Zetik, R. & Thomä, R. S. [2008]. Performance comparison of TOA and TDOA based location estimation algorithms in LOS environment, Proc. 5th Workshop on Positioning, Navigation and Communication (WPNC 2008), Hannover, pp. 71–78. [56] Shen, G., Zetik, R., Yan, H., Hirsch, O. & Thomä, R. S. [2010]. Time of arrival estimation for range-based localization in UWB sensor networks, 2010 IEEE International Conference on Ultra-Wideband (ICUWB 2010), Nanjing, China. [57] Shen, G., Zetik, R., Yan, H., Jovanoska, S. & Thomä, R. S. [2011]. Localization of active UWB sensor nodes in multipath and NLOS environments, the 5th European Conference on Antennas and Propagation (EUCAP 2011), Rome, Italy. [58] Skolnik, M. (ed.) [2002]. Introduction to Radar Systems, 3rd ed edn, Mc Graw-Hill. [59] Sörgel, W., Waldschmidt, C. & Wiesbeck, W. [2003]. Transient responses of a vivaldi antenna and a logarithmic periodic dipole array for ultra wideband communication, IEEE, Antennas and Propagation Society International Symposium. [60] Sturm, C., Sörgel, W., Knorzer, S. & Wiesbeck, W. [2006]. An adequate channel model for ultra wideband localization applications, Antennas and Propagation Society International Symposium 2006, IEEE, pp. 2140 –2143.
240 Ultra-Wideband Radio Technologies for Communications, Localization and Sensor Applications 62
Will-be-set-by-IN-TECH
[61] Thomä, R. S., Hirsch, O., Sachs, J. & Zetik, R. [2007]. UWB sensor networks for position location and imaging of objects and environments, Proc. Second European Conf. Antennas and Propagation EuCAP 2007, pp. 1–9. [62] Thrun, S., Burgard, W. & Fox, D. [2001]. Probabilistic Robotics (Intelligent Robotics and Autonomous Agents), The Mit Press. [63] van den Bos, A. [1995]. The multivariate complex normal distribution-a generalization, IEEE Transactions on Information Theory 41(2): 537–539. [64] Varslot, T., Yazici, B., Yarman, C.-E., Cheney, M. & Scharf, L. [2007]. Time-reversal waveform preconditioning for clutter rejection, Proc. Int. Waveform Diversity and Design Conf, pp. 330–334. [65] Vo, B.-N., Singh, S. & Doucet, A. [2003]. Sequential Monte Carlo Implementation of the PHD filter for Multi-target Tracking, Proc. 6th Int. Conf. Information Fusion (FUSION), Vol. 2, Cairns, Australia, pp. 792–799. [66] Vo, B.-N. V. & Ma, W.-K. [2006]. The Gaussian Mixture Probability Hypothesis Density Filter, 54(11): 4091–4104. [67] Win, M. & Scholtz, R. [2002]. Characterization of ultra-wide bandwidth wireless indoor channels: a communication-theoretic view, Selected Areas in Communications, IEEE Journal on 20(9): 1613 – 1627. [68] Wylie, M. P. & Holtzman, J. [1996]. The non-line of sight problem in mobile location estimation, Proc. 5th IEEE Int Universal Personal Communications Record. Conf, Vol. 2, pp. 827–831. [69] Yan, H., Shen, G., Zetik, R., Hirsch, O. & Thomä, R. S. [2012]. Ultra-wideband MIMO ambiguity function and its factorability. IEEE Trans. Geosci. Remote Sensing, to be published. DOI: 10.1109/TGRS.2012.2201486. [70] Yan, H., Shen, G., Zetik, R., Malz, E., Jovanoska, S. & Thomä, R. S. [2011]. Stationary symmetric object detection in unknown indoor environments, Loughborough Antennas & Propagation Conference 2011, LAPC 2011). [71] Yarovoy, A. G., van Genderen, P. & Ligthart, L. P. [2000]. Ground penetrating impulse radar for land mine detection, in D. A. Noon, G. F. Stickley, & D. Longstaff (ed.), Society of Photo-Optical Instrumentation Engineers (SPIE) Conference Series, Vol. 4084 of Society of Photo-Optical Instrumentation Engineers (SPIE) Conference Series, pp. 856–860. [72] Zetik, R., Jovanoska, S. & Thomä, R. [2011]. Simple method for localisation of multiple tag-free targets using UWB sensor network, 2011 IEEE Int. Conf. Ultra-Wideband (ICUWB), pp. 268 –272. [73] Zetik, R., Sachs, J. & Thomä, R. [2005]. Modified cross-correlation back projection for UWB imaging: numerical examples, Ultra-Wideband, 2005. IEEE International Conference on, p. 5. [74] Zetik, R. & Thomä, R. [2008]. Monostatic imaging of small objects in UWB sensor networks, Ultra-Wideband, 2008. IEEE International Conference on, Vol. 2, pp. 191 –194. [75] Zetik, R. & Thomä, R. S. [2010]. Imaging of Distributed Objects in UWB Sensor Networks, in Sabath, F., Giri, D. V., Rachidi, F., & Kaelin, A. (ed.), Ultra-Wideband, Short Pulse Electromagnetics 9, Springer New York, pp. 97–104. [76] Zhan, H., Ayadi, J., Farserotu, J. & Le Boudec, J.-Y. [2009]. Impulse radio ultra-wideband ranging based on maximum likelihood estimation, IEEE Transactions on Wireless Communications 8(12): 5852–5861.