Dynamic Bandwidth Sharing in a DBMS. Marcin Zukowski, Sándor Héman, Niels
Nes, Peter Boncz.
. Centrum voor Wiskunde en ...
Cooperative Scans: Dynamic Bandwidth Sharing in a DBMS Marcin Zukowski, Sandor Heman, Niels Nes, Peter Boncz ´ ´
[email protected] Centrum voor Wiskunde en Informatica Kruislaan 413, 1098 SJ Amsterdam, The Netherlands ABSTRACT This paper analyzes the performance of concurrent (index) scan operations in both record (NSM/PAX) and column (DSM) disk storage models and shows that existing scheduling policies do not fully exploit data-sharing opportunities and therefore result in poor disk bandwidth utilization. We propose the Cooperative Scans framework that enhances performance in such scenarios by improving data-sharing between concurrent scans. It performs dynamic scheduling of queries and their data requests, taking into account the current system situation. We first present results on top of an NSM/PAX storage layout, showing that it achieves significant performance improvements over traditional policies in terms of both the number of I/Os and overall execution time, as well as latency of individual queries. We provide benchmarks with varying system parameters, data sizes and query loads to confirm the improvement occurs in a wide range of scenarios. Then we extend our proposal to a more complicated DSM scenario, discussing numerous problems related to the two-dimensional nature of disk scheduling in column stores.
1.
INTRODUCTION
In traditional database research disk scans were mostly considered trivial, and simple LRU or MRU buffering policies were proposed for them [6, 23]. We show that if scans start at different times, these policies achieve only a low amount of buffer reuse. To improve this situation, some systems support the concept of circular scans [9, 10, 20, 14] which allows queries that start later to attach themselves to already active scans. As a result, the disk bandwidth can be shared between the queries, resulting in a reduced number of I/O requests. However, this strategy is not efficient when queries process data at different speeds or a query scans only a range instead of a full table. In this paper we analyze the performance of existing scan strategies, identifying three basic approaches: normal, attach and elevator. In normal, a traditional LRU buffering
Permission to copy without fee all or part of this material is granted provided that the copies are not made or distributed for direct commercial advantage, the VLDB copyright notice and the title of the publication and its date appear, and notice is given that copying is by permission of the Very Large Data Base Endowment. To copy otherwise, or to republish, to post on servers or to redistribute to lists, requires a fee and/or special permission from the publisher, ACM. VLDB ‘07, September 23-28, 2007, Vienna, Austria. Copyright 2007 VLDB Endowment, ACM 978-1-59593-649-3/07/09.
723
policy is employed, while in both attach and elevator incoming queries can join an ongoing scan in case there is overlap in data need, with the main difference that elevator employs a single, strictly sequential scan cursor, while attach allows for multiple (shared) cursors. Benchmarks show that they provide sharing of disk bandwidth and buffer space only in a limited set of scenarios. This is mostly caused by the fact that the disk access order is predefined when a query enters the system, hence it can not be adjusted to optimize performance in dynamic multi-query scenarios. Scan
Scan
Scan
CScan
CScan
CScan
Active Buffer Manager
Buffer Manager
pages
chunk
Figure 1: Normal Scans vs Cooperative Scans To overcome these limitations, we introduce the Cooperative Scans framework, depicted in Figure 1. It involves CScan – a modified (index) Scan operator, that announces the needed data ranges upfront to an active buffer manager (ABM). The ABM dynamically optimizes the order of disk accesses, taking into account all current CScan requests on a relation (or a set of clustered relations). This framework can run the basic normal, attach and elevator policies, but also a new policy, relevance, that is central to our proposal. Besides optimizing throughput, the relevance policy also minimizes latency. This is done by departing from the strictly sequential access pattern as present in attach and elevator. Instead, relevance makes page load and eviction decisions based on per-page relevance functions, which, for example, try to evict pages with a low number of interested queries as soon as possible, while prioritizing page reads for short queries and pages that have many interested queries. To further illustrate the need for a more flexible approach to I/O scheduling, consider the following example. Assume a system has to execute two queries, Q1 and Q2 , which enter the system at the same time and process data at the same speed. Q1 needs to read 30 pages and is scheduled first, while Q2 needs 10 different pages. If those queries get serviced in a round-robin fashion, as in the normal policy, Q2 finishes after 20 pages are loaded, and Q1 after 40, giving an average query latency of 30. The elevator policy may perform better, by first fully servicing Q2 and then Q1 , reducing the average waiting time from 30 to 25. Still, elevator can choose the
opposite order, resulting in waiting times of 30 and 40, hence actually increasing the average time. With relevance, we aim to get close to the optimal average query latency, without relying on the sequential scan order, by making flexible I/O scheduling decisions. Contributions. We view our contributions as follows: (i) the definition of the Cooperative Scans framework, and the new relevance policy. (ii) experiments that help better understand the behavior of the existing normal, attach and elevator scheduling policies, and also show that the relevance policy outperforms them in a wide range of scenarios, both for row- and column-stores. (iii) showing that I/O scheduling for column-stores is significantly more complex than for row-storage; a characteristic that so far seems to have been overlooked. Outline. In Section 2 we motivate our research, arguing that efficiently handling (index) scans is an important topic and will become even more so in the future, given current hardware and application trends. Section 3 analyzes existing approaches to scan processing. In Section 4 we introduce the Cooperative Scans framework for row stores and we validate its performance in Section 5. In Section 6 we extend Cooperative Scans to column stores, that recently gained popularity. The incorporation of ABM into an existing DBMS is discussed in Section 7, where we also explore possibilities of adapting order-aware query processing operators to handle out-of-order data delivery. We discuss related work in Section 8 before concluding in Section 9.
2.
MOTIVATION
Database systems are addicted to random disk I/O, caused by unclustered index lookups, and hardware trends are pushing this model to the limit of sustainability. Foreign-key joins, as well as selection predicates executed using unclustered indices both may yield large streams of row-IDs for looking up records in a target table. If this target table is large and the accesses are scattered, the needed disk pages will have to be fetched using random disk I/O. To optimize performance, industry-strength RDBMSs make good use of asynchronous I/O to farm out batches of requests over multiple disk drives, both to achieve I/O parallelism between the drives, and to let each disk handle multiple I/Os in a single arm movement (amortizing some access latency). # CPU
processing
disks throughput RAM # totsize cost single 5-way
4 2 4 2
64GB 48GB 32GB 32GB
Xeon 3.0GHz dual-core Opteron 2GHz Xeon 3.0GHz dual-core Power5 1.65GHz dual-core
124 336 92 45
4.4TB 6.0TB 3.2TB 1.6TB
47% 80% 67% 65%
19497 12941 11423 8415
10404 11531 6768 4802
Table 1: Official 2006 TPC-H 100GB results Massive unclustered disk access occurs frequently in benchmarks like TPC-H, and it is not uncommon now to see benchmark configurations that use hundreds or thousands of disks. For example, Table 1 shows that the four most recent TPC-H submissions of even the smallest 100GB data size used an average 150 disks with total storage capacity of 3.8 terabyte. All these disks are less than 10% full, and the main reason for their high number is to get more disk-arms, allowing for a higher throughput of random I/O requests. Note from Table 1 that a high number of disks seems especially crucial in the concurrent (5 stream) query scenario.
724
The underlying hardware trends of the past decades, namely sustained exponential growth in CPU power as well as much faster improvement in disk-bandwidth than in I/O latency, are expected to continue. Thus, to keep each next CPU generation with more cores busy, the number of disks will need to be doubled to achieve system balance. This exponential trend is clearly unsustainable, and one can argue that in the real world (i.e. outside manufacturer benchmarking projects) it is already no longer being sustained, and database servers are often configured with fewer disks than optimal. The main reason for this is cost, both in terms of absolute value of large I/O subsystems (nowadays taking more than two thirds of TPC-H benchmark systems cost, see Table 1), but also maintenance costs. In a multithousand disk configuration, multiple disks are expected to break each day [25], which implies the need for full-time attendance by a human system administrator. Better Scanning. We argue that the only way to avoid random I/O is to rely more on (clustered index) scans, which depend on sequential disk bandwidth rather than latency. Modern data warehousing systems try to achieve this by: (1) storing relations redundantly in multiple orders [2], such that more query patterns can use a clustered access path. To avoid the costs of updating multiple such tables, updates in such systems are buffered in RAM in differential lists and are dynamically merged with persistent data. (2) exploiting correlated orderings. In MonetDB/X100, a min- and max-value is kept for each column per large disk block. Such meta-data, similar to “small materialized aggregates” [19] and also found e.g. in the Netezza system as “zonemaps” [21], allows avoiding reading unneeded blocks during an (index) scan, even if the data is not ordered on that column, but on a correlated column. For example, in the lineitem table in the TPC-H schema it allows avoiding I/O for almost all non-relevant tuples in range selections on any date column in the TPC-H schema, as dates in the fact tables of a data warehouse tend to be highly correlated. This technique can sometimes result in a scan-plan that requires a set of non-contiguous table ranges. (3) using multi-table clustering or materialized views, to exploit index range-scans even over foreign-key joins. (4) exploiting large RAMs to fully buffer small (compressed) relations, e.g. the dimensions of a star schema. (5) reducing scan I/O volume by offering column storage (DSM) as an option [33, 28] to avoid reading unused columns. The same remark as made in (1) on handling updates applies here. However, I/O scheduling in column stores can be significantly more complex, as shown in Section 6. (6) using lightweight compression, where the reduced I/O cost due to size reduction outweighs the CPU cost of decompression. It has been shown that with column storage, (de-)compression becomes less CPU intensive and achieves better compression ratios [33, 1]. (7) using on-disk processing for reducing disk-memory traffic and main-CPU load. For example, Netezza uses programmable FPGAs [21] to quickly perform selection on data before it gets to the main memory. After applying (1-2), data warehousing queries use (clustered index) scans for their I/O, typically selecting ranges from the fact tables. Other table I/O can be reduced using (3-4) and I/O bandwidth can be optimized to its minimum cost by (5-7). The challenge addressed here is that if this mode of operation is to be successful, the DBMS must be
Probability of finding a useful chunk
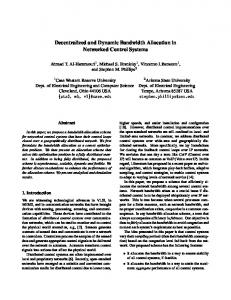
not try to reuse data shared by different running queries. In a dynamic environment, with multiple partial scans running at the same time, it is likely that the buffer pool contains some data that is useful for a given query. With a table consisting of CT chunks, a query that needs CQ chunks and a buffer pool of CB chunks, the probability of finding some useful data in the randomly-filled buffer is:
1 0.8 0.6 0.4 50% buffered 20% buffered 10% buffered 5% buffered 1% buffered
0.2 0 0
10
20
30 40 50 60 70 80 Chunks needed by a query (out of 100)
90
CB −1
100
Preuse = 1 −
Figure 2: Probability of finding a useful chunk in a randomly-filled buffer pool, with varying buffer pool size and query demand
capable of handling many concurrent scan queries efficiently. However, unlike asynchronous random I/O, where concurrent batches of random I/Os may allow for better amortized disk seeks thanks to request reordering, the naive approach to concurrent scans causes queries to fight for sequential read bandwidth, reducing overall throughput. We should note that we do not focus on overall query throughput alone as our efficiency metric: it is equally important that average query latency is minimized. The rationale here is that in many scenarios, for example when an application submits queries one after another, query latencies significantly influence the execution time of a query stream and hence the observed system throughput. Our work exploits the observation that concurrent scans have a high expected amount of overlapping data need. This creates the opportunity for synchronizing queries, such that they share buffered data and thus reduce the demand for disk bandwidth. In the following we discuss how existing systems exploit this opportunity and propose a new technique that further improves bandwidth sharing.
3.
TRADITIONAL SCAN PROCESSING
With multiple scans running concurrently, in a naive implementation sequential requests from different queries can interleave, causing frequent disk-arm movements and resulting in a semi-random access pattern and low overall disk throughput. To avoid this problem, most database systems execute such scans using large isolated I/O requests spanning over multiple pages, together with physical clustering of table pages. As a result, the overhead of shifting the diskarm is amortized over a large chunk of data, resulting in an overall bandwidth comparable to a standalone scan. Even when using bandwidth-efficient chunk-based I/O, different scheduling policies are used for concurrent scans. The most naive, called normal in the rest of the paper, performs scans by simply reading all disk blocks requested by a query in a sequential fashion, using an LRU policy for buffering. The disadvantage of LRU is that if one query starts too long after the other, the loaded pages will already be swapped out before they can be reused. As a result, assuming there is no buffer reuse between the queries, and queries are serviced in a round-robin fashion, the expected number of I/Os performed in the system until a new query Qnew that P reads Cnew chunks finishes can be estimated by: Cnew + q∈queries M IN (Cnew , Cq ). The major drawback of the normal policy is that it does
725
Y CT − CQ − i CT − i i=0
(1)
As Figure 2 shows, even for small scanned ranges and buffer sizes, this probability can be high, e.g. over 50% for a 10% scan with a buffer pool holding 10% of the relation. Unfortunately, the normal policy, by enforcing a sequential order of data delivery, at a given time can use only a single page, reducing this probability to CB /CT . In many cases it is possible to relax the requirement of sequential data delivery, imposed by normal. Even when using a clustered index for attribute selection, consuming operators often do not need data in a particular order. This allows for scheduling policies with “out-of-order” data delivery. A simple idea of sharing disk access between the overlapping queries is used in the attach strategy. When a query Qnew enters the system, it looks at all other running scans, and if one of them (Qold ) is overlapping, it starts to read data at the current Qold ’s position. To optimize performance, attach should choose a query that has the largest remaining overlap with Qnew . Once Qnew reaches the end of its desired range, it starts from the beginning until reaching the original position. This policy, also known as “circular scans” or “shared scans”, is used among others in Microsoft SQLServer [10], RedBrick [9], and Teradata [20], and allows significant performance improvement in many scenarios. The attach policy, however, may suffer from three problems. First, if one query moves much faster than the other, the gap between them may become so large that pages read by the fastest query are swapped out before the slower reaches them (they “detach”). Second, if queries are range scans, it is possible that one of the queries that process data together finishes, and the other continues by itself, even though it could attach to another running query. For example, if a full scan is underway but not yet in its range, attach misses this sharing opportunity. Finally, when exploiting per-block meta-data, the scan request can consist of multiple ranges, making it even harder to benefit from sharing a scan with a single query. As a result, the upper bound on the number of I/Os performed by attach is the same as in normal. The elevator policy is a variant of attach that addresses its problems by enforcing strict sequential reading order of the chunks for the entire system. This optimizes the disk latency and minimizes the number of I/O requests, and thus leads to good disk bandwidth and query throughput. However, the problem here is that query speed degenerates to the speed of the slowest query, because all queries wait for each other. Also, range queries often need to wait a long time before the reading cursor reaches the data that is interesting for them. In principle, in the worst case the number of I/Os performed by a system before P a fresh query Qnew finishes can be M IN (CT , Cnew + q∈queries Cq ), where CT is the number of chunks in the entire table.
4.
CScan process
COOPERATIVE SCANS
The analysis in the previous section, further confirmed by results in Section 5, demonstrates that existing scanprocessing solutions that try to improve over the normal policy still suffer from multiple inefficiencies. In this section we propose a new “Cooperative Scans” framework that avoids these problems. As Figure 1 presents, it consists of a cooperative variant of the traditional (index) Scan operator, named CScan, and an Active Buffer Manager (ABM). The new CScan operator registers itself as an active scan on a range or a set of ranges from a table or a clustered index. CScan has much the same interface as the normal Scan operator, but it is willing to accept that data may come in a different order. Note that some query plans exploit column ordering present on disk. We discuss integration of such queries in our framework in Section 7. The Active Buffer Manager (ABM) extends the traditional buffer manager in that it keeps track of CScan operators and which parts of the table are still needed by each of them, and tries to schedule disk reads such that multiple concurrent scans reuse the same pages. The overall goal of the ABM is to minimize average query cost, keeping the maximum query execution cost reasonable (i.e. ensuring “fair” treatment of all queries). As discussed before, scan processing is usually performed with large I/O units we call chunks, to achieve good bandwidth with multiple concurrent queries. Note, that a chunk in memory does not have to be contiguous, as it can consists of multiple pages filled in with a single scatter-gather I/O request. In our framework there are two more reasons for using chunks. First, the number of chunks is usually one or two orders of magnitude smaller than the number of pages, thus it becomes possible to have chunklevel scheduling policies that are considerably more complex than page-level policies. Secondly, chunks are logical entities whose boundaries may not even correspond exactly to page boundaries, a feature that will be exploited in the more complex scenarios with column-based storage. In our system, the Cooperative Scans framework implements the traditional scan-processing policies: normal, attach and elevator. However, its main benefit comes from a newly introduced relevance policy that takes scheduling decisions by using a set of relevance functions. Both the CScan and ABM processes, as well as the relevance functions used by them, are described in Figure 3. As the top part of Figure 3 illustrates, the CScan process is called on behalf of a certain query, qtrigger , that contains a CScan operator in its query plan. Each time qtrigger needs a chunk of data to process, selectChunk is called. This triggers a search over all buffered chunks that still need to be processed by the query, in chooseAvailableChunk, and returns the most relevant one, as governed by useRelevance. If no such chunk is available, the operator blocks until the ABM process loads a chunk that is still needed by qtrigger . Our useRelevance function promotes chunks with the smallest number of interested queries. By doing so, the less interesting chunks will be consumed early, making it safe to evict them. This also minimizes the likelihood that less interesting chunks will get evicted before they are consumed. The ABM thread continuously monitors all currently running queries and their data needs. It schedules I/O requests on behalf of the query with the highest priority, considering the current system state. For this query, it chooses the most relevant chunk to load, possibly evicting the least relevant
726
selectChunk(qtrigger ) | if finished(qtrigger ) | | return NULL | else | | if abmBlocked() | | | signalQueryAvailable() | | chunk = chooseAvailableChunk(qtrigger ) | | if (chunk == NULL) | | | chunk = waitForChunk(qtrigger ) | | return chunk chooseAvailableChunk(qtrigger ) | cavailable = NULL, U = 0 | foreach c in interestingChunks(qtrigger ) | | if chunkReady(c) and useRelevance(c) > U | | | U = useRelevance(c) | | | cavailable = c | return cavailable ABM process
main() | while (true) | | query = chooseQueryToProcess() | | if query == NULL | | | blockForNextQuery() | | | continue | | chunk = chooseChunkToLoad(query) | | slot = findFreeSlot(query) | | loadChunk(chunk, slot) | | foreach q in queries | | | if (chunkInteresting(q, chunk) and queryBlocked(q) | | | | signalQuery(q, chunk) chooseQueryToProcess() | relevance = −∞, query = NULL | foreach q in queries | | qr = queryRelevance(q) | | if (query == NULL or qr > relevance) | | | relevance = qr | | | query = q | return query chooseChunkToLoad(qtrigger ) | cload = NULL, L = 0 | foreach c in interestingChunks(qtrigger ) | | if (not chunkReady(c)) and loadRelevance(c) > L | | | L = loadRelevance(c) | | | cload = c | return cload findFreeSlot(qtrigger ) | sevict = NULL, K = ∞ | foreach s in slots | | if empty(s) | | | return s | | c = chunkInSlot(s) | | if (not currentlyUsed(s)) and (not interesting(c, qtrigger )) | | and (not usefulForStarvedQuery(c)) | | and keepRelevance(c) < K | | | K = keepRelevance(c) | | | sevict = s | freeSlot(sevict ) | return sevict NSM Relevance Functions
queryRelevance(q) | if not queryStarved(q) | | return −∞ | return - chunksNeeded(q) + | | waitingTime(q) / runnningQueries() useRelevance(c, qtrigger ) | return Qmax − numberInterestedQueries(c) loadRelevance(c) | return numberInterestedStarvedQueries(c) * Qmax | + numberInterestedQueries(c) keepRelevance(c, qtrigger ) | return numberInterestedAlmostStarvedQueries(c) * Qmax | + numberInterestedQueries(c) queryStarved(qtrigger ) | return numberOfAvailableChunks(qtrigger ) < 2
Figure 3: Pseudo-code for the Relevance policy
chunk present in the buffer manager. Once a new chunk is loaded into the ABM, all blocked queries interested in that chunk are notified. This is the core functionality of ABM’s main loop, as found in the middle part of Figure 3. The chooseQueryToProcess call is responsible for finding the highest priority query, according to queryRelevance, to load a chunk for. This queryRelevance function considers non-starved queries (i.e. a queries that have 2 or more available chunks, including the one they are currently processing) equal, assigning them the lowest priority possible. Starved queries are prioritized according to the amount of data they still need, with shorter queries receiving higher priorities. However, to prevent the longer queries from being starved forever, the priorities are adjusted to also promote queries that are already waiting for a long time. By prioritizing short queries, ABM tries to avoid situations where chunks are assigned to queries in a round-robin fashion, as this can have a negative impact on query latency. Besides, a chunk loaded for a short query has a higher chance of being useful to some large query than the other way around. In case ABM does not find a query to schedule a chunk for, it blocks in blockForNextQuery, until the CScan operator wakes it up again using signalQueryAvailable. Once ABM has found a query to schedule a chunk for, it calls the chooseChunkToLoad routine to select a not yet loaded chunk that still needs to be processed by the selected query. The loadRelevance function determines which chunk will actually be loaded, not only by looking at what is relevant to the current query, but also taking other queries needs into consideration. To maximize sharing, it promotes chunks that are needed by the highest number of starved queries, while at the same time slightly adjusting priorities to prefer chunks needed by many non-starved queries. If there are no free slots in the buffer pool, ABM’s findFreeSlot routine needs to swap out the chunk with the lowest keepRelevance. This function is similar to loadRelevance, except that when looking at queries, we treat queries on the border of starvation as being starved, to avoid evicting their chunks, which would make them starved, hence schedulable, immediately. The relevance policy tries to maximize buffer pool reuse without slowing down fast queries. Thus, a slow query will re-use some of the chunks loaded by a fast query, skipping over chunks that it was too slow to process. These are read again later in the process, when the fast query might already be gone. The access pattern generated by this approach may be (quasi-) random, but since chunks consist of multiple sequential pages, disk (arm) latency is still well amortized.
5. 5.1
ROW-WISE EXPERIMENTS Benchmark settings
Benchmark system: We carried out row storage experiments on MonetDB/X100, using the PAX storage model, which is equivalent to NSM in terms of I/O demand. The chunk size used was 16MB, and the ABM buffer-pool size was set to 64 chunks (1GB), unless stated otherwise. Direct I/O was used, to avoid operating system buffering. Our test machine was a dual-CPU AMD Opteron 2GHz system with 4GB of RAM. The storage facility was a 4-way RAID system delivering slightly over 200 MB/s. Benchmark dataset: We used the standard TPC-H [30]
727
benchmark data with scale factor 10. In this setting the lineitem table consumes over 4GB of disk space. The other tables are fully cached by the system. Queries: To allow flexible testing of our algorithms we have chosen two queries based on the TPC-H benchmark. Query FAST (F) is TPC-H Q6, which is a simple aggregation. Query SLOW (S) is TPC-H Q1 with extra arithmetic computations to make it more CPU intensive. For all queries we allow arbitrary scaling of the scanned table range. In this section we use the notation QUERY-PERCENTAGE, with QUERY representing the type of query, and PERCENTAGE the size of the range being scanned. For example, with F10 we denote query FAST, reading 10% of the full relation from a random location. We use multiple query streams, each sequentially executing a random set of queries. There is a 3 second delay between starting the streams, to better simulate queries entering an already-working system.
5.2
Comparing scheduling policies
Table 2 shows the results for all scheduling policies when running 16 streams of 4 queries. We used a mix of slow and fast queries with selectivity of 1%, 10%, 50% and 100%. The two major system-wide results are the average stream running time, that represents the system throughput, and the average normalized latency of a query (running time in this benchmark divided by the base time, when the query runs by itself with an empty buffer), that represents the system latency. Additionally we provide the total execution time, CPU-utilization, and the number of issued I/Os. The difference between the total time and the average stream time comes from the random distribution of queries in the streams, resulting in a significant variance of stream running times. For each query type and policy we provide the average latency, normalized latency and number of I/Os issued when scheduling this query type. Additionally, Figure 4 presents a detailed analysis of the I/O requests issued by each policy. As expected, the normal policy achieves the worst performance. As Figure 4 shows, it maintains multiple concurrent sequential scans, which leads to the largest number of I/O requests and a minimal buffer reuse. Since the query load is relatively CPU-intensive, it still manages to use a significant fraction of the CPU time. The attach policy allows merging requests from some queries. As a result, it consistently improves the performance of all query types and the system throughput. Still, in Figure 4 we see that there are multiple (albeit fewer than in normal) concurrent scans, since not all queries can share the same chunk sequence. Additionally, we can see that a faster query can detach from a slower one (circled), resulting in a split of a reading sequence, further reducing the performance. The elevator policy shows a further reduction of the I/O requests and improvement of system throughput. This is a result of its simple I/O pattern seen in Figure 4. However, we see that the average normalized latency is very bad for this policy. This is caused by the short queries that suffer from a long waiting time, and achieve results even worse than in normal. This blocking of queries also degrades the overall system time, since it delays the start moment of the next query in a given stream. We also see that fast and slow queries differ little in performance - this is caused by the fast queries waiting for the slow ones. Our new relevance policy achieves the best performance,
Normal Avg. stream time Avg. normalized latency Total time CPU use I/O requests query
count
F-01 F-10 F-50 F-100 S-01 S-10 S-50 S-100
9 7 6 9 13 6 6 8
standalone cold time
Attach System statistics
Elevator
Relevance
283.72 6.42 453.06 53.20% 4186
160.81 3.72 281.19 81.31% 2325 Query statistics
138.41 13.52 244.45 90.20% 1404
99.55 1.96 238.16 93.94% 1842
latency(sec) norm. I/Os avg stddev lat.
latency(sec) norm. I/Os avg stddev lat.
latency(sec) norm. avg stddev lat.
latency(sec) norm. I/Os avg stddev lat.
0.26 1.71 1.02 2.06 13.97 5.69 10.72 103.59 14.96 20.37 192.82 31.56 0.38 1.67 1.25 3.55 21.58 5.11 17.73 78.23 29.07 35.27 179.35 59.04
6.58 2 1.02 6.78 23 6.23 9.66 78 58.77 9.47 153 96.98 4.39 2 1.19 6.08 19 15.12 4.41 95 46.98 5.09 177 105.51
0.49 2.56 10.96 23.33 0.65 4.08 16.82 33.40
3.92 3.02 5.48 4.76 3.13 4.26 2.65 2.99
2 18 67 69 3 24 79 60
5.31 15.17 44.87 59.60 15.01 20.29 37.39 79.39
7.33 20.42 0.52 0.36 8.63 7.36 3.30 1.30 7.92 4.19 18.21 6.64 19.57 2.93 29.01 8.17 15.04 39.50 0.55 0.29 23.93 5.72 11.30 5.98 14.23 2.11 37.77 15.66 24.37 2.25 98.71 29.89
2.00 1.60 1.70 1.42 1.45 3.18 2.13 2.80
2 18 43 69 2 22 48 44
Table 2: Row-storage experiments (PAX) with a set of FAST and SLOW queries scanning 1%, 10%, 50% and 100% of a table. 16 streams of 4 random queries. All times in seconds. normal
attach
elevator
relevance
250
chunk
200 150 100 50
"detach"
0 0
100
200 300 time (sec)
400 0
50
100 150 200 250 0 time (sec)
50
100 150 time (sec)
200
0
50
100 150 time (sec)
200
Figure 4: Behavior of different scheduling algorithms: disk accesses over time both in terms of global system parameters, as well as in most query times. As Figure 4 shows, its I/O request pattern is much more dynamic than in all the other policies. Interestingly, although relevance issues more I/Os than elevator, it still results in a better throughput. This is because the system is mostly CPU-bound in this case, and extra available I/O time is efficiently used to satisfy further query requirements. Also, relevance differs from other policies by significantly improving the performance of I/O bound queries. Average query latency is three times better than normal and two times better than attach (I/O bound queries like F-100 can even be three times faster than attach).
5.2.1
Exploring Many Different Query Mixes
To provide more than accidental evidence of the superior performance of relevance, we conducted experiments with the same basic settings as in the previous section: 16 streams of 4 queries, TPC-H table with scale factor 10 and buffer size of 1GB. However, we changed the set of queries to explore two dimensions: range size and data-processing speed. Figure 5 shows the results, where we compare throughput as the average stream running time (y axis) and average normal-
728
ized query latency (x axis) of normal, attach and elevator, with respect to our relevance policy. Each point represents a single run for one policy. The point labels describe runs in a format “SPEED-SIZE”, where SPEED defines what query speeds were used (FS - mix of fast and slow, F - only fast, FFS - 2 times more fast than slow etc.), and SIZE represents the size of the range being scanned: S - short (mix of queries reading 1, 2, 5, 10 and 20% of a table), M - mixed (1,2,10,50,100) and L - long (10,30,50,100). From this experiment we conclude that indeed relevance, representing the (1,1) point in this scatter plot, is consistently better than all other policies. Recall that our objective was to find a scheduling policy that works well both on the query throughput and on the query latency dimension, and this is exactly what is shown in Figure 5. This scatter plot also allows us to better understand the other policies. We see that normal is inferior on both dimensions, whereas elevator gets close to relevance on throughput, but its performance is significantly hindered by poor query latencies. As for the attach, it does find a balance between throughput and latency, but it is consistently beaten by relevance in both dimensions.
7
FFS-M
Number of I/O requests
4
System time (sec)
5
1600 1400 1200 1000 800 600 400 200 0
160 140 120 100 80 60 40 20 0
FFS-L
3
F-L
SF-M SF-L
F-S
2.5 F-M FFS-S F-S
2
FFS-M
FFS-S FFS-L SF-S
SSF-L
SSF-M
SF-L SSF-S SF-M S-S S-M SF-L SF-S S-L SSF-L S-SSSF-S FFS-L SF-S SSF-L F-S F-L SSF-M SSF-S S-S S-L FFS-S S-L S-M
1.5 1.2
Average normalized query latency
Average stream time / RELEVANCE
6
SF-M F-M FFS-M SSF-M
S-M
1 1
1.2
1.5 2 2.5 3 4 5 6 Average normalized query latency / RELEVANCE
normal
attach
7
8
40
60
20
40
60
20
40
60
80
100
100
20
40
60
80
100
8 7 6 5 4 3 2 1 0
8 6 4 2 0 20 40 60 80 100 Buffer capacity (percentage of the table size) attach
20 40 60 80 100 Buffer capacity (percentage of the table size) elevator
relevance
Figure 6: Behavior of all scheduling policies under varying buffer pool capacities 20% scans 100 normal attach elevator relevance
20 Average query latency
80
10
5% scans
729
100
12
25
With growing dataset sizes, the percentage of a relation that can be stored inside the buffer pool decreases. To simulate this, we tested the performance of different policies under varying buffer size capacities, ranging from 12.5% to 100% of the full table size. This allows us to observe how different scheduling policies would behave under growing relation sizes, when a smaller fraction of a table can be buffered. In this experiment we used a version of our relation trimmeddown to 2 GB, that can be fully cached in the memory of our benchmark machine. Figure 6 shows the results of a benchmark with two sets of queries, one disk-intensive, consisting only of fast queries, and a CPU-intensive one, consisting of a mix of fast and slow queries. We used 8 streams of 4 queries. As expected, the number of I/Os is decreasing with increasing buffer size. In the disk-intensive case, the absolute system performance is directly influenced by this number, because the system is never CPU-bound. Still, thanks to better request scheduling, the relevance policy manages to improve the performance, issuing significantly fewer I/O requests even when using a 87.5% buffer capacity. In the CPUintensive scenario, the number of I/Os influence the absolute time only partially. This is because most algorithms manage to make a system CPU-bound with some buffer capacity. For relevance even a small buffer size of 12.5% of the full table is enough to achieve this, as we can see by its mostly constant performance. Interestingly, Figure 6 shows that the performance advantages of relevance over the other policies as observed in Figure 5 are maximized when tables get bigger (i.e. at low buffered percentages). When looking at attach, the most viable competitor, we see that throughput in I/O bound situations, as well as latency in CPU bound queries deteriorate strongly, and we expect the advantage of relevance to grow even more if table sizes become huge.
80
140 120 100 80 60 40 20 0
normal
Scaling The Data Volume
I/O-intensive query set (F-01,F-10,F-50,F-100) 1400 1200 1000 800 600 400 200 0
20
elevator
Figure 5: Performance of various scheduling policies for query sets varying in processing speed and scanned range
5.2.2
CPU-intensive query set (S-01,S-10,S-50,S-100, F-01,F-10,F-50,F-100)
F-M F-L
50% scans 160
normal attach elevator relevance
90 80
normal attach elevator relevance
140 120
70 15
10
60
100
50
80
40
60
30 40 5
20 20
10 0
0 1
2 4 8 16 32 Number of queries
0 1
2 4 8 16 32 Number of queries
1
2 4 8 16 32 Number of queries
Figure 7: Performance comparison with varying number of concurrent queries and scanned ranges
5.2.3
Many Concurrent Queries
With more concurrent queries the opportunities for datareuse increase. In Figure 7 we present how the average query time changes when an increasing number of concurrent queries reads 5, 20 and 50% of our relation, using a buffer pool of 1GB. As expected, the benefit of relevance over normal grows with larger scans and more concurrency. We see that relevance also enhances its advantage over attach when more queries run concurrently, even exceeding the factor two observed in Figures 6 and 5, when scan ranges are very or moderately selective. As this query set is uniform in terms of range sizes, elevator can score close to relevance, but we know from previous experiments that on combinations of short and long ranges it is not a viable competitor.
5.2.4
Scheduling-cost scalability
The cost of scheduling in relevance is significantly higher than for other policies. For example, the loadRelevance function needs to check every query for every table chunk, and do this for each chunk a query requests. Figure 8 presents the average times spent on scheduling when running 16 con-
LINEITEM COLUMNS
current streams of 4 I/O-bound queries, each with the same relation stored in a different number of chunks of varying sizes. As expected, the overhead grows super-linearly - with smaller chunks, every query needs to scan more of them, and the decision process for each data request needs to consider more chunks. Still, even with the largest tested number of chunks, the scheduling overhead in the worst case does not exceed 1% of the entire execution time. In situations when such overhead is not acceptable, e.g. with relations consisting of hundreds of thousands of chunks, slightly less complex policies can be considered. Also, our relevance implementation is rather naive, leaving opportunities for optimizations that can significantly reduce the scheduling cost.
6.
IMPROVING DSM SCANS
After our successful experiments with relevance in rowstorage, we now turn our attention to column-stores. The decomposed storage model (DSM) has recently gained popularity for its reduced disk-bandwidth needs, faster query processing thanks to improved data locality [3], possibility of vectorized processing [5, 4] and additional compression opportunities [33, 1]. While we will show that relevance can also be successful here, we first discuss why DSM is much more complex than NSM when it comes to scans in general and I/O scheduling in particular, and how this influenced our Cooperative Scans framework.
6.1
DSM Challenges
Table columns stored using DSM may differ among each other in physical data representation width, either because of the data types used, or because of compression. For example, Figure 9 depicts column storage of a part of the TPC-H lineitem table, with some columns compressed with techniques presented in [33]. This shows that we can not assume a fixed number of tuples on a disk page, even within a single column. As a result, a chunk cannot consist of a fixed number of disk pages as in NSM. Instead, chunks are logical concepts, i.e. a horizontal partitioning of the table on the tuple granularity. For example, one may divide a table in conceptual chunks of a 100.000 tuples, but it is also possible to use variable-size chunks, e.g. to make the chunk boundary always match some key boundary. This implies that chunk boundaries do not align with page boundaries.
730
str:256bit
Figure 8: Scheduling time and fraction of execution time when querying 1%, 10% and 100% of a 2GB relation with varying chunk size / number
chunk 2 chunk 3
100% scan
chunk 1
1% scan 10% scan
decimal:64bit
100% scan
256 512 1024 2048 Number of chunks (chunk size = 2GB / number)
PDICT(str):2bit
1% scan 10% scan
128
PFOR(oid):21bit
256 512 1024 2048 Number of chunks (chunk size = 2GB / number)
chunk 0
1e-05 128
PFOR−DELTA(oid):3bit
0.01
1e-04
DISK PAGE comment
0.1
extendedprice
1
0.001
returnflag
10
partkey
Fraction of the execution time
0.01
orderkey
Scheduling time (ms)
100
Figure 9: Compressed column storage: more complex logical chunk – physical page relationships The underlying storage manager should provide an efficient means to tell which pages store data from a chunk. Depending on the physical data representation, a single logical chunk can consist of multiple physical pages, and a single physical page can contain data for multiple logical chunks. This logical-physical mismatch present in DSM becomes even more problematic when using large physical blocks of a fixed size for I/O, a technique introduced in NSM for good concurrent bandwidth. The first problem here is that when loading a block for one chunk, a potentially large amount of data from a neighboring chunk can be loaded at the same time. In NSM this does not occur, as chunks and blocks are equivalent. In DSM, however, ABM needs to take special care to minimize situations in which this extra data is evicted before it could be used by a different chunk. Also, keeping a full physical block in memory to provide it to another query in the near future may result in a sub-optimal buffer usage. The second problem is the buffer demand: in NSM, for Q concurrent queries the system requires 2 ∗ Q (factor 2 because of prefetching) blocks, which is usually acceptable, e.g. 512MB for 16 concurrent scans using 16MB chunks/blocks. In DSM, however, to process a set of rows, data from multiple columns needs to be delivered. While some optimizations are possible, e.g. performing selections on some columns early [13], in general all the columns used by a query need to be loaded before the processing starts. As a result, a separate block is needed for every column used in a query, increasing the buffer demand significantly for multi-column scans, e.g. to 4GB for 16 scans reading 8 columns each. This can be improved (in both models) by analyzing which pages from blocks are already processed, and re-using them as-soon-as-possible for I/Os for different queries (with scatter-gather I/O). Both problems demonstrate that in DSM the performance and resource demand can be significantly improved by making algorithms pageaware. However, such solutions significantly complicate the implementation, and our current system currently handles only chunk-level policies. The final DSM problem for Cooperative Scans is the reduced data reuse opportunity between queries. Figure 10 shows two queries reading a subset of a table and their I/O requirements in both NSM and DSM. Comparing the logical
Logical level query 1
a
b
c
d
e
f
NSM g
h
a
b
c
d
e
DSM f
g
h
a
b
c
d
e
f
g
h
query 2 overlap
values I/O units
Figure 10: Data overlapping in NSM and DSM useRelevance(c, qtrigger ) | cols = queryColumns(qtrigger ) | U = |interestedOverlappingQueries(c, cols)| | Pu = numberCachedPages(c, cols) | return Pu /U loadRelevance(c, qtrigger ) | query cols = queryColumns(qtrigger ) | queries = overlappingStarvedQueries(c, query cols) | cols = columnsUsedInQueries(queries) | L = |queries| | Pl = |columnPagesToLoad(c, cols)| | return L/Pl keepRelevance(c, qtrigger ) | starved = almostStarvedQueries(c) | cols = columnsUsedInQueries(starved) | E = |starved| | Pe = |cachedColumnPages(c, cols)| | return E/Pe
Figure 11: DSM Relevance Functions
data need to the physical data demand in both models, we see that the vertical expansion present in DSM is usually significantly smaller than the horizontal expansion present in NSM. As a result, fewer disk blocks are shared between the queries, reducing the chance of reusing the same block for different scans. In NSM, for a block fetched by some query Q1 , the probability that another query Q2 , reading T2 tuples, will use it is proportional to TTT2 , where TT is the number of tuples in the entire table. In DSM, we need to take into account both vertical (as in NSM) and horizontal overlap, reducing this probability to TTT2 ∗ Poverlap (Q1 , Q2 ), where Poverlap (Q1 , Q2 ) is the probability of a column from Q1 also being used in Q2 .
6.2
Cooperative Scans in DSM
The DSM implementation of the traditional policies is straightforward. In normal, the order of I/Os is strictly determined by the query and LRU buffering is performed on a (chunk,column) level. DSM attach joins a query with most overlap, where a crude measure of overlap is the number of columns two queries have in common. A more fine-grained measure would be to get average page-per-chunk statistics for the columns of a table, and use these as weights when counting overlapping columns. Just like in NSM, the DSM elevator policy still enforces a global cursor that sequentially moves through the table. Obviously, it only loads the union of all columns needed for this position by the active queries. The framework for relevance in DSM is similar to that in NSM, with a few crucial differences, caused by the challenges discussed in the previous section: avoiding data waste – as discussed, with I/O based on large physical blocks, it is possible that a block loaded for
731
one logical chunk contains data useful for neighboring chunks. When the first chunk is freed, this data would be evicted. To avoid that, the choice of the next chunk for a given query is performed before the query blocks for a fully available chunk. The already-loaded part of the chunk is marked as used, which prohibits its eviction. finding space for a chunk – in DSM it is possible that a subset of columns in a buffered chunk is not useful for any query. ABM first evicts blocks belonging to such columns. Then, it starts evicting useful chunks, using the keepRelevance function to victimize the least relevant chunk. Note that, unlike in NSM, this eviction process is iterative, since due to different physical chunk sizes, possibly multiple chunks need to be freed.1 column-aware relevance functions – Figure 11 shows that the DSM relevance functions need to take into account the two-dimensional nature of column storage and the varying physical chunk sizes. Like in NSM, useRelevance attempts to use chunks needed by few queries, to make them available for eviction. However, it also analyzes the size of a chunk, to additionally promote chunks occupying more buffer space. The loadRelevance function looks at the number of starved queries that overlap with a triggering query and are interested in a given chunk. It also estimates the cost of loading a given chunk by computing the number of cold pages required for all needed columns. The returned score promotes chunks that benefit multiple starved queries, and require a small amount of I/O. The DSM keepRelevance function promotes keeping chunks that occupy little space in the buffer pool and are useful for many queries. column loading order – a final issue in DSM is the order of columns when loading a chosen chunk. If some queries depend only on a subset of the columns, it may be beneficial to load that subset first. Our current crude approach is to just load column chunks in increasing size (in terms of pages), which maximizes the number of “early” available columns, allowing queries to be awoken earlier. Another approach could prioritize columns that faster satisfy some query needs. Finally, if data is compressed on disk but kept decompressed in the buffer manager (like in SybaseIQ), it might be valuable to first load compressed columns, so their decompression is interleaved with loading the remaining ones.
6.3
DSM Results
Table 3 presents DSM results for an experiment similar to the one presented in Table 2 for NSM/PAX. One difference is that we used a faster “slow” query, since, due to the faster scanning achieved by DSM, with the original query the system was completely CPU bound, making it impossible to demonstrate performance differences of different policies with these queries. Also, we increased the lineitem size from factor 10 ( 60Mtuples) to 40 ( 240Mtuples), to compensate for the lower data-volume demand of DSM. Finally, since our current implementation requires reserved memory for each active chunk, and there are more chunks in DSM (one for each column), we had to increase the buffer size from 1GB to 1.5GB to allow concurrent execution of 16 queries. 1 If multiple chunks need to be freed, the dependency between them should be taken into account, something missed by the greedy iterative approach used here. Choosing the optimal set of chunks to free is a good example of a knapsack problem surfacing in DSM I/O scheduling.
Normal Attach Elevator Relevance System statistics avg stream time 536.18 338.24 352.35 264.82 avg norm. lat. 7.05 4.77 15.11 2.96 total time 805 621 562 515 CPU use 61 % 77 % 82 % 92 % I/O requests 6490 4413 2297 3639 Query statistics query
cold latency
avg. latency
avg. latency
avg. latency
avg. latency
F-01 F-10 F-50 F-100 S-01 S-10 S-50 S-100
0.92 2.99 15.88 26.53 1.90 8.15 36.28 71.25
6.12 21.01 191.12 364.33 6.92 47.93 148.19 346.65
4.68 16.39 108.53 198.86 5.07 37.96 126.20 259.14
26.95 45.64 141.84 145.81 54.75 103.12 134.19 184.60
3.17 10.19 64.97 90.16 3.33 21.93 88.19 231.38
Table 3: Column-storage experiments with a set of FAST and SLOW queries scanning 1%, 10%, 50% and 100% of a table. 16 streams of 4 random queries. All times in seconds. Normal Relevance number query latency number query latency of I/Os avg. stddev of I/Os avg. stddev Non-overlapping queries ABC 5094 100.58 20.71 1560 24.27 5.24 ABC,DEF 6215 121.83 24.83 3254 57.87 14.54 Partially-overlapping queries ABC 5094 100.58 20.71 1560 24.27 5.24 ABC,BCD 5447 107.86 21.28 2258 39.69 10.34 ABC,BCD,CDE 5791 113.26 27.39 2918 52.94 14.02 ABC,BCD,CDE 6313 125.14 22.35 3299 60.20 12.50 DEF Queries (used columns)
Table 4: Performance of DSM queries when scanning different sets of columns of a synthetic table. The results confirm that also in DSM relevance is clearly the best scheduling approach. All policies behave as observed earlier in NSM: normal performs bad in both dimensions, while attach and elevator both improve the system throughput, with the former additionally improving query latencies. The relevance policy beats the competitors in both dimensions, only losing slightly to elevator on the slow full-table scan.
6.3.1
Overlap-ratio experiments
While so-far we have seen another success story of relevance, in DSM there is the caveat of column overlap. If queries have a significant percentage of overlapping columns, DSM provides good I/O reuse opportunities, which are then best exploited by relevance. In the following experiment, however, we investigate to what extent decreasing column overlap affects performance. We have performed a synthetic benchmark, where we run various queries against a 200Mtuple relation, consisting of 10 attributes (called A to J), each 8 bytes wide. The buffer size is 1GB. We use 16 streams of 4 queries that scan 3 adjacent columns from the table. In different runs, corresponding queries read the same 40% subset of the relation, but may use different columns. The total number of chunks for the entire run is 7680 chunks. The first part of Table 4 shows the performance changes when query types do not have any overlapping columns. With 16 parallel queries and one resp. two query types, we
732
thus have 16 resp. 8 queries of the same type (but with randomly chosen 40% scan ranges). Due to the rather large size of the scans, normal can still re-use quite a few blocks in case of a single query type (around 33% of the 7680 chunks), but about half of that is lost when two column-disjunct queries are used. As for relevance, very good re-use is achieved using a single query type, with relevance beating normal by a factor 4. With two query types, the average query latency doubles, which corresponds to the 0.5 reduction of sharing opportunities, but relevance still beats normal by a factor two there. With non-overlapping query families, numbers are somewhat harder to understand, but the general trend is that I/O reuse drops with decreasing column overlap. As relevance normally benefits more from bandwidth sharing, it is hit more, relative to normal, but we still observe relevance beating normal by a factor two in these situations. These results confirm that the benefit of the relevance policy does depend on the columns used in the queries. This knowledge can be exploited by applications. For example, when looking for correlations in data mining, assuming thousands of queries are issued in the process and but only few are executing at the same time, it may be beneficial to schedule the queries such that the column overlap is maximized.
7.
COOPERATIVE SCANS IN A RDBMS
In this section we outline how existing DBMSs can be extended with Cooperative Scans, focusing on ABM implementation and adapting order-aware operators to out-of-order data delivery.
7.1
ABM implementation
The most practical and least intrusive way to integrate Cooperative Scans into an existing RDBMS is to put ABM on top of the standard buffer manager. We successfully created an early ABM prototype in PostgreSQL [32]. Here, to load a chunk, ABM requests a range of data from the underlying manager. This request is fulfilled by reading multiple pages occupying random positions in the standard buffer pool. These pages, locked by ABM after reading, are provided to all interested CScan operators and finally are freed when ABM decides to evict them. An additional benefit is that ABM can dynamically adjust its buffer size in situations when the system-wide load changes , e.g. when the number of active CScan operators decreases. Also, if the buffer manager provides an appropriate interface, it is possible to detect which pages of a chunk are already buffered and promote partiallyloaded chunks in ABM. Though we motivate our focus on a single table for CScan in Section 2, a production-quality implementation of CScan should be able to keep track of multiple tables, keeping separate statistics and meta-data for each (large) table in use. As our approach targets I/O bound situations, for small tables CScan should simply fall back on Scan. Finally, ABM only improves performance on clustered scans. For unclustered data access, CScan should not be used. Still, ABM can exploit the queue of outstanding page requests generated by the normal buffer manager to prioritize chunks more as they intersect more with this queue. When the chooseChunkToLoad() decides to load a chunk, any intersecting individual page requests should be removed from the normal page queue.
7.2
Order-aware operators
In this section, we discuss the impact of the out-of-order delivery of tuples by CScan on query processing. In its purest form, the relational algebra is order-unaware, and this holds true for many physical operators (e.g. nested-loop join, scan-select, hash-based join and aggregation, etc.). However, query optimizers make a clear distinction between orderaware and unaware physical operators (e.g. by enumerating sub-plans that preserve certain “interesting orders”). The two major order-aware physical operators are ordered aggregation and merge-join. Ordered aggregation exploits the key-ordering of the input for efficient computation of per-key aggregate results that can be immediately passed to the parent once a key change is detected. With Cooperative Scans, ordered aggregation can still exploit the fact that the per-chunk data is internally sorted. We pass the chunk number of a tuple as a virtual column via the Volcano-like operator interface of MonetDB/X100. When processing a given chunk, the operator performs inside-chunk ordered aggregation, passing on all the results except for the first and the last one in the chunk, as these aggregates might depend on the data from other chunks. These border values are stored on a side, waiting for the remaining tuples that need to be included in that computation. A key observation is that chunks are large, so not huge in number, and the number of boundary values to keep track of is limited by the number of chunks. Looking at the chunk sequence, it is also possible to detect the “ready” boundary values early and pass them to the parent immediately, which is especially useful with multiple consecutive chunks delivered. Merge Join can be handled in the attach and elevator policies as follows [14]: at a moment when a scan starts on one table, a matching position in the other table is found, and join processes until the end of table. Then, the scan on both tables starts from the beginning, processing until the original position. Since relevance’s data delivery pattern is much more dynamic, a more complex approach is necessary. In case the inner table fits main memory, it is enough to switch to a proper position in this table (using index lookup) whenever a chunk in the outer table changes. When both tables need to be scanned, and relevance is applied for both, the situation becomes more complicated such that systems should fall back to Scan instead of CScan. In one special yet valuable case, CScan can still be applied though. MonetDB/X100 uses join indices for foreign-key relationships. For example, the join index over orderkey between lineitem and order in TPC-H adds the physical row-id #order as an invisible column to lineitem. By storing the lineitem table sorted on #order (and order itself sorted on orderdate), we get multi-table clustering, where tuples are stored in an order corresponding to the foreign key join relationship. Within MonetDB/X100, there is ongoing work on Cooperative Merge Join (CMJ) that works on top of such clustered tables, fully accepting out-of order data as it is delivered by CScan. The key observation is that multi-table clustered DSM tables can be regarded as a single, joined, DSM table on the level of ABM, as it already has to deal with the fact that in DSM columns have widely varying data densities and chunk boundaries never coincide with page boundaries.
733
Thus, ABM views the physical representation of the clustered order and lineitem table as the physical representation of the already joined result, even though the data density in the order columns is on average six times lower than in lineitem. Using the freedom to choose the boundaries of logical chunks at will, it makes sure that matching tuples from order and lineitem always belong to the same chunk. Thus, a single CScan operator can deliver matching column data from both order and lineitem tables and the special CMJ merge-join reconstructs joined tuples from these.
8.
RELATED WORK
Disk scheduling policies are a topic that originated from operating systems research [29]. Various such policies have been proposed, including First Come First Served, Shortest Seek Time First, SCAN, LOOK and many others. Most relevant for our work is SCAN, also known as the “Elevator” algorithm. In this approach, a disk head performs a continuous movement across all the relevant cylinders, servicing requests it finds on its way. Other related operating system work is in the area of virtual memory and file system paging policies, for which generally LRU schemes are used. Note, that these solutions are mostly targeted at optimizing the disk seek time with multiple random disk accesses. In case of large sequential scans, these policies will offer very little improvement. Previous research in DBMS buffer management [7, 23, 6, 12] usually considered large table scans trivial and suggested a simple LRU or MRU policy, which minimized the possibility of inter-query data reuse. To overcome this problem, the concept of circular-scans has been introduced in some commercial DBMSs, e.g. Teradata, RedBrick and Microsoft SQLServer [20, 9, 10]. A variation of this idea was suggested in [16], where authors issue a massive number of concurrent request to the buffer manager and serve them in a circular fashion. It was also discussed as a part of the Q-Pipe architecture [14]. All these approaches follow either the attach or elevator policies, which in Section 5 have been shown as inferior to the new proposed relevance policy. Recently, a modified version of the attach policy has been suggested for the IBM DB2 system [17]. This solution introduces slight improvements to attach, by adding explicit group control and allowing a limited throttling of faster queries, but still suffers from the major attach problems. Most previous work regarding table scans has focused on row storage only, ignoring scans over column-oriented data. A recent paper by Harizopoulos et al. [13] provides a detailed analysis of the I/O behavior differences between DSM and NSM. However, this paper concentrates on single-query scenarios and does not analyze the problem of the DSM buffer demand, which we found important, especially in a concurrent environment. Scheduling is also important in real-time database systems [15], where transactions need to be scheduled to meet certain time critical constraints. This involves making scheduling decisions based on the availability of certain resources, such as CPU, I/O, and buffer-manager space. Our work differs from such scheduling, in that we do not treat buffermanager space as a resource being competed for, but rather schedule in a way to maximize sharing opportunities. In multi-query optimization [26], the optimizer identifies the common work units in concurrent queries and either materializes them for later use [18] or creates pipelined plans
where operators in multiple queries directly interact with each other [11]. The concept of shared scans is often a base for such query plans [11]. When compared with our work, multi-query optimization is performed on a higher level, namely on the level of query processing operators that may be shared. Such operator sharing is even the cornerstone of the Q-Pipe architecture [14]. A related approach is multi-query execution (rather than optimization). The NonStop SQL/MX server [8] introduced a special SQL construct, named ‘TRANSPOSE’, that allows explicitly specifying multiple selection conditions and multiple aggregate computations in a single SQL query, which is executed internally as a single scan. Ideas close to our algorithms have been explored in research related to using tertiary storage. Sarawagi and Stonebraker [24] present a solution that reorders query execution to maximize data sharing among the queries. Yu and DeWitt [31] propose pre-executing a query to first determine the exact access pattern of a query and then exploit this knowledge to optimize the order of reads from a storage facility. Moreover, they use query batching to even further improve performance in a multi-query environment. Shoshani et al. [27] explore the multi-dimensional index structure to determine files interesting for queries and apply a simple file weighting based on the number of queries interested in it. This is a special-purpose system, while we attempt to integrate Cooperative Scans in (compressed column) database storage and query processing architectures. Ramamurthy and DeWitt recently proposed to use the actual buffer-pool content in the query optimizer for access path selection [22]. This idea can be extended for Cooperative Scans, where the optimizer could adjust the estimated scan cost looking at the currently running queries.
9.
CONCLUSIONS AND FUTURE WORK
In this paper we motivated and described the Cooperative Scans framework, that significantly enhances existing I/O scheduling policies for query loads that perform concurrent (clustered index) scans. One area where this is highly relevant is data warehousing, but (index) scan-intensive loads are found in many more application areas, such as scientific databases, search, and data mining. The Active Buffer Manager (ABM) coordinates the activities of multiple Cooperative Scan (CScan) queries in order to maximize I/O bandwidth reuse, while ensuring good query latency. We compared a number of existing scheduling policies (LRU,circular scans, elevator), and have shown that our new policy outperforms them consistently. We have shown the benefit of our approach in experiments using both row-wise storage (NSM or PAX) and columnwise storage (DSM). While column-stores have gained a lot of interest in recent years, we are not aware of significant previous work on I/O scheduling for column stores. One of our findings here is that DSM scheduling is much more complex, and efficient DSM I/O requires considerably more buffer space than NSM. Our new policy performs progressively better when buffer space is scarce, which plays to its advantage in DSM. We described how ABM can be implemented on top of a classical buffer manager and also discussed order-aware query processing despite out-of-order data delivery, which is a topic of ongoing research.
734
10.
REFERENCES
[1] D. Abadi, S. Madden, and M. Ferreira. Integrating compression and execution in column-oriented database systems. In Proc. SIGMOD, 2006. [2] D. J. Abadi, D. S. Myers, D. J. DeWitt, and S. R. Madden. Materialization strategies in a column-oriented dbms. In Proc. ICDE, 2007. [3] A. Ailamaki, D. DeWitt, M. Hill, and M. Skounakis. Weaving Relations for Cache Performance. In Proc. VLDB, 2001. [4] P. Boncz, M. Zukowski, and N. Nes. MonetDB/X100: Hyper-Pipelining Query Execution. In Proc. CIDR, 2005. [5] P. A. Boncz. Monet: A Next-Generation DBMS Kernel For Query-Intensive Applications. Ph.d. thesis, Universiteit van Amsterdam, May 2002. [6] C.-M. Chen and N. Roussopoulos. Adaptive database buffer allocation using query feedback. In Proc. VLDB, 1993. [7] H.-T. Chou and D. DeWitt. An Evaluation of Buffer Management Strategies for Relational Database Systems. In Proc. VLDB, 1985. [8] J. Clear et al. NonStop SQL/MX primitives for knowledge discovery. In Proc. KDD, 1999. [9] L. S. Colby et al. Redbrick vista: Aggregate computation and management. In Proc. ICDE, 1998. [10] C. Cook. Database Architecture: The Storage Engine, 2001. http://msdn.microsoft.com/library. [11] N. N. Dalvi, S. K. Sanghai, P. Roy, and S. Sudarshan. Pipelining in multi-query optimization. In Proc. PODS, 2001. [12] C. Faloutsos, R. Ng, and T. Sellis. Predictive load control for flexible buffer allocation. In Proc. VLDB, 1991. [13] S. Harizopoulos, V. Liang, D. Abadi, and S. Madden. Performance tradeoffs in read-optimized databases. In Proc. VLDB, 2006. [14] S. Harizopoulos, V. Shkapenyuk, and A. Ailamaki. Qpipe: a simultaneously pipelined relational query engine. In Proc. SIGMOD, 2005. [15] B. Kao and H. Garcia-Molina. An overview of real-time database systems. In S. H. Song, editor, Advances in Real-Time Systems, pages 463–486, 1995. [16] Y. Kotidis, Y. Sismanis, and N. Roussopoulos. Shared index scans for data warehouses. In Proc. DaWaK, 2001. [17] C. A. Lang, B. Bhattacharjee, T. Malkemus, S. Padmanabhan, and K. Wong. Increasing buffer-locality for multiple relational table scans through grouping and throttling. In ICDE, Istanbul, Turkey, 2007. [18] S. Manegold, A. Pellenkoft, and M. Kersten. A Multi-Query Optimizer for Monet. In Proc. BNCOD, 2000. [19] G. Moerkotte. Small materialized aggregates: A light weight index structure for data warehousing. In Proc. VLDB, 1998. [20] NCR Corp. Teradata Multi-Value Compression V2R5.0. 2002. [21] Netezza Inc. Netezza. http://www.netezza.com. [22] R. Ramamurthy and D. DeWitt. Buffer pool aware query optimization. In Proc. CIDR, 2005. [23] G. Sacco and M. Schkolnick. Buffer management in relational database systems. ACM Trans. Database Syst., 11(4), 1986. [24] S. Sarawagi and M. Stonebraker. Reordering query execution in tertiary memory databases. In Proc. VLDB, 1996. [25] B. Schroeder and G. Gibson. Disk failures in the real world: What does an mttf of 1,000,000 hours mean to you? In Proc. FAST, 2007. [26] P. S. Seshadri, S. Sudarshan, and S. Bhobe. Efficient and extensible algorithms for multi query optimization. In Proc. SIGMOD, 2000. [27] A. Shoshani et al. Multidimensional indexing and query coordination for tertiary storage management. In Proc. SSDBM, 1999. [28] M. Stonebraker et al. C-Store: A Column-oriented DBMS. In Proc. VLDB, 2005. [29] T. Teorey and T. Pinkerton. A comparative analysis of disk scheduling policies. Commun. ACM, 15(3), 1972. [30] Transaction Processing Performance Council. TPC Benchmark H version 2.1.0, 2002. [31] J.-B. Yu and D. DeWitt. Query pre-execution and batching in paradise: A two-pronged approach to the efficient processing of queries on tape-resident raster images. In Proc. SSDBM, 1997. [32] M. Zukowski, P. A. Boncz, and M. L. Kersten. Cooperative scans. Technical Report INS-E0411, CWI, December 2004. [33] M. Zukowski, S. Heman, N. Nes, and P. Boncz. Super-Scalar RAM-CPU Cache Compression. In Proc. ICDE, 2006.