mass-component star clusters using Fokker-Planck ... numerical integration of the orbit-averaged Fokker- ... where N5 ⡠N/105, M5 ⡠M/105 M®, and rh is the.
CORE-COLLAPSE TIMES OF TWO-COMPONENT STAR CLUSTERS
However, studying simpler models could be more instructive in identifying important physical processes governing the evolution. Kim, Lee, & Goodman (1997; hereafter KLG) studied on the postcollapse evolution of cluster variables and the gravitational oscillation using two-component Fokker-Planck models. In this paper, as a supplementary study to KLG, we present a fitting formula for the corecollapse times of two-component models and compare the results of two- and multi-component models. As in KLG, here both tidal-capture binary heating and tree-body binary heating are included, and clusters are assumed to be isotropic and isolated (no tidal cutoff). For the methods that we are using here and the benefits of studying simpler models (two-component models), readers are referred to KLG and references therein. Corecollapse times of two-component clusters were presented by Inagaki & Wiyanto (1984), Inagaki (1985), and Lee (1995) among others. These papers calculated corecollapse times as a function of M2 /M1 , the ratio of total masses of heavy component to light component, and found that the ratio of corecollapse time to initial half-mass relaxation time, tcc /trh , has a minimum value at M2 /M1 ∼ 0.1. However, the paramter M2 /M1 may be divided into m2 /m1 , the individual mass ratio, and N2 /N1 , the number ratio. In the present paper, we calculate the corecollapse times of two-component models as a fuction of more complete two-copmonent cluster parameters, and find a fitting formula between them. However, the clusters studied here are restricted to those with M1 ≫ M2 as in KLG. On the other hand, it would be helpful in interpreting the results of two-component models if the similarities and discrepancies between the results of two- and multi-component models are well known. In the present paper, we also compare two-component models to 11-component models, and thus provide a way to extrapolate to more realistic cluster the results of two-component clusters such as those in KLG.
arXiv:astro-ph/9711109v1 11 Nov 1997
Sungsoo S. Kim1 Dept. of Physics, Space Sci. Lab., Korea Advanced Institute of Science & Technology, Daejon, 305-701
and Hyung Mok Lee Department of Earth Sciences, Pusan National University, Pusan, 609-735
Abstract We examine the corecollapse times of isolated, twomass-component star clusters using Fokker-Planck models. With initial condition of Plummer models, we find that the corecollapse times of clusters with M1 /M2 ≫ 1 are well correlated with (N1 /N2 )1/2 (m1 /m2 )2 trh , where M1 /M2 and m1 /m2 are the light to heavy component total and individual mass ratios, respectively, N1 /N2 is the number ratio, and trh is the initial half-mass relaxation time scale. We also find two-component cluster parameters that best match multi-component (thus more realistic) clusters with power-law mass functions. Subject headings: celestial mechanics, stellar dynamics — globular clusters : general
1.
INTRODUCTION
The course of dynamical evolution of pre- and postcollapse globular clusters is determined by many factors such as initial mass function, nature and efficiency of energy generation mechanisms, tidal cut-off, anisotropy of velocity distribution, initial population of binaries, and stellar evolution. There have been many efforts in developing more and more complex cluster models including such factors, making analysis and interpretation rather difficult. To study the dynamical evolution of globular clusters more realistically, among others, Chernoff & Weinberg (1990) included the effects of stellar evolution, Lee, Falhman, & Richer (1991) used multi-component models, Takahashi (1995) includeded an anisotropic velocity distribution.
2.
CORE-COLLAPSE TIMES
To calculate the corecollapse times of two-component star clusters, we have performed total 11 runs of direct numerical integration of the orbit-averaged FokkerPlanck equation with a local approximation. The code used here is descended from Cohn (1980). Parameters of our two-component runs are shown in Table 1. This set of parameters has been chosen such
1 Most
of his work has been done at his previous affiliation, Institute for Basic Sciences, Pusan National University
1
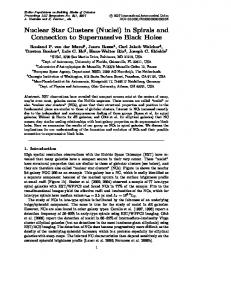
that it provides all possible combinations of parameters M , N , m2 /m1 , and N1 /N2 , where M is the cluster mass and N is the total number. Note that in all our runs, the total mass of heavy component, M2 , is negligible compared to the total mass of light component, M1 , and thus m1 ≈ M/N1 . The initial density and velocity profiles are given by Plummer models with vc1 /vc2 = 1 and ρc1 /ρc2 = M1 /M2 , where vc2 is the three-dimensional core velocity dispersion, and ρc is the core density. Corecollapse times of our runs are shown in Table 1 in units of 1010 yr and trh . We empirically found that tcc can be fitted by the following formula: �2 � �1/2 � m1 N1 9 tcc ≈ 4.2 × 10 yr N2 m2 � �3/2 rh −1/2 N5 M 5 , (1) 5 pc Fig. 1.— Corecollapse times of runs in Group A. N5 ≡ N/105 and M5 ≡ M/105 M⊙ .
where N5 ≡ N/105, M5 ≡ M/105 M⊙ , and rh is the initial half-mass radius. Each tcc value is plotted over the righthand side of the above equation in Figure 1, which shows a good X-Y correlation. Equation (1) is to be compared with the standard half-mass relaxation time scale,
and this complexity makes the theoretical interpretation of the above correlation between tcc and cluster parameters quite difficult. Here we suggest the following analysis as one way to explain this correlation. The actual duration of corecollapse is very small compared to the time to corecollapse from the begining of cluster’s evolution. Instead, clusters spend most of their precollapse phases under mass segregation process and approach to the onset of homologous phase of corecollapse. If a considerable degree of equipartition is accomplished in the precollapse phase as in all of our two-component models, the time to the onset of corecollapse will be determined by how fast the light component gains the energy from the heavy component via equipartition. Thus one may define the precollapse time scale of two-component clusters tr2 as following:
3/2
trh ≡
2 M 1/2 rh vm = , 2 hvk iv=vm 6.7G1/2 m ln 0.4N
(2)
where vm is the root-mean-square three-dimensional velocity of the whole cluster and hvk2 iv=vm is the aver2 age change of vm in parallel component to initial vm per unit time. Isolated single-mass clusters with initial condition of Plummer models collapse at 15.4 trh (Cohn 1980), where trh is the half-mass relaxation time scale and does not vary much until the corecollapse takes place. However, the ratios of the time required for corecollapse tcc to trh and core relaxation time scale trc strongly depend on the density and velocity profiles. Quinlan (1996) found that for single-mass clusters, tcc varies much less when expressed in units of trc divided by a dimensionless measure of the temperature gradient in the core. Although in single-mass clusters the velocity profile (as well as other physical parameters) evolves by the two-body relaxation, two- or multicomponent clusters have another driving force: the equipartition. Both mass segregation and equipartition are envolved in determination of the time to corecollapse,
tr2 ≡
2 vm1 2 i , hvk1 2
(3)
2 where hvk1 i2 is the velocity dispersion change of the light component via interactions with heavy component. Using the standard expression for the average velocity dispersion change per unit time, one has 2 i2 ∝ hvk1
2
G2 m2 ρm2 , vm2
(4)
Table 1 Parameters and Core-Collapse Times of Two-Component Models Run
m2 m1
baab caab faab cdab cbab caab1 caab2 baab3 faab3 caeb cabb
2 3 4 3 3 3 3 2 4 3 3
N1 N2
M ( M⊙ )
N
100 100 100 30 300 100 100 100 100 100 100
105 105 105 105 105 105 105 105 105 3 × 10⁴ 3 × 10⁵
141457 210125 277473 201299 212871 70042 630374 212185 208104 63037 630374
m2 ( M⊙ ) 1.4 1.4 1.4 1.4 1.4 3×1.4 1 3 ×1.4 2 3 ×1.4 4 3 ×1.4 1.4 1.4
tcc (1010 yr) 1.27 0.93 0.61 0.56 1.62 0.35 2.52 1.80 0.47 0.57 1.49
tcc /trh 12.42 6.34 3.23 3.97 10.92 6.47 6.28 12.17 3.23 6.34 6.43
Note.—The initial half-mass radii rh of these runs are all 5 pc.
where the heavy component mean density ρm2 is proportional to M2 /rh3 and the Coulomb logarithm has been omitted. It is also assumed that vm1 ∼ vm2 . Spitzer (1969, 1987) showed that for a two-component cluster of polytropic index n between 3 and 5 with M1 ≫ M2 and a Maxwellian velocity distribution in a parabolic potential well, the minimum degree of the global equipartition is a function of cluster’s parameters such that �5/3 � �2/3 � 2 m2 vm2 m2 N2 ∝ . (5) 2 m1 vm1 N1 m1 min
equation, we find that the degrees of equipartition in the precollapse phases of our two-component runs do not directly correlate with the minimum values of equation (5). In fact, exact equipartition is usually not accomplished even when the value of equation (5) is less than unity, because as mass segregation of heavy component progresses, interactions between heavy and light components occur less. Thus equation (5) should be regarded as a degree of tendancy to equipartition and it is this tendancy that tr2 requires in its definition. While Quinlan (1996) introduced a temperature gradient in the core in a derivative form to explain a huge variation in tcc for clusters with different initial profiles, here we introduced both density and velocity gradients of heavy component naturally into the time scale by considering global equipartition.
With the minimum value of equation (5) and as2 sumptions that M1 ≫ M2 and vm1 ∼ GM/rh , equation (3) now becomes tr2
∝
�
N1 N2
�2/3 �
m1 m2
�5/3
N M −1/2 rh
∝
�
N1 N2
�2/3 �
m1 m2
�5/3
trh .
3/2
3. (6)
COMPARISON WITH MULTICOMPONENT CLUSTERS
Clusters have continuous mass functions. However, mass functions are usually realized with discrete mass components in numerical calculations. Scientists found that 10 to 20 components are enough
The above is in the same form as equation (1) with only small discrepancies in the exponents. Although equation (5) has been used for derivation of the above 3
well known and the precise realization of real clusters is not our goal in this study. The mass range, representative mass, and number of stars of each component is shown in Table 3. Our multi-component models include both three-body binary heating and tidalcapture binary heating, but we find that the postcollapse phases of all our runs are driven by three-body binary heating. We find a two-component model which best describes a given multi-component model by comparing the values of cluster variables ρc , vc , rh at t = 1011 yr, and tcc . An epoch of 1011 yr has been selected as in KLG because by that time, our runs have reached self-similar expansion phase. With two-component models, KLG found the following numerical values:
to represent continuous mass functions for FokkerPlanck models, and such numerical representation for a given mass function is quite straightforward for these multi-component clusters: there is only a question of choice of each component’s mass bin and a representative value. However, when the number of components is reduced to 2 for the sake of analytical simplification, such choice is not so simple because dynamically important mass and corresponding number of stars may be different from simple mean mass and total number of a certain mass range. Therefore two-component cluster parameters (such as m2 /m1 , N1 /N2 , and N ) that well represent a continuous mass function should be numerically found through comparisons of the evolution of two- and multi-component clusters. In this section we will compare our multi-component models with the two-component models in KLG varying M and the mass function of the multi-component models. Cluster parameters of our multi-component models are given in Table 2. The initial density and velocity profiles are given by Plummer models. The initial half-mass radii of all multi- and two-component models are 5 pc. The number of component is 11 and we adopt a power-law mass function: N (m)dm ∝ m−(x+1) dm,
(7)
mib
mN (m)dm.
≃
4.5 × 10⁵ M⊙ /pc3
vc
≃
3.8 km/s
� �
rc
≃
0.042 pc
rh
≃
35 pc N5
m2 m1
m2 m1
−2/3
� m �−10/3 2
m1
�−1/2
�7/6
1/3
N5
−4/3
N5
1/3 0.65 t11 ,
M5
10/3 −2.0 t11 ; (9a)
N5
1/3 −0.32 t11 ;
M5
1/3 0.65 t11 ;
M5
(9b) (9c) (9d)
where N5 ≡ N/105, M5 ≡ M/105 M⊙ , and t11 ≡ t/1011 yr. On the other hand, the numerical values from our multi-component models are given in Table 2. There are four two-component parameters to be determined for a given multi-component model, m2 /m1 , N1 /N2 , N , and M . However, since cluster variables at a certain epoch in the postcollapse phase are independent of N1 /N2 as in equation (9), N1 /N2 has to be determined from the corecollapse time, equation (1). Then the rest three parameters, m2 /m1 , N , and M , may be determined from equation (9). This method will be called Method A, and parameters obtained in this way are given in Table 4. With Method A, our multi-component model B2 is best described by a two-component model with m2 /m1 = 2.3, N1 /N2 = 29, N = 1.4 × 10⁵ , and M = 0.97×10⁵ M⊙ . Note that with these parameters, m2 ≃ 1.6 M⊙ , which is little higher than the mass of the heaviest component of our multi-component models, 1.4 M⊙ . Neutron stars play an important role in dynamical evolution of globular clusters: a considerable fraction of dynamical binary formation (as apposed to primordial binaries) envolves neutron stars. For this reason, in two-component clusters, the heavy component is often targeted for neutron stars and the light component is for main-sequence stars. Thus in finding the best matching two-component parameters, it could be more meaningful if m2 is set to
where x is the mass spectral index and the Salpeter mass function has x = 1.35. For a bin i with boundaries mia and mib , the total mass in the bin is obtained by Z Mi =
ρc
(8)
mia
Then the number of stars in the bin is Ni = Mi /mi , where mi is the representative mass of each bin. The main-sequence star mass range was selected to be 0.08 M⊙ − 0.8 M⊙. Following Sigurdsson & Phinney (1995), the stars of initial mass mi between 0.8 M⊙ and 4.7 M⊙ were assumed to have evolved to white dwarfs of mass 0.58 + 0.22 × (mMS − 1.0) M⊙ , where mMS is the main-sequence mass, while stars of mMS between 4.7 M⊙ and 8.0 M⊙ were assumed to disrupt completely. The stars heavier than 8.0 M⊙ but lighter than 15.0 M⊙ were assumed to become neutron stars of mass 1.4 M⊙ . Neutron stars are born with a kick velocity due to an asymmetric explosion, and they are ejected from the cluster if the kick velocity is greater than the escape velocity of the cluster. However, we assumed that all neutron stars remain in the cluster, because the retention rate of neutron stars are not 4
Table 2 Parameters and Results of Multi-Component Models
Run
x
M ( M⊙ )
N
tcc (1010 yr)
A2 B2 C2 B1 B3
1.00 1.35 1.50 1.35 1.35
105 105 105 3 × 10⁴ 3 × 10⁵
402857 509201 552232 152760 1527603
0.528 0.584 0.621 0.356 0.931
Values at t = 1011 yr ρc vc rh ( M⊙ pc−3 ) (km s−1 ) (pc) 7.63 × 10⁴ 8.13 × 10⁴ 8.19 × 10⁴ 1.71 × 10³ 2.58 × 10⁶
2.79 2.75 2.73 1.30 5.44
32.8 27.7 26.2 38.5 20.7
Note.—The initial half-mass radii rh of these runs are all 5 pc.
Table 3 Mass Spectra of Multi-Component Models Bin 1 2 3 4 5 6 7 8 9 10 11
mi ( M⊙ ) 0.1 0.2 0.3 0.4 0.5 0.6 0.7 0.9 1.1 1.3 1.4
Mass Range ( M⊙ ) 0.08 0.15 0.25 0.35 0.45 0.55 0.65 0.80 1.0 1.2 1.4
– – – – – – – – – – –
0.15 0.25 0.35 0.45 0.55 0.65 0.80 1.0 1.2 1.4 1.4
Ni
x = 1.00 mi · N i
1.00000 0.40631 0.17842 0.09995 0.06385 0.11712 0.09010 0.02428 0.01286 0.00774 0.00913
1.00000 0.81262 0.53526 0.39980 0.31925 0.70272 0.63070 0.21852 0.14146 0.10062 0.12782
Ni
1.00000 0.33263 0.12584 0.06359 0.03753 0.05766 0.04104 0.00822 0.00389 0.00215 0.00182
Note.—Ni and mi · Ni are normalized with bin 1 values.
5
x = 1.35 mi · N i 1.00000 0.66526 0.37752 0.25436 0.18765 0.34596 0.28728 0.07398 0.04279 0.02795 0.02548
Ni
x = 1.50 mi · N i
1.00000 0.30517 0.10826 0.05223 0.02985 0.04264 0.02945 0.00516 0.00232 0.00124 0.00091
1.00000 0.61034 0.32478 0.20892 0.14925 0.25584 0.20615 0.04644 0.02552 0.01612 0.01274
Table 4 Best Matching Two-Component Cluster Parameters
Run
m2 m1
Method A N1 N5 N2
M5
m2 m1
N1 N2
A2 B2 C2 B1 B3
1.78 2.33 2.56 2.74 2.05
13.1 28.5 39.4 53.9 18.1
0.90 0.97 0.99 0.35 2.49
1.70 2.17 2.36 2.37 2.00
10.9 21.3 28.4 30.0 16.3
1.05 1.40 1.54 0.51 3.47
Method B N5 M5 1.00 1.30 1.41 0.44 3.38
0.82 0.84 0.84 0.26 2.36
N2 8400 5800 4800 1400 20000
Note.—N5 ≡ N/105 and M5 ≡ M/105 M⊙ . N2 has been approximately calculated by N/(N1 /N2 + 1) and has only two significant digits.
1.4 M⊙ . With a restriction of m2 = 1.4 M⊙, now the number of variables in equation (9) required for determination of two-component cluster parameters is reduced to two. Since ρc and rh are two cluster variables that represent the status of the core and envelope, respectively, we use these variables along with m2 = 1.4 M⊙ and equation (1) for our second method (Method B) to find the best matching two-component model (see Table 4). With Method B, model B2 is now best described by a two-component model with m2 /m1 = 2.2, N1 /N2 = 21, N = 1.3 × 10⁵ , and M = 0.84 × 10⁵ M⊙ . Note that with these parameters, N2 = 4890 and this value is about the same with the number of stars in the heaviest four P bins (bins only for degenerate stars) of model B2 ( i=8,11 Ni = 5176). This may imply that the epoch of corecollapse is mainly determined by the number of stars above the turnoff mass. This fact also holds for other runs with different M and x. For clusters with N ∝ M (as for our multicomponent clusters B1, B2, and B3), equation (9) may be written as ρc ∝ M 10/3 , vc ∝ M 2/3 , and rh ∝ M −1/3 . From runs B1, B2, and B3 in Table 2, ρc , vc , and rh are found to be proportional to M 3.18 , M 0.622 , and M −0.269 , respectively. The absolute values of these exponents are little smaller than equation (9). However, since the discrepancies are not so significant, we conclude that the evolution aspects of the postcollapse multi-component clusters are still
well predictable from the numerical and analytical results of two-component clusters. On the other hand, cluster variable values at t = 1011 yr show relatively small x dependence. The results from Method B in Table 4 indicate that multi-component clusters may be described by two-component clusters with masses 15 to 20 % less and with m1 near the turnoff mass. Of course, this m1 is dependent on x such that clusters with steeper mass function are matched by two-component clusters with smaller m1 . However, interestingly, lighter multi-component clusters with the same x also require smaller m1 . This comes from the fact that N ∝ M holds for runs B1, B2, and B3, while not for their matching two-component clusters by Method B (N ∝ M 0.92 ). For Method A, the best matching two-component clusters of runs B1, B2, and B3 show N ∝ M 0.98 , which results in nearly the same m1 . Thus we conclude that the above difference in m1 values by Method B for clusters with the same x stems from the restriction, m2 = 1.4 M⊙. The evolution of the two-component model with the above parameters is plotted in Figure 2 as well as that of model B2. Cluster variables ρc , vc and rh of two runs well coincide. Only the corecollapse times show a small discrepancy. This is partly because of the dispersion of tcc from the fitting formula, equation (1), and partly because of the small N1 /N2 value: equation (1) is to be used for clusters with M1 ≫ M2 .
6
S. S. K. thanks Chang Won Lee and Jung-Sook Park for obtaining old and rare papers. This research was supported in part by the Matching Fund Programs of Research Institute for Basic Sciences, Pusan National University, RIBS-PNU-96-501, and in part by Basic Science Researech Institute Program to Pusan National University under grant No. 95-2413. REFERENCES Chernoff, D. F. & Weinberg, M. 1990, ApJ, 351, 121 Cohn, H. N. 1980, ApJ, 242, 765 Inagaki, S., & Wiyanto, P. 1984, PASJ, 36, 391 Inagaki, S. 1985, in IAU Symposium 113, Dynamics of star clusters, ed. J. Goodman and P. Hut (Dordrecht: Reidel), p. 189 Kim, S. S., Lee, H. M., & Goodman, J. 1997, submitted to ApJ Fig. 2.— Comparison of the evolution of multicomponent model (run B2; thick lines) and bestmatching two-component model by Method B (m2 /m1 = 2.2, N1 /N2 = 21, N = 1.3 × 10⁵ , and M = 0.84 × 10⁵ M⊙ ; thin lines). The units of ρc , vc , and rh are M⊙ pc−3 , km s−1 , and pc, respectively.
Lee, H. M. 1995, MNRAS, 272, 605 Lee, H. M., Fahlman, G. G., & Richer, H. B. 1991, ApJ, 366, 455 Quinlan, G. D. 1996, New Astronomy, 1, 255 Sigurdsson, S., & Phinney, E. S. 1995, ApJS, 99, 609 Spitzer, L. Jr. 1969, ApJ, 158, L139
4.
Spitzer, L. Jr. 1987, Dynamical Evolution of Globular Clusters (Princeton: Princeton University Press)
SUMMARY
We have investigated the evolution of isolated twocomponent clusters with initial condition of Plummer models. The corecollapse time tcc showed a good correlation with a parameter (N1 /N2 )1/2 (m1 /m2 )2 trh . To explain this correlation, a new time scale for the precollapse evolution of two-component clusters, tr2 ≡ (N1 /N2 )2/3 (m1 /m2 )5/3 trh have been introduced using Spitzer’s (1969, 1987) global equipartition analysis. We also found two-component clusters which best match with our multi-component clusters with powerlaw mass functions. For example, the evolution of 11-component cluster with a Salpeter mass function and M = 105 M⊙ was well described by a twocomponent cluster with m2 /m1 = 2.2, N1 /N2 = 21, N = 1.3 × 10⁵ , and M = 0.84 × 10⁵ M⊙ . Furthermore, it has been found that the best matching two-component cluster has N2 very close to the number of stars heavier than turnoff mass of the multicomponent cluster.
Takahashi, K. 1995, PASJ, 47, 561
This 2-column preprint was prepared with the AAS LATEX macros v4.0.
7