catalysts Article
Core-Shell MnO2-SiO2 Nanorods for Catalyzing the Removal of Dyes from Water Wei Gong, Xianling Meng, Xiaohong Tang and Peijun Ji * Department of Chemical Engineering, Beijing University of Chemical Technology, Beijing 100029, China;
[email protected] (W.G.);
[email protected] (X.M.);
[email protected] (X.T) * Correspondence:
[email protected]; Tel.:+86-10-64423254 Academic Editor: Keith Hohn Received: 23 November 2016; Accepted: 28 December 2016; Published: 6 January 2017
Abstract: This work presented a novel core-shell MnO2 @m-SiO2 for catalyzing the removal of dyes from wastewater. MnO2 nanorods were sequentially coated with polydopamine (PDA) and polyethyleneimine (PEI) forming MnO2 @PDA-PEI. By taking advantage of the positively charged amine groups, MnO2 @PDA-PEI was further silicificated, forming MnO2 @PDA-PEI-SiO2 . After calcination, the composite MnO2 @m-SiO2 was finally obtained. MnO2 nanorod is the core and mesoporous SiO2 (m-SiO2 ) is the shell. MnO2 @m-SiO2 has been used to degrade a model dye Rhodamine B (RhB). The shell m-SiO2 functioned to adsorb/enrich and transfer RhB, and the core MnO2 nanorods oxidized RhB. Thus, MnO2 @m-SiO2 combines multiple functions together. Experimental results demonstrated that MnO2 @m-SiO2 exhibited a much higher efficiency for degradation of RhB than MnO2 . The RhB decoloration and degradation efficiencies were 98.7% and 84.9%, respectively. Consecutive use of MnO2 @m-SiO2 has demonstrated that MnO2 @m-SiO2 can be used to catalyze multiple cycles of RhB degradation. After six cycles of reuse of MnO2 @m-SiO2 , the RhB decoloration and degradation efficiencies were 98.2% and 71.1%, respectively. Keywords: MnO2 nanorods; polydopamine; dyes; SiO2
1. Introduction Dyes are widely used in the textiles, cosmetics, paper, leather, ceramics, and inks industries [1,2]. It is estimated that 15% of the dye is lost during processes and is released in wastewater [2]. Dye pollutants are an important source of environmental contamination and cause significant pollution to groundwater [3]. Dyes are generally resistant to light and moderate oxidative agents. Without proper treatment, these dyes can be stable in the water for a much longer period of time [4]. A number of physical and physicochemical technologies have been developed for the removal of dyes from aqueous solutions, including adsorption techniques [3,4], membrane processes [5,6], and degradation of dyes through oxidation under the assistant of catalysts [7–10]. Various materials have been used as adsorbents for the removal of dyes, such as biocoagulants [1], fruit peels [3], and cellulose-based bioadsorbents [4]. Mesoporous silica materials with a low toxicity have high specific areas and large interior spaces. Dye molecules can be entrapped in silica nanoparticles and films [11–14]. Silica-based materials, carboxylic acid-functionalized silica [15,16], silica-alumina oxide [17], silica hydrogels [18], mesoporous silica [19,20], and carboxymethyl tamarind-g-poly(acrylamide)/silica [21] have been investigated as adsorbents for removing dyes from wastewater. Except for the physical adsorption methods, removing dyes can be accomplished through oxidation, such as electrooxidation [22], photocatalytic degradation [23], and oxidation by graphene oxide nanosheet-based material [24]. Manganese oxides are highly reactive minerals and have oxidation capacities for organic compounds [25]. Because of the relatively low cost and environmental
Catalysts 2017, 7, 19; doi:10.3390/catal7010019
www.mdpi.com/journal/catalysts
Catalysts 2017, 7, 19
2 of 11
Catalysts 2017, 7, 19
2 of 11
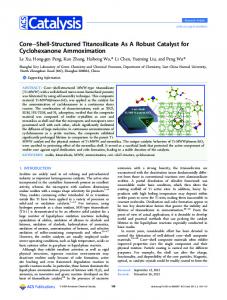
compatibility, manganese oxides—for example, acid-activated MnO2 [26], α-MnO2 nanowires [27], manganese dioxide nanosheets [28], and manganese oxides with hollow nanostructures [29]—have manganese dioxide nanosheets [28], and manganese oxides with hollow nanostructures [29]—have been been investigated for oxidative degradation of dyes. investigated for oxidative degradation of dyes. this work, a novel core‐shell catalytic material 2@m‐SiO 2 for oxidative degradation InIn this work, a novel core-shell catalytic material MnO2MnO @m-SiO degradation of dyesof 2 for oxidative dyes has been developed. Scheme 1 illustrates the preparation route for the composite MnO has been developed. Scheme 1 illustrates the preparation route for the composite MnO2 @m-SiO22.@m‐SiO MnO2 2. MnO2 were nanorods were with first coated with polydopamine form MnO2@PDA, and (PEI) then nanorods first coated polydopamine to form MnO2 @PDA,to and then polyethyleneimine polyethyleneimine (PEI) was bound to MnO 2@PDA, forming MnO 2@PDA‐PEI. Further silicification was bound to MnO2 @PDA, forming MnO2 @PDA-PEI. Further silicification of this material formed ◦ C, MnO of this material formed MnO 2@PDA‐PEI‐SiO . After calcination under 400 °C, MnO 2@m‐SiO 2 was MnO calcination under 2400 prepared. This material 2 @PDA-PEI-SiO 2 . After 2 @m-SiO 2 was prepared. This tomaterial been dye utilized to degrade a model dye Rhodamine (RhB). The has been utilized degradehas a model Rhodamine B (RhB). The mesoporous m-SiO2 B layer on the mesoporous m‐SiO2 layer on the surface of the composite adsorbed and RhB; the RhB surface of the composite adsorbed and enriched RhB; the RhB molecules wereenriched transported through molecules were transported through the mesoporous m‐SiO the mesoporous m-SiO2 layer by diffusion, and then the MnO22 layer by diffusion, and then the MnO nanorods catalyzed the degradation 2 ofnanorods catalyzed the degradation of RhB. RhB.
Scheme 1. Schematic illustration of preparation of MnO 2@m‐SiO Scheme 1. Schematic illustration of preparation of MnO2 @m-SiO 2 . 2.
2. 2. Results and Discussion Results and Discussion
2.1. Preparation of MnO 2@m‐SiO 2.1. Preparation of MnO2 @m-SiO 2 2 Scheme 1 illustrates the procedures for the preparation of MnO 2@m‐SiO 2. MnO 2 nanorods were Scheme 1 illustrates the procedures for the preparation of MnO2 @m-SiO were 2 . MnO 2 nanorods coated with a thin film polydopamine (PDA) form MnO 2 @PDA by impregnating the MnO coated with a thin film of of polydopamine (PDA) to to form MnO @PDA by impregnating the MnO 2 2 2 nanorods in the dopamine solution, in which polymerization of dopamine occurred at an alkaline nanorods in the dopamine solution, in which polymerization of dopamine occurred at an alkaline condition. PDA one kind of amine. catechol When was MnO 2@PDA added to the condition. PDA is oneis kind of catechol Whenamine. MnO2 @PDA added to thewas polyethyleneimine polyethyleneimine (PEI) solution, PEI was bound to PDA through Michael addition of amines on the (PEI) solution, PEI was bound to PDA through Michael addition of amines on the unsaturated indole unsaturated indole rings and Schiff base formation reactions between the amines and catechols [30]. rings and Schiff base formation reactions between the amines and catechols [30]. Thus, MnO2 @PDA Thus, MnO 2@PDA was coated PEI forming MnO2@PDA‐PEI. positively charged amine was coated with PEI forming MnOwith The positively charged The amine groups on the surface 2 @PDA-PEI. groups on the surface of MnO 2 @PDA‐PEI provide prerequisites for further silicification [31]. When of MnO2 @PDA-PEI provide prerequisites for further silicification [31]. When MnO2 @PDA-PEI was MnOto 2@PDA‐PEI was added to the solution of TEOS, electrostatic interactions occurred between the added the solution of TEOS, electrostatic interactions occurred between the positively charged amine positively amine charged groups silicic of PEI and negatively silicic ofacid resulted from of the groups of PEIcharged and negatively acid resulted from charged the hydrolysis the methyl groups hydrolysis of the methyl groups of TEOS [31]. Protonated and nonprotonated amine groups of the TEOS [31]. Protonated and nonprotonated amine groups of the PEI chains formed hydrogen bonds PEI chains formed hydrogen bonds with the oxygen, facilitating the formation of Si–O–Si bonds. Thus, with the oxygen, facilitating the formation of Si–O–Si bonds. Thus, MnO2 @PDA-PEI was silicificated MnO 2@PDA‐PEI was silicificated and MnO 2@PDA‐PEI‐SiO 2 was formed. The composite MnO 2@m‐ and MnO MnO2 @m-SiO 2 @PDA-PEI-SiO2 was formed. The composite 2 was obtained after calcination ◦ SiO2 was obtained after calcination under 400 °C. under 400 C. InIn the FTIR spectra, as illustrated in Figure 1, the band centered at 1588 cm the FTIR spectra, as illustrated in Figure 1, the band centered at 1588 cm−−11 was assigned to was assigned ring C=C and ring C=N stretching modes [32], confirming that MnO 2 was coated with PDA, forming to ring C=C and ring C=N stretching modes [32], confirming that MnO2 was coated with PDA, MnO2@PDA. When PEI was bound to MnO 2@PDA forming MnO 2@PDA‐PEI, the band at 1291 cm forming MnO2 @PDA. When PEI was bound to MnO2 @PDA forming MnO2 @PDA-PEI, the band at −1 appeared, which was ascribed to the stretching vibration of C–N of primary and secondary amines 1291 cm−1 appeared, which was ascribed to the stretching vibration of C–N of primary and secondary −1 was ascribed to the vibration of Si–O–Si bonds [34], resulting from the [33]. The band at 1097 cm amines [33]. The band at 1097 cm−1 was ascribed to the vibration of Si–O–Si bonds [34], resulting silicification of MnO 2@PDA‐PEI. After calcination under 400 °C forming MnO 2@m‐SiO 2, the bands at from the silicification of MnO2 @PDA-PEI. After calcination under 400 ◦ C forming MnO 2 @m-SiO2 , −1 were significantly − 1 1605 and 1586 cm reduced, indicating the removal of PEI and PDA after the the bands at 1605 and 1586 cm were significantly reduced, indicating the removal of PEI and PDA −1 − 1 calcination. As a result, the band at 1097 cm became prominent. after the calcination. As a result, the band at 1097 cm became prominent.
Catalysts 2017, 7, 19 Catalysts 2017, 7, 19 Catalysts 2017, 7, 19
3 of 11 3 of 11 3 of 11
Figure 1. FTIR spectra of MnO 2, MnO2@PDA, MnO2@PDA‐PEI, MnO2@PDA‐PEI‐SiO2 and MnO2@m‐ Figure 1. FTIR spectra of 2MnO MnO2 @PDA, MnO2 @PDA-PEI, MnO2 @PDA-PEI-SiO and 2 ,2@PDA, MnO 22@m‐ Figure 1. FTIR spectra of MnO , MnO 2@PDA‐PEI, MnO 2@PDA‐PEI‐SiO 2 and MnO SiO 2. PDA: polydopamine; PEI: polyethyleneimine MnO 2 @m-SiO2 . PDA: polydopamine; PEI: polyethyleneimine SiO 2. PDA: polydopamine; PEI: polyethyleneimine
Figure 2 shows the XPS spectra of MnO2, MnO2@PDA, MnO2@PDA‐PEI, MnO2@PDA‐PEI‐SiO2, Figure 2 shows the XPS spectra of MnO @PDA, MnO Figure 2 shows the XPS spectra of MnO 2,, MnO MnO 2@PDA, MnO22@PDA‐PEI, MnO @PDA-PEI, MnO22@PDA‐PEI‐SiO @PDA-PEI-SiO22, , and MnO2@m‐SiO2. The spectrum of MnO22@PDA 2shows that the intensity of oxygen is relatively and shows that the intensity of oxygen is and MnO MnO22@m‐SiO @m-SiO2. 2 .The Thespectrum spectrumof ofMnO MnO2@PDA @PDA shows that the intensity of oxygen is relatively relatively 2 increased compared to that of MnO2, and the peaks for carbon and nitrogen appeared. After coating increased compared to that of MnO increased compared to that of MnO22, and the peaks for carbon and nitrogen appeared. After coating , and the peaks for carbon and nitrogen appeared. After coating PEI onto MnO2@PDA, the intensities of carbon and nitrogen were relatively increased. After the PEI relatively increased. increased. After PEI onto onto MnO22@PDA, @PDA, the the intensities intensities of of carbon carbon and and nitrogen nitrogen were were relatively After the the silicification of MnO2@PDA‐PEI, the peak intensity of oxygen was relatively increased, and the peaks silicification of MnO silicification of MnO22@PDA‐PEI, the peak intensity of oxygen was relatively increased, and the peaks @PDA-PEI, the peak intensity of oxygen was relatively increased, and the peaks of Si2s and Si2p appeared. After calcination forming MnO2@m‐SiO2, the peak intensities of carbon of Si2s and Si2p appeared. After calcination forming MnO of Si2s and Si2p appeared. After calcination forming MnO22@m‐SiO @m-SiO22, the peak intensities of carbon , the peak intensities of carbon and nitrogen were significantly decreased, indicating that most of the PDA and PEI were removed. and nitrogen were significantly decreased, indicating that most of the PDA and PEI were removed. and nitrogen were significantly decreased, indicating that most of the PDA and PEI were removed.
Figure 2. XPS spectra of MnO2, MnO2@PDA, MnO2@PDA‐PEI, MnO2@PDA‐PEI‐SiO2 and MnO2@m‐ Figure 2. XPS spectra of MnO 2, MnO2@PDA, MnO2@PDA‐PEI, MnO2@PDA‐PEI‐SiO2 and MnO2@m‐ Figure SiO 2. 2. XPS spectra of MnO2 , MnO2 @PDA, MnO2 @PDA-PEI, MnO2 @PDA-PEI-SiO2 and MnO2 @m-SiO2 . SiO2.
Figure 3 shows the XPS spectra of Mn 2p3/2 region for MnO @PDA, and MnO Figure 3 shows the XPS spectra of Mn 2p3/2 region for MnO22,, MnO MnO22@PDA, and MnO22@m‐SiO @m-SiO22. . Figure 3 shows the XPS spectra of Mn 2p3/2 region for MnO 2, MnO 2@PDA, and MnO2@m‐SiO2. 3+ 4+ 3+ 4+ The peaks around 641.4 and 642.4 eV are assigned to Mn The peaks around 641.4 and 642.4 eV are assigned to Mn 3+ and Mn and Mn , respectively [35]. The surface , respectively [35]. The surface The peaks around 641.4 and 642.4 eV are assigned to Mn and Mn4+, respectively [35]. The surface 3+3+ 4+ for MnO 4+ element ratio of Mn to Mn 2 was 0.230. After coating PDA on MnO 2, the surface element element ratio of Mn to Mn for MnO2 was 0.230. After coating PDA on MnO2 , the surface element ratio of Mn3+ to Mn4+ for MnO2 was 0.230. After coating PDA on MnO 2, the surface element ratio was increased to 0.72. This is due to the redox reaction between MnO 2 and dompamine. After element ratio was increased to 0.72. This is due to the redox reaction between MnO2 and dompamine. ratio was increased to 0.72. This is due to the redox reaction between MnO2 and dompamine. After ◦ 2 by calcination under 400 °C, the surface element removing PDA and PEI from MnO After removing PDA and PEI from2@PDA‐PEI‐SiO MnO2 @PDA-PEI-SiO 2 by calcination under 400 C, the surface 2@PDA‐PEI‐SiO2 by calcination under 400 °C, the surface element removing PDA and PEI from MnO 3+ 4+ 4+ for ratio of Mn to Mn Mn3+ to for MnO 2@m‐SiO was 0.232, which almost equal to that 2. It is element ratio of Mn MnO 2@m-SiO 0.232, is which is almost equal tofor thatMnO for MnO 2 was 2. ratio of Mn3+ to Mn4+ for MnO2@m‐SiO22 was 0.232, which is almost equal to that for MnO2. It is indicated that the oxidation state of Mn of MnO 2 @m‐SiO 2 has changed little in comparison to that for It is indicated that the oxidation state of Mn of MnO2 @m-SiO2 has changed little in comparison to that indicated that the oxidation state of Mn of MnO2@m‐SiO2 has changed little in comparison to that for MnO 2. for MnO 2. MnO 2.
Catalysts 2017, 7, 19 Catalysts 2017, 7, 19
4 of 11 4 of 11
Catalysts 2017, 7, 19
4 of 11
Figure fitted Mn 2p3/2 XPS XPS spectra of MnO 2, MnO 2@PDA, and Figure 3. 3. Non‐normalized Non-normalizedand andcurve curve fitted Mn 2p3/2 spectra of MnO 2 , MnO2 @PDA, MnO 2@m‐SiO 2. and MnO 2 @m-SiO 2. Figure 3. Non‐normalized and curve fitted Mn 2p3/2 XPS spectra of MnO2, MnO2@PDA, and 2@m‐SiO2. The MnO nitrogen adsorption–desorption isotherm of MnO2 and MnO2@m‐SiO2, and
Nitrogen adsorbed (cm33/g)
the The nitrogen adsorption–desorption isotherm of MnO2 and MnO2 @m-SiO2 , and the corresponding Barrete–Joynere–Halenda (BJH) pore size distribution are presented in Figure 4. The corresponding Barrete–Joynere–Halenda (BJH) pore size distribution are2@m‐SiO presented in Figure 4. The nitrogen adsorption–desorption isotherm of MnO 2 and MnO 2, and the isotherm of MnO 2@m‐SiO2 displayed a hysteresis loop within the relative pressure range of 0.5–0.9 corresponding Barrete–Joynere–Halenda (BJH) pore size distribution are presented in Figure 4. The The isotherm of MnO2 @m-SiO2 displayed a hysteresis loop within the relative pressure range of (Figure 4a), indicating the presence of mesoporous pores in the sample of MnO 2@m‐SiO2. The pore isotherm of MnO 2@m‐SiO2 displayed a hysteresis loop within the relative pressure range of 0.5–0.9 0.5–0.9 (Figure 4a), indicating the presence of mesoporous pores in the sample of MnO2 @m-SiO2 . size distributions of the two samples (Figure 4b) were calculated by desorption isotherm using the (Figure 4a), indicating the presence of mesoporous pores in the sample of MnO 2@m‐SiO2. The pore The pore size distributions of the two samples (Figure 4b) were calculated by desorption isotherm Barrete–Joynere–Halenda method [36]. For the sample of MnO 2, there was a small peak around 2.6 size distributions of the two samples (Figure 4b) were calculated by desorption isotherm using the using the Barrete–Joynere–Halenda method [36]. For the sample of MnO2 , there was a small peak Barrete–Joynere–Halenda method [36]. For the sample of MnO 2, there was a small peak around 2.6 nm. For the sample of MnO 2@m‐SiO2, there was a sharp peak around 3.8 nm. On the basis of the N 2 around 2.6 nm. For the sample of MnO2 @m-SiO2 , there was a sharp peak around 3.8 nm. On the nm. For the sample of MnO2@m‐SiO2, there was a sharp peak around 3.8 nm. On the basis of the N 2 adsorption–desorption isotherms, the BET surface area of MnO 2 and MnO2@m‐SiO2 were determined basis of the N2 adsorption–desorption isotherms, the BET surface area 2of MnO22 were determined and MnO2 @m-SiO2 and MnO @m‐SiO to be adsorption–desorption isotherms, the BET surface area of MnO 33.2 m2/g and 51.7 m2/g, 2respectively. The increase in 2BET surface area for MnO2@m‐SiO2 is 2 /g, wereto determined to be 33.2 m /g and 51.7 m respectively. The increase in BET surface area 2 2 be 33.2 m /g and 51.7 m /g, respectively. The increase in BET surface area for MnO 2@m‐SiO2 is ascribed to the shell being mesoporous SiO2. A larger specific surface area of MnO2@m‐SiO2 is for MnO ascribed to the shell being mesoporous SiO specific surface2 area ascribed to the shell being mesoporous SiO2. A larger specific surface area of MnO2@m‐SiO is of 2 @m-SiO 2 is 2 . A larger beneficial for adsorbing and removing dyes. MnObeneficial for adsorbing and removing dyes. 2 @m-SiO2 is beneficial for adsorbing and removing dyes. Nitrogen adsorbed (cm /g)
150 150
aa MnO2 MnO MnO2@m-SiO @m-SiO2 MnO 2 2
100 100
50
50
0
Desorption dV/dD pore volume Desorption3 dV/dD pore volume (cm /nm/g) 3
0 0.0 0.0
0.2
0.6
0.8
Relative pressure (P/P0)
0.016
MnO2@m-SiO2 MnO2
0.016
1.0
1.0
b
b
MnO2@m-SiO2 MnO2
/nm/g) (cm
0.4
0.2Relative 0.4pressure 0.6(P/P ) 0.8 0
0.008
0.008
0.000
0
20
40
60
80
100
Pore Diameter(nm)
120
140
0.000
0 20 40 60 80 100for MnO 120 140 Figure 4. Nitrogen adsorption (a) and desorption (b) isotherms 2 and MnO 2@m‐SiO2.
Figure 4. Nitrogen adsorption (a) and desorption (b) isotherms for MnO2 and MnO2 @m-SiO2 . Pore Diameter (nm)
Figure 4. Nitrogen adsorption (a) and desorption (b) isotherms for MnO2 and MnO2@m‐SiO2.
Catalysts 2017, 7, 19
5 of 11
2.2. Catalytic Degradation of RhB with MnO2 @m-SiO2 The degradation of rhodamine B (RhB) was carried out by immersing MnO2 @m-SiO2 in the Catalysts 2017, 7, 19 5 of 11 for the RhB solutions. To have a comparison, MnO2 and MnO2 @PDA-PEI-SiO2 were also used degradation/removal of RhB. During the processes, three obvious peaks of UV-Vis spectra were 2.2. Catalytic Degradation of RhB with MnO2@m‐SiO2 monitored at different immersion times of the materials. The peak at 554 nm is due to the presence of The degradation of rhodamine B (RhB) was carried out by immersing MnO2@m‐SiO2 in the RhB C=N and C=O groups of RhB (Figure 5). The peak at 499 nm is due to N-deethylated intermediate solutions. To have a comparison, MnO2 and MnO2@PDA‐PEI‐SiO2 were also used for the products of RhB. The decrease in absorbance at 259 nm is ascribed to theof degradation of the aromatic degradation/removal of RhB. During the processes, three obvious peaks UV‐Vis spectra were part of monitored at different immersion times of the materials. The peak at 554 nm is due to the presence RhB [37]. The intensities of the absorbance at 554 and 259 nm were used to calculate the decolorization and degradation efficiencies, respectively. of C=N and C=O groups of RhB (Figure 5). The peak at 499 nm is due to N‐deethylated intermediate products of RhB. The decrease in absorbance at 259 nm is ascribed to the degradation of the aromatic Concomitant with the UV-Vis spectra, the photographs of decoloration of the RhB solutions of RhB [37]. The intensities of the at 554 259 nm be were used to observed. calculate the are alsopart presented. Thus, the progress ofabsorbance decoloration ofand RhB can directly The RhB decolorization and degradation efficiencies, respectively. decoloration efficiencies after 2 min were 98.7%, 64.9%, and 7.0% for MnO2 @m-SiO2 , MnO2 , Concomitant with the UV‐Vis spectra, the photographs of decoloration of the RhB solutions are and MnO respectively. These quantitative results aredirectly consistent with the 2 @PDA-PEI-SiO 2 , the also presented. Thus, progress of decoloration of RhB can be observed. The decoloration RhB results as illustrated by the upright photographs. When using MnO and MnO @m-SiO (Figure decoloration efficiencies after 2 min were 98.7%, 64.9%, and 7.0% for 2, MnO and 5a,c), 2 MnO2@m‐SiO 2 2 2, MnO2@PDA‐PEI‐SiO 2, respectively. These quantitative consistent with the decoloration the absorbance at 499 nm indicated the formation of results are N-deethylated intermediate products. This results as illustrated by the upright photographs. When using MnO 2@m‐SiO2 (Figure 5a,c), confirmed that both MnO2 and MnO2 @m-SiO2 can oxidize RhB.2 and MnO While using MnO2 @PDA-PEI-SiO2 , the absorbance at 499 nm indicated the formation of N‐deethylated intermediate products. This the absorbance at 499 nm was not observed, indicating that MnO2 @PDA-PEI-SiO2 could not oxidize confirmed that both MnO2 and MnO2@m‐SiO2 can oxidize RhB. While using MnO2@PDA‐PEI‐SiO2, RhB, and the decoloration is due to the adsorption of RhB. After 90 min, the RhB degradation the absorbance at 499 nm was not observed, indicating that MnO2@PDA‐PEI‐SiO2 could not oxidize efficiencies 61.2% and 84.9%, respectively. The degradation results in Figure 5 2 and MnOis 2 @m-SiO 2 were RhB, for and MnO the decoloration due to the adsorption of RhB. After 90 min, the RhB demonstrated that MnO22@m-SiO exhibited a much higher efficiency for the degradation of RhB than efficiencies for MnO and MnO22@m‐SiO 2 were 61.2% and 84.9%, respectively. The results in Figure 5 2@m‐SiO2 exhibited a much higher efficiency for the degradation of RhB than MnO2 . demonstrated that MnO It has been also demonstrated that MnO2 @PDA-PEI-SiO2 adsorbed RhB from its aqueous MnO 2. It has been also demonstrated that MnO2@PDA‐PEI‐SiO2 adsorbed RhB from its aqueous solutions but did not degrade RhB. This is possibly due to fact that the PDA and PEI films have solutions but did not degrade RhB. This is possibly due to fact that the PDA and PEI films have prevented the contacting of RhB with MnO2 . prevented the contacting of RhB with MnO2.
Figure 5. Cont.
Catalysts 2017, 7, 19 Catalysts 2017, 7, 19
6 of 11 6 of 11
Figure 5. UV‐Vis spectra of the rhodamine B solution at different immersion times for MnO2 (a),
Figure 5. UV-Vis spectra of the rhodamine B solution at different immersion times for MnO2 (a); MnO2@PDA‐PEI‐SiO2 (b), and MnO2@m‐SiO2 (c). MnO2 @PDA-PEI-SiO2 (b); and MnO2 @m-SiO2 (c). The photographs correspond to respective UV‐Vis spectra. The figures in blue show the efficiencies of RhB decoloration/degradation. The efficiency of RhB decoloration is defined as A efficiencies The photographs correspond to respective UV-Vis spectra. The figures in blue show the A /A ; A and A are the absorbances of the RhB solutions at 554 nm at initial time and after dec dec of RhB decoloration/degradation. The efficiency of RhB decoloration is defined as (A0 − Adec 90 ) /A0 ; A /A ; A and 90 min, respectively. The efficiency of RhB degradation is defined as A Adec and Adec the absorbances of the RhB solutions at 554 nm at initial time and after 90 min, 0 90 are the absorbances of the RhB solutions at 259 nm at the initial min, A are deg time degand after deg 90 deg deg respectively. The efficiency of RhB degradation is defined as (A0 −2@m‐SiO A90 )/A and A90 2, MnO2@PDA‐PEI‐SiO2, and MnO 2 were 5 mg/mL, respectively. The concentrations of MnO 0 ; A0 are the and the concentration of RhB was 5 mg/mL. absorbances of the RhB solutions at 259 nm at the initial time and after 90 min, respectively.
The concentrations of MnO2 , MnO2 @PDA-PEI-SiO2 , and MnO2 @m-SiO2 were 5 mg/mL, and the 2.3. Mechanism for Degradation of RhB with MnO2@m‐SiO2 concentration of RhB was 5 mg/mL. The TEM images in Figure 6, showing the morphology for MnO2, MnO2@PDA‐PEI‐SiO2, and
2.3. Mechanism for Degradation of RhB with MnO2@m‐SiO 2 can help understand the MnO advantages of MnO 2@m‐SiO2 over MnO2. By sequentially 2 @m-SiO 2 coating PDA and PEI and further silicification, a dense film was clearly observed on MnO2@PDA‐
The TEM2 (Figure 6b). As mentioned above, the film of PDA‐PEI‐SiO images in Figure 6, showing the morphology2 prevented the contacting of RhB for MnO2 , MnO2 @PDA-PEI-SiO2 , PEI‐SiO and MnO the advantages of MnO2 @m-SiO2 over MnO2 . with the MnO 2 nanorods. As a result, MnO 2@PDA‐PEI‐SiO 2 could not degrade RhB. The film of PDA‐ 2 @m-SiO 2 can help understand PEI‐SiO2 became mesoporous 2 by removing the PDA‐PEI coatings through under By sequentially coating PDA andSiO PEI and further silicification, a dense filmcalcination was clearly observed 400 °C. A tiny gap between the MnO 2As core and the mesoporous SiO 2film shell was generated as shown in on MnO @PDA-PEI-SiO (Figure 6b). mentioned above, the of PDA-PEI-SiO prevented the 2 2 2 Figure 6c. Scheme 2 schematically illustrates the processes for the degradation of RhB by using contacting of RhB with the MnO2 nanorods. As a result, MnO2 @PDA-PEI-SiO2 could not degrade MnO2@m‐SiO2. RhB molecules were first adsorbed and enriched on the surface of MnO2@m‐SiO2. RhB. The film of PDA-PEI-SiO2 became mesoporous SiO2 by removing2 (m‐SiO the PDA-PEI coatings through Then, the RhB molecules were transferred through the mesoporous SiO 2) into the tiny gap ◦ calcination under 400 C. 2A tiny gap between the MnO2 core and the mesoporous SiO2 shell was region between m‐SiO and MnO 2 nanorods, and were then degraded by the MnO 2 nanorods. The generated as shown in Figure 6c. Scheme 2 schematically illustrates the processes for the degradation enrichment of RhB was due to the adsorption capability of SiO 2 for dyes [11]. Mesoporous silica has of RhB demonstrated being capable of entrapping dye molecules [19]. Herein, the diffusion transfer of RhB by using MnO2 @m-SiO2 . RhB molecules were first adsorbed and enriched on the surface of through 2 (m‐SiO2) was driven by the concentration differential of RhB, as the MnO2 @m-SiO2mesoporous . Then, theSiO RhB molecules were transferred through the mesoporous SiO2 (m-SiO2 ) concentration of RhB inside the tiny gap region was always kept lower due to the continuous into the tiny gap region between m-SiO2 and MnO2 nanorods, and were then degraded by the MnO2 degradation of RhB by the MnO2 nanorods. The composite MnO2@m‐SiO2 with a core‐shell structure nanorods. The enrichment of RhB was due to the adsorption capability of SiO2 for dyes [11]. Mesoporous combines the multiple functions together, including adsorption/enrichment, transfer and oxidation silica has demonstrated being capable of entrapping dye molecules [19]. Herein, the diffusion transfer of RhB. The synergistic effect of the multiple functions facilitated and promoted the degradation of of RhB RhB. through mesoporous driven by the concentration RhB, as the Thus, MnO2@m‐SiOSiO 2 exhibited a much efficiency for degradation differential of RhB than of MnO 2. 2 (m-SiO 2 ) washigher Figure 7 shows the consecutive use of MnO 2 @m‐SiO 2 for the degradation of RhB. After six cycles of concentration of RhB inside the tiny gap region was always kept lower due to the continuous degradation of MnO MnO2@m‐SiO 2, the RhB decoloration and degradation efficiencies were 98.2% and 71.1%, of RhB reuse by the 2 nanorods. The composite MnO2 @m-SiO2 with a core-shell structure combines respectively, indicating a good reusability of MnO2@m‐SiO2. the multiple functions together, including adsorption/enrichment, transfer and oxidation of RhB. The synergistic effect of the multiple functions facilitated and promoted the degradation of RhB. Thus, MnO2 @m-SiO2 exhibited a much higher efficiency for degradation of RhB than MnO2 . Figure 7 shows the consecutive use of MnO2 @m-SiO2 for the degradation of RhB. After six cycles of reuse of MnO2 @m-SiO2 , the RhB decoloration and degradation efficiencies were 98.2% and 71.1%, respectively, indicating a good reusability of MnO2 @m-SiO2 .
Catalysts 2017, 7, 19
7 of 11
Catalysts 2017, 7, 19
7 of 11
Catalysts 2017, 7, 19
7 of 11
a: MnO2 a: MnO2
2@PDA‐PEI‐SiO2 b: MnO b: MnO2@PDA‐PEI‐SiO2
c: MnO2@m‐SiO2
c: MnO2@m‐SiO2
Figure 6. TEM images for MnO2, MnO2@PDA‐PEI‐SiO2, and MnO2@m‐SiO2. (a) MnO2 nanorods; (b)
Figure 6. TEM images for MnO2 , MnO2 @PDA-PEI-SiO2 , and MnO2 @m-SiO2 . (a) MnO2 nanorods; By sequentially coating PDA and PEI and further silicification, a dense film was clearly observed on Figure 6. TEM images for MnO 2, MnO2@PDA‐PEI‐SiO2, and MnO2@m‐SiO2. (a) MnO2 nanorods; (b) (b) ByMnO sequentially coating PDA and PEI and further silicification, a dense2 by removing the PDA‐ film was clearly observed 2@PDA‐PEI‐SiO 2; (b) The film of PDA‐PEI‐SiO 2 became mesoporous SiO By sequentially coating PDA and PEI and further silicification, a dense film was clearly observed on PEI coatings through calcination under 400°C. A tiny gap between the MnO 2 core and the mesoporous on MnO @PDA-PEI-SiO ; (b) The film of PDA-PEI-SiO became mesoporous SiO2 by removing the 2 2 2 MnO2@PDA‐PEI‐SiO 2; (b) The film of PDA‐PEI‐SiO 2 became mesoporous SiO 2 by removing the PDA‐ ◦ C. A tiny gap between the MnO core and the SiO2 shell was generated (c). PDA-PEI coatings through calcination under 400 2 PEI coatings through calcination under 400°C. A tiny gap between the MnO2 core and the mesoporous mesoporous SiO2 shell was generated (c). 2 shell was generated (c). SiO
Scheme 2. Schematic presentation of the process for the degradation of RhB using MnO2@m‐SiO2.
Scheme 2. Schematic presentation of the process for the degradation of RhB using MnO Scheme 2. Schematic presentation of the process for the degradation of RhB using MnO22@m‐SiO @m-SiO22. .
Catalysts 2017, 7, 19 Catalysts 2017, 7, 19
8 of 11 8 of 11
a
b
Figure use use of MnO 2@m‐SiO 2 for RhB decoloration (a) and degradation (b). The Figure7. 7.Consecutive Consecutive of MnO 2 @m-SiO2 for RhB decoloration (a) and degradation (b). 2 @m‐SiO 2 in the solution of RhB was 60 min for each cycle. immersion time of MnO The immersion time of MnO2 @m-SiO2 in the solution of RhB was 60 min for each cycle.
3. Experimental Section 3. Experimental Section 3.1. Materials 3.1. Materials Dopamine hydrochloride (98%) and PEI were purchased from Sigma‐Aldrich (Shanghai, China) Dopamine hydrochloride (98%) and PEI were purchased from Sigma-Aldrich (Shanghai, China) and used 2OO 2SO 4 were and usedas as received. received. TEOS, TEOS, MnSO MnSO44∙H ·H2O, , andHH purchasedfrom fromSinopharm Sinopharm 2 O,KK2Cr 2 Cr 2 7, 7and 2 SO 4 werepurchased Chemical Reagent Co. (Shanghai, China). All chemicals are analytical grade or higher, and they were Chemical Reagent Co. (Shanghai, China). All chemicals are analytical grade or higher, and they were used as received without any further purification. used as received without any further purification. 3.2. Preparation of MnO2@m‐SiO 3.2. Preparation of MnO 2 and Synthesis of MnO 2 Nanoroads 2 @m-SiO 2 and Synthesis of MnO 2 Nanoroads
·H2 O and 2.354 g2Cr For the experiment, 4.056 g of MnSO of2OK7 were mixed in 30 mL double‐ For the experiment, 4.056 g of MnSO 4∙H24 O and 2.354 g of K 2 Cr2 O7 were mixed in 30 mL double-distilled water. In addition, 3.0 mL H SO was then added dropwise under stirring for distilled water. In addition, 3.0 mL H2SO4 was then added dropwise under stirring for 30 min. Then, 2 4 30 min. Then, the solution was transferred to a 50 mL Teflon-lined autoclave. The autoclave was sealed the solution was transferred to a 50 mL Teflon‐lined autoclave. The autoclave was sealed and heated and heated in an oven at 120 ◦ C for 12 h. When cooled to room temperature, the resulting brown-black in an oven at 120 °C for 12 h. When cooled to room temperature, the resulting brown‐black precipitate precipitate was collected by filtering through a polycarbonate membrane (0.22 µm), and washed with was collected by filtering through a polycarbonate membrane (0.22 μm), and washed with double‐ double-distilled water. MnO2 nanorods were finally obtained after drying at 80 ◦ C overnight. distilled water. MnO 2 nanorods were finally obtained after drying at 80 °C overnight. 3.3. Preparation of MnO2@PDA 2 @PDA 3.3. Preparation of MnO The experiment included 100 mg of MnO2 nanoroads being added into 100 mL Tris‐buffer buffer 2 nanoroads being added into 100 mL Tris-buffer buffer The experiment included 100 mg of MnO (pH 8.5) under sonication for 15 min, and then 100 mg mg dopamine dopamine were were added. added. The Themixture mixturewas was (pH 8.5) under sonication for 15 min, and then 100 sonicated at room temperature for 5 min. The polydopamine-coated MnO nanorods were collected 2 sonicated at room temperature for 5 min. The polydopamine‐coated MnO2 nanorods were collected by centrifugation at 8000 g for 10 min, and washed with 30 mL double-distilled water. MnO22@PDA @PDA by centrifugation at 8000 g for 10 min, and washed with 30 mL double‐distilled water. MnO nanorods were finally obtained after vacuum-freeze drying for 5 h. nanorods were finally obtained after vacuum‐freeze drying for 5 h. 3.4. Preparation of MnO2@PDA‐PEI 2 @PDA-PEI 3.4. Preparation of MnO Forthe theexperiment, experiment,50 50mg mg MnO was added to the aqueous solution (25 2.0 mL, 2 @PDA For MnO 2@PDA was added to the PEI PEI aqueous solution (25 mL, 2.0 mg/mL). After sonication for 15 min, MnO @PDA-PEI was collected by filtering through a 450 nm 2 mg/mL). After sonication for 15 min, MnO2@PDA‐PEI was collected by filtering through a 450 nm ◦ polycarbonate membrane and then was dried at 80 C with nitrogen-blowing. polycarbonate membrane and then was dried at 80 °C with nitrogen‐blowing. 3.5. Preparation of MnO2 @m-SiO2 3.5. Preparation of MnO2@m‐SiO2 A solution consisting of 25 mL water and 5 mL TEOS was prepared. Furthermore, 50 mg A solution consisting of 25 mL water and 5 mL TEOS was prepared. Furthermore, 50 mg MnO2 @PDA-PEI was added to the solution and sonicated at room temperature. After 40 min, MnO2@PDA‐PEI was added to the solution and sonicated at room temperature. After 40 min, the the formed MnO2 @PDA-PEI-SiO2 was collected by filtering through a 450 nm polycarbonate membrane formed MnO2@PDA‐PEI‐SiO 2 was collected by filtering through a 450 nm polycarbonate membrane and then was dried at 80 ◦ C with nitrogen-blowing. Then, MnO2 @PDA-PEI-SiO2 was calcined at and then was dried at 80 °C with nitrogen‐blowing. Then, MnO2@PDA‐PEI‐SiO2 was calcined at 400 ◦ C in air in order to remove PEI and PDA. After 4 h, the formed MnO2 @m-SiO2 was collected. 400 °C in air in order to remove PEI and PDA. After 4 h, the formed MnO2@m‐SiO2 was collected.
3.6. Characterization and Measurement
Catalysts 2017, 7, 19
9 of 11
3.6. Characterization and Measurement XPS spectra were measured using an X-ray photoelectron spectrometer (Thermo VG ESCALAB250, Beijing, China). The measurement was carried out at the pressure of 2 × 10⁻⁹ Pa. Mg K X-ray was used as the excitation source. UV-Vis spectra were measured on a Shimadzu spectrophotometer (UV2550-PC, Beijing, China). The BET methodology was utilized to calculate the specific surface area. The pore size distribution were derived from the desorption or adsorption branches of isotherms using the BJH model [36]. Infrared spectra were measured using an FTIR spectrometer (Bruker TENSOR 27, Beijing, China). A horizontal temperature-controlled attenuated total reflectance (ATR) with Zn Se Crystal was used. A liquid-nitrogen-cooled mercury-cadmium-telluride detector collected 128 scans per spectrum, and the resolution was 2 cm−1 . The ATR element spectrum was used as the background. Ultrapure nitrogen gas was introduced to purge water vapor. 3.7. Catalytic Activity Measurements MnO2 @m-SiO2 was used to degrade the model dye RhB. Furthermore, 5 mg MnO2 @m-SiO2 was added into 10 mL of RhB solution with an initial concentration of 5 mg/mL. The pH was adjusted to be 2.5. MnO2 @m-SiO2 was well dispersed in the RhB solutions under sonication. After some time, the mixture was centrifuged at 8000 g to separate MnO2 @m-SiO2 from the solutions. The supernatant was subjected to UV-Vis spectra measurement using a UV-Vis spectrophotometer (UV2550-PC, Beijing, China). In order to explain the degradation process, MnO2 and MnO2 @PDA-PEI-SiO2 have also been used to degrade/remove RhB at the same procedures and conditions. 4. Conclusions A novel core-shell MnO2 @m-SiO2 has been prepared, consisting of MnO2 nanorod as the core and mesoporous SiO2 (m-SiO2 ) as the shell. MnO2 @m-SiO2 has been used to degrade a model dye RhB. The shell m-SiO2 functions to adsorb/enrich RhB and then to transfer RhB into the tiny gap region between the core and shell, and the core MnO2 nanorod oxidizes the transferred RhB. The composite MnO2 @m-SiO2 combines the multiple functions together. Owing to the synergistic effect of the multiple functions, MnO2 @m-SiO2 has exhibited a much higher efficiency for degradation of RhB than MnO2 . Consecutive use of MnO2 @m-SiO2 has demonstrated that MnO2 @m-SiO2 can be used to catalyze multiple cycles of RhB degradation with a good recyclability at ambient temperature. Acknowledgments: This work was supported by the National Science Foundation of China (21476023). Author Contributions: Peijun Ji provided the idea and design for the study. Wei Gong, Xianling Meng, and Xiaohong Tang performed the experiments. Wei Gong and Xianling Meng drafted the manuscript, and Peijun Ji revised it. Conflicts of Interest: The authors declare no conflict of interest.
References 1.
2.
3. 4.
Zarei-Chaleshtori, M.; Correa, V.; López, N.; Ramos, M.; Edalatpour, R.; Rondeau, N.; Chianelli, R.R. Synthesis and Evaluation of Porous Semiconductor Hexaniobate Nanotubes for Photolysis of Organic Dyes in Wastewater by. Catalysts 2014, 4, 346–355. [CrossRef] Junejo, Y.; Sirajuddin; Baykal, A.; Safdar, M.; Balouch, A. A Novel Green Synthesis and Characterization of AgNPs with its Ultra-Rapid Catalytic Reduction of Methyl Green Dye. Appl. Surf. Sci. 2014, 290, 499–503. [CrossRef] Mallampati, R.; Li, X.; Adin, A.; Valiyaveettil, S. Fruit Peels as Efficient Renewable Adsorbents for Removal of Dissolved Heavy Metals and Dyes from Water. ACS Sustain. Chem. Eng. 2015, 3, 1117–1124. [CrossRef] Giovannetti, R.; Rommozzi, E.; Anna, C.; Zannotti, M. Kinetic Model for Simultaneous Adsorption/ Photodegradation Process of Alizarin Red S in Water Solution by Nano-TiO2 under Visible Light. Catalysts 2016, 6, 84. [CrossRef]
Catalysts 2017, 7, 19
5.
6.
7.
8.
9.
10.
11.
12. 13. 14. 15.
16.
17.
18.
19. 20. 21.
22.
23.
10 of 11
Liu, X.; Zhang, Q.; Yu, B.; Wu, R.; Mai, J.; Wang, R.; Chen, L.; Yang, S. Preparation of Fe3 O4 /TiO2 /C Nanocomposites and Their Application in Fenton-Like Catalysis for Dye Decoloration. Catalysts 2016, 6, 146. [CrossRef] Ge, Q.; Wang, P.; Wan, C.; Chung, T.S. Polyelectrolyte-Promoted Forward Osmosis-Membrane Distillation (FO-MD) Hybrid Process for Dye Wastewater Treatment. Environ. Sci. Technol. 2012, 4, 6236–6243. [CrossRef] [PubMed] Dalui, A.; Thupakula, U.; Khan, A.H.; Ghosh, T.; Satpati, B.; Acharya, S. Mechanism of Versatile Catalytic Activities of Quaternary CuZnFeS Nanocrystals Designed by a Rapid Synthesis Route. Small 2015, 11, 1829–1839. [CrossRef] [PubMed] Sinha, A.K.; Pradhan, M.; Sarkar, S.; Pal, T. Large-Scale Solid-State Synthesis of Sn-SnO2 Nanoparticles from Layered SnO by Sunlight: A Material for Dye Degradation in Water by Photocatalytic Reaction. Environ. Sci. Technol. 2013, 47, 2339–2345. [CrossRef] [PubMed] Teng, F.; Liu, Z.; Zhang, A.; Li, M. Photocatalytic Performances of Ag3 PO4 Polypods for Degradation of Dye Pollutant under Natural Indoor Weak Light Irradiation. Environ. Sci. Technol. 2015, 49, 9489–9494. [CrossRef] [PubMed] Cheng, Z.; Liao, J.; He, B.; Zhang, F.; Zhang, F.; Huang, X.; Zhou, L. One-Step Fabrication of Graphene Oxide Enhanced Magnetic Composite Gel for Highly Efficient Dye Adsorption and Catalysis. ACS Sustain. Chem. Eng. 2015, 3, 1677–1685. [CrossRef] Rampazzo, E.; Bonacchi, S.; Montalti, M.; Prodi, L.; Zaccheroni, N. Self-Organizing Core−Shell Nanostructures: Spontaneous Accumulation of Dye in the Core of Doped Silica Nanoparticles. J. Am. Chem. Soc. 2007, 129, 14251–14256. [CrossRef] [PubMed] Cohen, B.; Martin, C.; Iyer, S.K.; Wiesner, U.; Douhal, A. Single Dye Molecule Behavior in Fluorescent Core–Shell Silica Nanoparticles. Chem. Mater. 2012, 24, 361–372. [CrossRef] Feil, F.; Cauda, V.; Bein, T.; Bräuchle, C. Direct Visualization of Dye and Oligonucleotide Diffusion in Silica Filaments with Collinear Mesopores. Nano Lett. 2012, 12, 1354–1361. [CrossRef] [PubMed] Synak, A.; Bojarski, P.; Grobelna, B.; Kułak, L.; Lewkowicz, A. Determination of Local Dye Concentration in Hybrid Porous Silica Thin Films. J. Phys. Chem. C 2013, 117, 11385–11392. [CrossRef] Tsai, C.H.; Chang, W.C.; Saikia, D.; Wu, C.E.; Kao, H.M. Functionalization of Cubic Mesoporous Silica SBA-16 with Carboxylic Acid via One-Pot Synthesis Route for Effective Removal of Cationic Dyes. J. Hazard. Mater. 2016, 309, 236–248. [CrossRef] [PubMed] Deka, J.R.; Liu, C.L.; Wang, T.H.; Chang, W.C.; Kao, H.M. Synthesis of Highly Phosphonic Acid Functionalized Benzene-Bridged Periodic Mesoporous Organosilicas for Use as Efficient Dye Adsorbents. J. Hazard. Mater. 2014, 278, 539–550. [CrossRef] [PubMed] Wawrzkiewicz, M.; Wi´sniewska, M.; Gun'ko, V.M.; Zarko, V.I. Adsorptive Removal of Acid, Reactive and Direct Dyes from Aqueous Solutions and Wastewater Using Mixed Silica–Alumina Oxide. Powder Technol. 2014, 278, 306–315. [CrossRef] Perullini, M.; Jobbágy, M.; Japas, M.L.; Bilmes, S.A. New Method for the Simultaneous Determination of Diffusion and Adsorption of Dyes in Silica Hydrogels. J. Colloid Interface Sci. 2014, 425, 91–95. [CrossRef] [PubMed] Kohno, Y.; Haga, E.; Yoda, K.; Shibata, M.; Fukuhara, C.; Tomita, Y. Adsorption Behavior of Natural Anthocyanin Dye on Mesoporous Silica. J. Phys. Chem. Solids 2014, 75, 48–51. [CrossRef] Malfatti, L.; Kidchob, T.; Aiello, D.; Aiello, R.; Testa, F.; Innocenzi, P. Aggregation States of Rhodamine 6G in Mesostructured Silica Films. J. Phys. Chem. C 2008, 112, 16225–16230. [CrossRef] Pal, S.; Ghorai, S.; Das, C.; Samrat, S.; Ghosh, A.; Panda, A.B. Carboxymethyl Tamarind-gpoly(acrylamide)/Silica: A High Performance Hybrid Nanocomposite for Adsorption of Methylene Blue Dye. Ind. Eng. Chem. Res. 2012, 51, 15546–15556. [CrossRef] Valero, D.; Ortiz, J.M.; Expósito, E.; Montiel, V.; Aldaz, A. Electrochemical Wastewater Treatment Directly Powered by Photovoltaic Panels: Electrooxidation of a Dye-Containing Wastewater. Environ. Sci. Technol. 2010, 44, 5182–5187. [CrossRef] [PubMed] Sarkar, A.K.; Saha, A.; Tarafder, A.; Panda, A.B.; Pal, S. Efficient Removal of Toxic Dyes via Simultaneous Adsorption and Solar Light Driven Photodegradation Using Recyclable Functionalized Amylopectin−TiO2 −Au Nanocomposite. ACS Sustain. Chem. Eng. 2016, 4, 1679–1688. [CrossRef]
Catalysts 2017, 7, 19
24.
25. 26. 27.
28.
29. 30. 31. 32. 33.
34. 35. 36. 37.
11 of 11
Jiao, T.F.; Zhao, H.; Zhou, J.; Zhang, Q.; Luo, X.; Hu, J.; Peng, Q.; Yan, X. Self-Assembly Reduced Graphene Oxide Nanosheet Hydrogel Fabrication by Anchorage of Chitosan/Silver and Its Potential Efficient Application toward Dye Degradation for Wastewater Treatments. ACS Sustain. Chem. Eng. 2015, 3, 3130–3139. [CrossRef] Remucal, C.K.; Ginder-Vogel, M. A Critical Review of the Reactivity of Manganese Oxides with Organic Contaminants. Environ. Sci. Prog. Impacts 2014, 16, 1247–1266. [CrossRef] [PubMed] Das, M.; Bhattacharyya, K.G. Oxidation of Rhodamine B in Aqueous Medium in Ambient Conditions with Raw and Acid-Activated MnO2 , NiO, ZnO as Catalysts. J. Mol. Catal. A Chem. 2014, 391, 121–129. [CrossRef] Ramesh, M.; Nagaraja, H.S.; Rao, M.P.; Anandan, S.; Huang, N.M. Fabrication, Characterization and Catalytic Activity of α-MnO2 Nanowires for Dye Degradation of Reactive Black 5. Mater. Lett. 2016, 172, 85–89. [CrossRef] Sun, H.; Xu, K.; Huang, M.; Shang, Y.; She, P.; Yin, S.; Liu, Z. One-Pot Synthesis of Ultrathin Manganese Dioxide Nanosheets and Their Efficient Oxidative Degradation of Rhodamine B. Appl. Surf. Sci. 2015, 357, 69–73. [CrossRef] Hao, X.; Zhao, J.; Zhao, Y.; Ma, D.; Lu, Y.; Guo, J.; Zeng, Q. Mild Aqueous Synthesis of Urchin-Like MnOx, Hollow Nanostructures and Their Properties for RhB Degradation. Chem. Eng. J. 2013, 229, 134–143. [CrossRef] Popgeorgievski, O.; Verreault, D.; Diesner, M.O.; Proks, V.; Heissler, S.; Rypáˇcek, F. Nonfouling Poly(ethylene oxide) Layers End-Tethered to Polydopamine. Langmuir 2012, 28, 14273–14283. [CrossRef] [PubMed] Begum, G.; Rana, R.K.; Singh, S.; Satyanarayana, L. Bioinspired Silicification of Functional Materials: Fluorescent Monodisperse Mesostructure Silica Nanospheres. Chem. Mater. 2010, 22, 551–556. [CrossRef] Zangmeister, R.A.; Morris, T.A.; Tarlov, M.J. Characterization of Polydopamine Thin Films Deposited at Short Times by Autoxidation of Dopamine. Langmuir 2013, 29, 8619–8628. [CrossRef] [PubMed] Gasnier, A.; Pedano, M.L.; Gutierrez, F.; Labbé, P.; Rivas, G.A.; Rubianes, M.D. Glassy Carbon Electrodes Modified with a Dispersion of Multi-Wall Carbon Nanotubes in Dopamine-Functionalized Polyethylenimine: Characterization and Analytical Applications for Nicotinamide Adenine Dinucleotide Quantification. Electrochim. Acta 2012, 71, 73–81. [CrossRef] Silverstein, R.; Bassler, G.; Morrill, R. Spectrometric Identification of Organic Compounds; John Wiley & Sons: New York, NY, USA, 1981. Briggs, D.; Seah, M.P. Practical Surface Analysis, 2nd ed.; John Willey & Sons: New York, NY, USA, 1993; Volume 1. Barrett, E.P.; Joyner, L.G.; Halenda, P.P. The Determination of Pore Volume and Area Distributions in Porous Substances. I. Computations from Nitrogen Isotherms. J. Am. Chem. Soc. 1951, 73, 373–380. [CrossRef] Daneshvar, N.; Behnajady, M.A.; Mohammadi, M.K.A.; Dorraji, M.S.S. UV/H2 O2 Treatment of Rhodamine B in Aqueous Solution: Influence of Operational Parameters and Kinetic Modeling. Desalination 2008, 230, 16–26. [CrossRef] © 2017 by the authors; licensee MDPI, Basel, Switzerland. This article is an open access article distributed under the terms and conditions of the Creative Commons Attribution (CC-BY) license (http://creativecommons.org/licenses/by/4.0/).