Published online October 3, 2006
Corn Yield and Nitrate Loss in Subsurface Drainage from Midseason Nitrogen Fertilizer Application D. B. Jaynes* and T. S. Colvin of the Midwest comes from corn– soybean production. These same studies indicate that the primary pathway for this NO3 to enter surface waters is through the discharge of subsurface drains (tiles) that are common across the Midwest Corn Belt (Zucker and Brown, 1998). Thus, it is not surprising that the area within the Mississippi River watershed identified by Goolsby et al. (2001) as the primary source of NO3 to the Gulf is the same area where corn production on artificially drained lands is prevalent. Numerous suggestions have been made on how to reduce NO3 leaching from tile-drained lands in the Midwest (Dinnes et al., 2002). A common strategy is to fine tune N fertilizer application rates to the N need of the crop. Optimum N rates can vary greatly among years based on mineralization rates of soil organic matter and the leaching and denitrification of soil NO3. To compensate for this yearly variation, a reactive strategy has been proposed where soil NO3 measurements made a few weeks after corn emergence are used to determine the proper N rate for a side-dress application. The presidedress soil NO3 test (Magdoff et al., 1984) and the late spring soil NO3 test (Blackmer et al., 1989) are examples of this approach. Splitting N fertilizer application between planting and early season, with the rate for the second application determined by a soil test, can dramatically reduce NO3 leaching at field (Bjorneberg et al., 1998; Guillard et al., 1999; Mitchell et al., 2000; Bakhsh et al., 2002) and watershed scales (Jaynes et al., 2004). The requirement and cost of soil sampling, however, greatly limits the feasibility of this approach for most farmers. To avoid soil sampling, plant-based monitoring systems have been proposed for determining N content and sufficiency in plants and determining the proper N rate at side-dressing. Most of these systems rely on measuring the chlorophyll content of leaves, which is directly related to N content and can be used to infer N need. Hand-held chlorophyll meters have been shown to be correlated with leaf N content (Schepers et al., 1992) and have been used to determine the N rate for sidedressing (Piekielek and Fox, 1992). Frequently, however, chlorophyll meters could not identify N deficiencies until after the V6 to V12 crop stage (Ritchie et al., 1996), which delays N application until midseason at the earliest (Blackmer and Schepers, 1995; Siambi et al., 1999; Binder et al., 2000). Rather than using hand-held chlorophyll meters, many investigators have shown that spectral sensors mounted on airplanes can be used to measure different levels of N stress in corn (Blackmer et al., 1996; Blackmer and White, 1998; Goel et al., 2003; Hendrickson et al., 2002).
Reproduced from Agronomy Journal. Published by American Society of Agronomy. All copyrights reserved.
ABSTRACT Whether in response to remotely sensed plant N status or as a rescue treatment when previously applied N has been lost to denitrification or leaching, there is growing interest in applying N to corn at midseason. While the yield benefits of this practice are variable, little information is available as to the impacts of midseason N application on water quality. We compared grain yields and NO3 losses in drainage water as a result of applying N either once after emergence or equally split between just after emergence and midseason (V16). Nitrogen treatments consisted of 199 (H), 138 (M), and 69 (L) kg ha21 applied postemergence (V1–V3), and 69 kg ha21 applied postemergence and again at midseason (R). Grain yield for corn (Zea mays L.) and soybean [Glycine max (L.) Merr.], grown in a 2-yr rotation, and drainage water NO3 concentrations were measured on replicated tile-drained plots in a producer’s field from 2002 through 2005. Midseason application of additional N resulted in 0.9 and 2.5 Mg ha21 greater yield than the L treatment in 2002 and 2004, respectively; however, yield was greater when the same total amount of N was applied in one application shortly after emergence (M treatment) vs. the split treatment. There was no carryover effect on subsequent soybean yields for any of the N treatments. Annual flow-weighted NO3 concentrations in tile drainage were consistently greater (0.3–1.3 mg L21) for the R treatment than the M treatment and significantly greater when averaged across all years. Residual soil NO3 at the end of the year also indicated that some of the midseason N application was not taken up by the crop and was available for leaching. Thus, midseason N application was beneficial for recovering some of the potential yield in corn when initial N applications are insufficient for optimum yield, but the practice did not benefit water quality in this study compared with a single application at emergence.
W
ITHIN the Midwest Corn Belt, NO3 concentrations in surface waters often exceed the 10 mg L21 maximum contaminant level (MCL) for drinking water set by the USEPA (Jaynes et al., 1999; Mitchell et al., 2000). This has led some cities that rely on surface water for their drinking supply to install denitrification systems to remove NO3, causing increased expense for water treatment (Dinnes et al., 2002). Excessive NO3 in the Mississippi River has also been identified as a leading cause of hypoxia in the northern Gulf of Mexico (Rabalais et al., 1996). Numerous studies at the field and watershed scale (David et al., 1997; Goolsby et al., 1999; Jaynes et al., 1999) have shown that much of the NO3 in surface waters
USDA-ARS, National Soil Tilth Lab., 2150 Pammel Dr., Ames, IA 50011. Names are necessary to report factually on available data; however, the USDA neither guarantees nor warrants the standard of the product, and the use of the name by USDA implies no approval of the product to the exclusion of others that may also be suitable. Received 13 Feb. 2006. *Corresponding author (
[email protected]). Published in Agron. J. 98:1479–1487 (2006). Nitrogen Management doi:10.2134/agronj2006.0046 ª American Society of Agronomy 677 S. Segoe Rd., Madison, WI 53711 USA
Abbreviations: MCL, maximum contaminant level; UAN, urea– ammonium nitrate.
1479
Reproduced from Agronomy Journal. Published by American Society of Agronomy. All copyrights reserved.
1480
AGRONOMY JOURNAL, VOL. 98, NOVEMBER–DECEMBER 2006
This approach appears most sensitive to detecting N deficiencies later in the season after canopy closure minimizes reflectance from the soil surface and because N deficiencies often do not develop in corn plants until later in the season. Thus, to use remotely sensed crop N deficiencies in a reactive N management scheme, sidedressing of N would have to be delayed until midseason when useful remotely sensed data can be obtained. This necessitates side-dressing of N later than what is usually practiced, at a time when corn plants are 1 to 2 m tall, thus requiring a high-clearance applicator. This approach was used by Hendrickson and Han (2000), who used multispectral images collected in early July to determine N rates applied several weeks later at V16 to anthesis. They demonstrated that a uniform N application of 112 kg ha21 applied within fields where crop N was determined to be deficient increased yields by 0.75 to 1.07 Mg ha21 averaged across seven fields, although yields did not exceed those when the same amount of N fertilizer was applied at emergence. Others also have shown that delaying N application until midseason often can give lower corn yields than if all N were applied at or near planting (Randall et al., 1997; Scharf et al., 2002; Sripada et al., 2005). Little is known about how a midseason N appli-
cation would affect NO3 concentrations in tile drainage; however, Randall et al. (1997) observed elevated residual NO3 in the soil profile after corn harvest from midseason N applications that could have leached to the tiles before next year’s crop. Thus, splitting an N application between planting and early season is a sound agronomic and environmental practice for corn production; however, delaying the second application—as may be necessary if the corn plant is used to determine N sufficiency—has not been fully established as a viable agronomic practice, and its effect on water quality is unknown. In this study, we compared three rates of N applied shortly after corn emergence to an application of N split evenly between emergence and midseason. Crop yield and the NO3 concentration in tile drainage were compared for both corn and soybean during 4 yr of a corn–soybean rotation to quantify the effects of midseason N application. MATERIALS AND METHODS The research was conducted on a 22-ha, privately owned field in central Iowa (42.208 N, 93.608 W) chosen for its uniformity of soils and terrain (Brevik et al., 2000) and the presence of an existing pattern-tiled drainage system (Fig. 1). Soils
USA
Iowa
Research field
Field layout 388
288 388 95
tiles
388
6 288
288
R H M L L M H R L
sump
95
Dataloggert and power
M 288 388 95
R
200
W
288
288 6 - Okoboji sicl 288 - Ottosen cl
0
N
H
E S
95 - Harps l 388 - Kossuth sicl 400
600 Meters
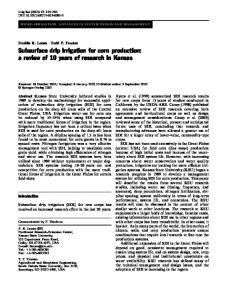
Fig. 1. Location of the field within Iowa and the USA and the layout of tile drains, sumps, locations of high (H), medium (M), low (L), and responsive (R) N-fertilizer treatment plots and distribution of Okoboji silty clay loam, Harps loam, Ottosen clay loam and Kossuth silty clay loam soils as determined by Brevik et al. (2000).
Reproduced from Agronomy Journal. Published by American Society of Agronomy. All copyrights reserved.
JAYNES & COLVIN: CORN YEILD & NITRATE LOSS IN DRAINAGE
within the field are in the Kossuth (fine-loamy, mixed, superactive, mesic Typic Endoaquoll)–Ottosen (fine-loamy, mixed, superactive, mesic Aquic Hapludoll) association. Harps (fineloamy, mixed, superactive, mesic Typic Calciaquoll) and a small area of Okoboji (fine, smectitic, mesic Cumulic Vertic Endoaquoll) soils are also included. These clay loam soils were formed on nearly level, alluvial or lacustrine sediments, range from very poorly to somewhat poorly drained, and have surface soil organic C contents of 29 g kg21. Large-scale row crop agriculture on these soils was possible only after installation of subsurface drainage systems (Hewes and Frandson, 1952). In 1992, new subsurface drainage lines were installed in the field at a depth of 1.22 m. Twelve lengths of 10.2-cm-diameter plastic corrugated drainpipe were installed along an east–west axis across the field (Fig. 1). Drains were |500 m in length and were installed parallel to each other with a separation of 36.5 m for the southern four tiles and 27.4 m for the other eight. The 12 tile lines were intercepted before they intersected the collection lateral on the east side of the field. A 0.6-m-diameter corrugated plastic culvert was installed vertically at the interception point of each tile as a sump. Drainage was pumped from each sump into the collection lateral, using a submersible sewage ejector pump equipped with a high–low level shutoff switch. Flow volume vs. time was measured with an FP-5300 paddle wheel flow meter (Omega, Stamford, CT) and recorded with a CR10X datalogger (Campbell Scientific, Logan, UT). Cumulative drainage was calculated by summing the yearly discharge volume from each tile and dividing by the area of each plot. The plot drainage areas were assumed equal to the length of the tile lines multiplied by the distance separating midpoints between the parallel tiles. Rainfall was measured starting in 1996 with a tipping bucket rain gauge and recorded every hour at a location ,0.5 km from the field. Missing data and precipitation data when temperatures were below 08C were obtained from the National Climatic Data Center for a weighing rain gauge located 2 km away. Flow-weighted composite water samples were collected in glass jars connected by a capillary tube to the sump pump, such that a proportional sample was collected each time water was pumped. Water samples were returned to the laboratory on a weekly or shorter basis, depending on tile flow rate, and chilled to 48C until analysis. Water samples were analyzed for NO3 using a Lachat 8000 (Zellweger Analytics, Lachat Instrument Division, Milwaukee, WI). Nitrate was quantitatively reduced to NO2 and the NO2 concentration determined colorimetrically (Keeney and Nelson, 1982). The method quantitation limit was 0.5 mg N L21 as NO3. Annual mass loss of NO3 from each tile was calculated by multiplying the NO3 concentration for the composite sample times the volume of water discharged during the time the composite sample was collected and summing across all samples in a calendar year. Annual flow-weighted NO3 concentrations were computed by dividing the annual mass loss by the total annual discharge. The field was planted to corn in 2000, 2002, and 2004 and soybean in 2001, 2003, and 2005 and was in a 2-yr corn– soybean rotation before this time. Primary tillage consisted of fall chisel plowing after soybean only. A field cultivator was used to prepare the soil for planting corn and incorporating herbicide in the spring and a row crop cultivator was used several times during the early growing season for weed control in corn. Corn was planted on a 76-cm row spacing on 25 April 2000, 20 April 2002, and 19 April 2004 at a rate of 75 000 ha21. Roundup-resistant soybean was drilled into corn residue in early May 2001, 2003, and 2005 for an approximate plant count of 370 000 ha21. The cooperating farmer performed all operations other than N fertilization and harvesting as part of his normal production practices.
1481
The 12 tiles served as the center lines for treatment plots that we grouped into three blocks and randomly assigned four N-fertilizer treatments within each block. Between the V1 and V3 growth stages, 28% UAN (urea–NH4NO3) was slot applied to the field using a Blue-Jet coulter applicator. Fertilizer rates were 199, 138, and 69 kg N ha21 for the high (H), medium (M), and low (L) N treatments, respectively (Fig. 1), where the H rate was equivalent to the farmer’s normal practice and the M rate was on average the economic optimum N rate (Jaynes et al., 2001). A fourth treatment was applied to simulate a reactive (R) approach and consisted of 69 kg N ha21 applied at the same time as the other treatments followed by a midseason (V16) application of another 69 kg N ha21. The initial N rate was intended to be insufficient for obtaining optimum corn yield so that the crop would respond to the midseason application. The total N applied for the R rate was equal to the economic optimum for this field when applied in one application at emergence. The midseason application was applied by dribbling liquid UAN (28%) in a narrow band between the rows using a high-clearance sprayer with drop hoses. Liquid fertilizer was used because of its better uniformity of application compared with the more commonly used anhydrous NH4 (Weber et al., 1995). In the 4 yr before this experiment, the same N rates were applied to the same plots (Jaynes et al., 2001) with the exception that the R treatment plots received the H rate in 1996 and 1998. In addition to the above N treatments, a strip of corn outside the drainage areas for the monitored tiles received no N to serve as a check strip for chlorophyll meter measurements (see below). Adjacent to the no-N strip, a second strip of corn received 250 kg N ha21 to serve as a nonlimiting N rate for chlorophyll meter readings. No N fertilizer was applied to soybean. A dry N–P–K (17–78–135 kg ha21) fertilizer was surface broadcast and incorporated after each soybean harvest. Grain yield was measured along a single transect within each of the 12 subsurface drainage plots using either a modified Gleaner K combine or a modified John Deere 4420 combine (Colvin, 1990) with a weigh tank in the grain hopper. The transect was offset from the drain line by |3 m to avoid the soil disturbed by tile installation, but the location was the same each year. Along the transect, a 20-m length was harvested, the combine’s forward motion stopped with the separator engaged to allow grain to finish cycling through the combine, and the grain weighed and moisture content measured. A strip, 2.29 m wide (three rows) for corn and 3.96 m wide for soybean, was harvested for each transect. Twenty-four or 25 yield values were collected from each plot and averaged. All grain weights were adjusted to a moisture content of 155 g kg21 for corn and 130 g kg21 for soybean. Grain samples were collected from each plot and grain quality, including protein, determined using near-infrared spectroscopy at the Iowa State University Grain Quality Laboratory. Six soil cores were taken randomly in November after harvest from each N-treatment plot. The soil cores were taken midway between rows to a depth of 1.2 m by pushing a 38.1-mm-diameter steel soil probe, fitted with a removable acetate liner, into the soil with a hydraulic ram. The soil core and liner were removed from the steel probe, capped on each end, and stored at 2108C until NO3 extraction. The frozen soil cores were cut into 150-mm-long sections, removed from the liners, thawed, and mixed by hand. Two 20-g subsamples were taken from each section for determination of soil water and NO3 content. Water content was determined by the change in weight from drying one soil subsample at 1048C for 48 h. The second subsample was weighed, mixed with 100 mL of 2 M KCl, shaken, and filtered. Nitrate concentrations were measured as described above and had a minimum quantitation level of 0.5 mg kg21.
AGRONOMY JOURNAL, VOL. 98, NOVEMBER–DECEMBER 2006
Weather and Hydrology Annual rainfall for each of the 4 yr was lower than the 40-yr average, ranging from 8 mm below average in 2004 to 174 mm below average in 2002 (Table 1). During the growing season, monthly rainfall was more than 30 mm below average in June and September 2002, August and September 2003, and April and September 2004. Monthly rainfall was .30 mm above average in only July 2002 and May 2004. In 2003, rainfall was much below average from August through October, with reports of widespread
Month
2002 25 4 234 22 220 279 34 24 250 14 238 223 2174
Jan. Feb. Mar. Apr. May June July Aug. Sept. Oct. Nov. Dec. Year
2003
2004
2005
40-yr avg.
27 1 229 27 213 14 9 262 234 245 56 14 268
mm 5 15 41 232 55 210 214 21 233 217 0 218 28
6 25 217 3 226 219 225 214 21 255 22 211 2114
19 22 52 87 111 130 102 104 80 61 42 24 833
drought stress in soybean in central Iowa. Both 2004 and 2005 had several months during the growing season with below-average precipitation, but in both years rainfall was timely enough to prevent noticeable crop stress. Because the midseason side-dressing of N was dribbled on the surface, it was important that timely rainfall occurred after application to move the N into the soil to the crop roots and prevent volatilization of NH3. In 2002, 0.5 mm of rain fell in the 5 d after application and 27 mm during the next 2 wk. In 2004, 1 mm of rain fell 6 d after application and 7 mm during the next 2 wk. Daily tile discharge rates varied from 0 (no flow) to .140 m3 d21. Figure 2 shows the discharge rate and cumulative discharge for 2002 through 2005 from one of the L-treatment tiles, which was typical of tile discharge in the field. Tile flow commenced much earlier (March) in 2004 and 2005 than in 2002 and 2003, reflecting the lack of winter precipitation in the latter 2 yr. Tile flow in all years ended by late July and did not start again until the following spring. Only in 2003 was there substantial tile discharge after 1 July. For the 4 yr, tile flow occurred during only 4 to 5 mo of spring and summer. Annual cumulative tile drainage reflected the precipitation patterns. Annual drainage volumes in the 4 yr (Table 2) were, in general, lower than those measured in the 4-yr period before 2000 (Jaynes et al., 2001), again 160 140 120 100 80 60 40 20 0 140 120 100 80 60 40 20 0
2002
daily drainage cum. drainage cum. precip.
2003
800 600 400 200
2004
2005
0 800 600 400 200
Cumulative discharge (mm)
Below-normal rainfall in 2000 resulted in very little tile flow for NO3 concentration and load measurements. The low rainfall, coupled with disease infestations in areas of the field, also caused substantially lower corn yields in 2000. For these reasons and because 2000 was also a transition year for establishing the R treatments, the 2 yr of the first rotation (2000 and 2001) were not used in the analysis. Instead, we used these years to establish the treatments and report only on the results from 2002 through 2005.
Deviation from 40-yr avg.
-1
RESULTS AND DISCUSSION
Table 1. Average monthly precipitation for the past 40 yr and the deviation from the average for 2002 through 2005.
3
To evaluate crop N sufficiency, the basal corn stalk NO3 test (Binford et al., 1990; Binford et al., 1992; Blackmer and Mallarino, 1996) was conducted by removing the 15- to 35-cm section of stalk above the ground surface from 10 corn stalks randomly selected from each plot just before grain harvest. Stalks were dried at 658C, ground in a hammer mill, then subsampled, further ground in a Wiley mill, and subsampled again, before grinding through a Cyclone sample mill to pass a 0.5-mm stainless steel screen. A final subsample was then ball-milled for 5 min and |0.25 g mixed with 50 mL of 2 M KCl, shaken, and filtered. Nitrate was determined as described above. To gauge in-season N stress in corn, a surrogate measure of leaf chlorophyll level was made using a Minolta SPAD 502 chlorophyll meter (Spectrum Technologies, Plainfield, IL). Rather than measuring chlorophyll directly, the meter measures the ratio of transmitted light at 650-nm wavelength (red light), which is sensitive to chlorophyll activity, to light transmitted at 940-nm wavelength (near infrared), which is relatively insensitive to chlorophyll. To take a measurement, the meter was clamped onto a leaf midway between the leaf tip and base and midway between the midrib and edge and a relative value between 0 (no chlorophyll) and 80 (high chlorophyll) recorded. Measurements were taken from the uppermost fully developed leaf until the ear leaf was fully developed, after which measurements were taken on the ear leaf (Peterson et al., 1993). An average value was computed for single measurements taken from 50 plants located randomly across each plot from late June through August. No SPAD readings were made on soybean. Because SPAD measurements are influenced by many factors, such as hybrid, plant spacing, stage of growth, temperature, plant water stress, irradiance, and time of day (Blackmer et al., 1993; Peterson et al., 1993; Martinez and Guiamet, 2004), the measurements were normalized by dividing the average value of a plot by the average value from the nonlimiting N strip within the field. All data were analyzed for treatment, block, and year effects using the general linear model ANOVA procedure (SAS Institute, 1990). Means for treatments that were significantly different at the P 5 0.05 level based on the F test were separated by computing Fisher’s least significant difference values.
Daily discharge (m d )
Reproduced from Agronomy Journal. Published by American Society of Agronomy. All copyrights reserved.
1482
0
Jan Mar May Jul Sep Nov Jan Mar May Jul Sep Nov Jan
Month of Year Fig. 2. Example of daily discharge rate and cumulative discharge depth from a tile drain for one of the low N-fertilizer treatment plots for 2002 through 2005. Cumulative precipitation for each year is also shown.
1483
JAYNES & COLVIN: CORN YEILD & NITRATE LOSS IN DRAINAGE
Table 2. Annual tile discharge by N treatment and year. N treatment†
2002 corn
2003 soybean
79 92 80 99 NS‡
220 228 220 240 NS
2004 corn
2005 soybean
mm H M L R LSD(0.05)
206 219 221 258 NS
126 164 145 147 NS
Reproduced from Agronomy Journal. Published by American Society of Agronomy. All copyrights reserved.
21
† N was applied postemergence at rates of H 5 199 kg ha , M 5 138 kg ha21, L 5 69 kg ha21, and R 5 69 kg ha21 with another 69 kg ha21 sidedressed at midseason in 2002 and 2004. ‡ Not significant.
reflecting the overall reduced precipitation in 2002 through 2005. Starting with the data reported in Jaynes et al. (2001), there were no significant (P 5 0.05) differences in annual discharge by treatment, but a block effect was present starting in 2003 (analysis not shown), with the northern block having significantly greater discharge than the other blocks. This higher discharge was due to higher discharge from the tile located on the northern edge of the field. This tile may have been influenced by lateral water flow from the adjacent field, as there was no buffer tile or drainage barrier between the fields and the surface topography sloped from north to south. Flow in this tile started increasing relative to the other tiles in 2001 after the neighbor removed and leveled the fence line separating the field from the adjacent field to the north, reworked the field’s tile drainage system, and switched from a corn–soybean rotation to continuous corn. Annual tile discharge represented, on average, 13, 30, 27, and 21% of annual rainfall for 2002 through 2005, respectively. The percentage of rainfall captured by the tiles reflected not only annual rainfall amounts, but also the timing of the rainfall in relation to evapotranspiration and water table position. For example, about half of the rain in 2005 fell after July, but tile drainage ended by mid-July. Rainfall later in the year did not generate tile flow because July starts the period of maximum evapotranspiration, which lowered the water table below the depth of the tiles and the rainfall was insufficient to both recharge the soil profile and raise the water table to the level of the tile to initiate tile flow.
Tile Drainage Nitrate Concentrations Nitrate concentrations in individual water samples from the tiles ranged from a minimum of 3.0 mg N L21 to a maximum of 28.3 mg N L21 during the 4 yr. Monthly average NO3 concentrations exceeded the 10 mg N L21 USEPA MCL for drinking water for every month with flow and all treatments except M and L. For the M treatment, monthly averaged NO3 concentrations exceeded 10 mg N L21 except in 2005, when all months averaged less than the MCL. For the L treatment, monthly average NO3 concentrations were greater than the MCL only in the years corn was grown—May and June 2002 and May, June, and July 2004. Thus, none of the N fertilizer treatments consistently produced drainage water below the MCL for NO3. As was observed for tile flow, the NO3 concentration in the tile discharge from the northernmost plot started to deviate upward from the concentrations observed for
the R treatments in the other two blocks after the adjacent field had its fence line regraded in 2001 and the crop rotation switched from a corn–soybean rotation to continuous corn. Assuming that this plot tile was partially draining the field to the north and thus not completely representative of the R treatment, we removed the plot before statistical analysis. Yearly flow-weighted NO3 concentrations in the tiles varied by year and treatment (Table 3). As expected, annual averaged NO3 concentrations for the H treatment were significantly greater than the NO3 concentrations for the other treatments and .14 mg N L21 each year. Conversely, the tile NO3 concentrations in the L treatment were significantly lower than the other treatments for 2002 through 2005. Averaged by crop, annual flowweighted NO3 concentrations were from 3.0 to 4.4 mg N L21 lower in years soybean was grown than in years corn was grown for all treatments except H. For the H treatment, the highest annual NO3 concentration in tile drainage was in 2003 when soybean was grown, and when compared across the 4 yr, there was no difference in average NO3 concentrations between crops in tile drainage for the H treatment. These observations agreed with earlier observations for this field, where yearly flow-weighted NO3 concentrations in tile drainage were correlated with N rate (Jaynes et al., 2001). Comparing the M and R treatments that received the same total amount of N fertilizer, we found that the annual flow-weighted NO3 concentrations in tile drainage were always greater for the R treatment than the M treatment; however, the differences were not significant in any year. Both treatments had NO3 concentrations in tile drainage between the concentrations for the H treatment and the L treatment, reflecting the relationship between total N applied and NO3 in tile drainage. The lack of difference in tile drainage NO3 concentrations for the M and R treatments is in agreement with earlier studies that found NO3 concentrations in tile drainage no different when side-dressing at least half of the N early in the season (V8) compared with applying once in the spring (Randall et al., 2003). That there were differences in tile NO3 concentrations between the L and R treatments, despite most of the annual tile drainage occurring before the additional N was side-dressed for the R treatment, indicates that much of the additional NO3 observed in the tile drains was from N applications in previous years. The carryover of higher NO3 concentrations in tile drainage in soybean years Table 3. Annual flow-weighted NO3 concentration in tile discharge by N treatment and year. N treatment†
2002 corn
2003 soybean
2004 corn
mg N L H M L R‡ LSD(0.05)‡
17.8 13.4 10.8 14.7 2.1
21.0 12.2 7.2 12.5 2.1
2005 soybean
21
17.9 14.1 12.1 15.0 2.3
14.3 9.2 6.8 10.0 1.5 21
† N was applied postemergence at rates of H 5 199 kg ha , M 5 138 kg ha21, L 5 69 kg ha21, and R 5 69 kg ha21 with another 69 kg ha21 sidedressed at midseason in 2002 and 2004. ‡ With the northern border plot removed.
1484
AGRONOMY JOURNAL, VOL. 98, NOVEMBER–DECEMBER 2006
Reproduced from Agronomy Journal. Published by American Society of Agronomy. All copyrights reserved.
Yield For corn, there were significant differences in yield by N treatment, differences in yields by year, and the year 3 N treatment interaction was significant as well (Table 4). Corn yields were very good at the higher N rate (Table 5) and, in general, were very good across central Iowa in 2002 and 2004, contributing to the state yield record of 11.4 Mg ha21 in 2004. In contrast, soybean yield was not affected by N treatment but yield did vary significantly by year, with yields in 2005 substantially greater than in 2003. In 2002, the midseason application of N significantly increased yield for the R treatment by |1 Mg ha21 or 8.6% compared with the L treatment. Thus, the crop did respond to the midseason application of N; however, the midseason application of N did not produce yields comparable to the M treatment, despite receiving the same overall rate of N fertilizer. There was no difference in yield between the M and H treatments in 2002. The end-of-season stalk NO3 test reflected these observations, as the average values were 2800 mg N kg21 for the H treatment, 500 mg N kg21 for the M treatment, 0 mg N kg21 for the L treatment, and 487 mg N kg21 for the R treatment. The values are considered “excess” for the H treatment with a greater chance of more N available than the plant required, “marginal” for the M and R treatments with increased possibility that N was limiting yield, and “low” for the L treatment where N was very likely to have limited yield (Blackmer and Mallarino, 1996). In 2002, the relative SPAD values for the L and R treatments were slightly lower than the M and H treatments on all measurement dates, with values for the L treatment progressing lower as the season progressed (Fig. 3). The relative SPAD values for both the L and R treatments did not decline below 0.95 until early August, when the crop was at the R3 or milk growth stage, which would leave little time to supply additional N to the plants before maturity. The values for the R treatment increased from early August through senescence, probably reflecting uptake of the midseason applied N, while values for the L treatment remained below 0.95. Thus, the H and M treatments had sufficient N for full yield while the L
N treatment†
Corn
Soybean
Source of variation
df
Mean squares
df
Mean squares
Block Year Block 3 year N treatment Year 3 N treatment Block 3 N treatment Error
2 1 2 3 3 6 6
0.245 1.095*** 0.347 40.7*** 8.54*** 0.714 0.060
2 1 2 3 3 6 6
0.010 7.05*** 0.009 0.007 0.004 0.003 0.068
2002 corn
2003 soybean
2004 corn
Mg ha H M L R LSD(0.05) Check (no N)‡
12.46 12.42 10.70 11.62 0.43 6.77
2.87 2.87 2.89 2.88 NS –
2005 soybean
21
13.47 12.57 8.48 10.96 0.72 7.15
3.89 3.97 4.03 3.95 NS – 21
† N was applied postemergence at rates of H 5 199 kg ha , M 5 138 kg ha21, L 5 69 kg ha21, and R 5 69 kg ha21 with another 69 kg ha21 sidedressed at midseason in 2002 and 2004. ‡ Not included in statistical analysis.
treatment had insufficient N. The R treatment had insufficient N early in the season but adequate N by harvest, with the early season deficit lowering yield significantly compared with the M treatment. In 2004, the R treatment resulted in an even greater response in corn yield (2.48 Mg ha21), compared with the L treatment, than in 2002. Once again, however, the R treatment yield was significantly less (1.61 Mg ha21) than the M treatment, which received the same total amount of N. The yield for the H treatment was also significantly greater than all other treatments that year, indicating that in this excellent year for growing corn, the lower rates of N application were insufficient to meet the crop need. Yield by N treatment results were supported by the end-of-season stalk NO3 values, which showed only the H treatment to be in the “optimal” range (1270 mg N kg21), while the other three treatments were in the “low” range (#17 mg N kg21). Relative SPAD values for the L and R treatments in 2004 dropped precipitously below 0.95 in late June, indicating a N deficiency by midseason (Fig. 3). By August, there was considerable separation among all treatments, which reflected the greater spread in yields for the dif1.1 1.0 0.9
H M L R Z
0.8 0.7 0.6
2002
1.1 1.0 0.9 0.8 0.7 0.6
Table 4. Analysis of variance for grain yield.
*** Significant at the 0.001 probability level.
Table 5. Grain yield by year as affected by N treatment.
Relative SPAD value
also indicates that there was considerable delay between the detection of NO3 in the tiles and when the N was applied. Delay in observing NO3 as a result of N applications is not unusual (Tomer and Burkart, 2003) and is one reason why the treatments were established for 2 yr before observations were collected for analysis.
2004
0.5 13-Jun 28-Jun 13-Jul
28-Jul 12-Aug 27-Aug 11-Sep
Date Fig. 3. Chlorophyll (SPAD) values for corn relative to SPAD values from a nonlimiting N strip and the 95% confidence limits for different dates in 2002 and 2004. The N treatments for corn were H 5 199 kg ha21, M 5 138 kg ha21, L 5 69 kg ha21, R 5 69 kg ha21 of N applied at V1 to V3 with another 69 kg ha21 N side-dressed at midseason (V16), and Z 5 no N fertilizer. Dotted horizontal line is at the 0.95 sufficiency threshold value. The dashed vertical line is the time of the midseason N application to the R treatment.
1485
ferent N treatments in 2004 than in 2002. Again, the relative SPAD values for the R treatment trended upward compared with the L treatment after side-dressing N, but did not exceed 0.95 for the rest of the growing season nor equal the values for the H and M treatments. Relative SPAD values for the M treatment also fell below 0.95 in August, reflecting the significantly lower yields for this treatment compared with the H treatment. In 2002, the R treatment increased yield by |1 Mg ha21 compared with the L treatment, an increase similar to that observed by Hendrickson and Han (2000) and Binder et al. (2000) for midseason side-dressing of corn with similar N rates applied near planting. In the excellent crop growing year of 2004, however, the R treatment increased corn yield by 2.48 Mg ha21 compared with the L treatment. While yields could be increased by applying N midseason when the initial N application was insufficient, midseason side-dressing resulted in lower yields than when the equivalent rate of N was all applied early postemergence. This agrees with the findings by Randall et al. (1997), who applied a total of 112 kg N ha21 either all at pre-emergence or split between pre-emergence and V16, although the differences in yield here were somewhat greater. In contrast to these results, Sripada et al. (2005) observed greater corn yields from midseason application of N at one site in North Carolina when the same amount of N was split applied vs. applied all at planting. Corn grain quality as measured by protein content was also affected by N treatment. Corn grain protein decreased consistently as N rate decreased, averaging 0.80, 0.78, 0.73, and 0.77 g N kg21 for the H, M, L, and R treatments, respectively, in 2002, and 0.74, 0.62, 0.52, and 0.59 g N kg21 for the same treatments in 2004. Compared across both corn years, the grain protein contents at the 0.05 confidence level were H . M 5 R . L. Sidedressing N fertilizer midseason in the R treatment improved grain quality to equal that of the M treatment, in which the equivalent amount of fertilizer was all applied postemergence. Thus, applying N midseason to a crop that is insufficient in N improved corn grain quality as well as increased grain yield. Conversely, the grain protein content of soybean averaged 325 g kg21 in 2001 and 356 g kg21 in 2003 with no significant differences by the previous year’s N treatment.
Residual Soil Nitrate Residual soil NO3 was measured to a depth of 120 cm every year after harvest. Nitrate concentrations within the soil profile generally decreased with depth each year (Fig. 4). Residual soil NO3 was much more variable among treatments in 2002 and 2004 after corn harvest than in years following soybean harvest. After corn, concentrations in the top 50 cm of the soil profile increased from the L to the M to the H treatments, reflecting the increased application rate of N fertilizer for these treatments. The R treatment had significantly greater NO3 mass within the soil profile after corn harvest than the L treatment (Table 6) as a consequence of the midseason side-dress application of 69 kg ha21 of N. While not significant for either year, residual soil NO3 was consistently
0 20 40 60 80
Depth (cm)
Reproduced from Agronomy Journal. Published by American Society of Agronomy. All copyrights reserved.
JAYNES & COLVIN: CORN YEILD & NITRATE LOSS IN DRAINAGE
2002
100
2003
0 20 40
H M L R LSD
60 80 2004
100
2005
120 0
2
4
6
8 10 12 0
2
NO3 (mg N
4
6
8 10 12 14
kg-1)
Fig. 4. Residual soil NO3 concentration vs. depth for each N treatment after harvest in 2002 through 2005. The N treatments for corn were H 5 199 kg ha21, M 5 138 kg ha21, L 5 69 kg ha21, and R 5 69 kg ha21 of N applied at V1 to V3 with another 69 kg ha21 N sidedressed at midseason (V16). No N fertilizer was applied to soybean. Corn was harvested in even years, soybean in odd years. Horizontal bars, where present, represent least significant difference where an F test was significant (a 5 0.05).
greater for the R treatment than the M treatment, despite having equal amounts of N applied during the year. Also NO3 concentration was greater near the soil surface for the R treatment than for L or M treatment. Apparently, dribbling N onto the soil surface at midseason did not allow sufficient time for all of the N to be taken up by the corn crop and thus unused NO3 was still present near the soil surface after harvest. Similarly, Timmons and Baker (1991) and Randall et al. (1997) observed that N applied mid-season was not fully taken up by the plant and remained in the soil. Injecting the N below the surface rather than dribbling on the surface as done here may have improved plant availability of the applied UAN and reduced residual soil NO3 for the R treatment (Timmons and Baker, 1992). After soybean harvest (2003 and 2005), there was little variation among the treatments for residual soil NO3 in Table 6. Residual soil nitrate after harvest each year in the surface 1.2 m of soil by N treatment. N treatment†
2002 corn
2003 soybean
2004 corn
kg N ha H M L R LSD(0.05)
52.4 28.9 14.7 35.4 19.0
24.5 21.4 19.5 22.4 NS
2005 soybean
21
32.5 21.7 15.4 28.1 5.7
39.9 38.8 37.7 40.1 NS 21
† N was applied postemergence at rates of H 5 199 kg ha , M 5 138 kg ha21, L 5 69 kg ha21, and R 5 69 kg ha21 with another 69 kg ha21 sidedressed at midseason in 2002 and 2004.
Reproduced from Agronomy Journal. Published by American Society of Agronomy. All copyrights reserved.
1486
AGRONOMY JOURNAL, VOL. 98, NOVEMBER–DECEMBER 2006
the top 50 cm (Fig. 4). This was probably a result of no N fertilizer being applied to the soybean crop. Growing soybean and not applying N fertilizer eliminated the substantial differences in residual soil NO3 found after corn harvest. Only at depths .80 cm in 2003 were there any significant differences in residual soil NO3 concentrations among the treatments. The higher NO3 concentrations below 80 cm for the H treatment may indicate that the greater amount of N fertilizer applied in this treatment had not completely leached below 120 cm after 17 mo.
Recovery of Side-Dressed Nitrogen Because the side-dressed UAN was dribbled on the surface, there was the possibility that some of the N was lost through volatilization (Tisdale and Nelson, 1975). We computed how much of the side-dressed N was recovered in crop grain and tile drainage by summing the N losses by these two pathways and subtracting the totals for the R treatment from the L treatment. From the grain harvest and grain protein results and assuming a 6.25 conversion factor for grain protein to grain N (David et al., 1997), we computed the total amount of N removed with the grain. Totaled across the 4 yr, 53 kg ha21 more N was removed with the grain for the R treatment than the L treatment. During the same 4 yr, 54 kg N ha21 more NO3 was lost in the tile drainage from the R treatment than the L treatment. Thus, 107 kg ha21 more N was recovered from the R treatment than the L treatment as a result of receiving 138 kg ha21 more N fertilizer during the 4 yr, or about 78% of the N applied midseason was accounted for, being equally split between grain N removed and tile drainage losses. Additional N would also have been taken up by the plant and stored in biomass other than grain and is not included in the 78% figure. Thus, it appears that most of the N applied at midseason entered the soil or plant and was not lost to the atmosphere through volatilization.
SUMMARY AND CONCLUSIONS Using plant sensors to fine tune N application has been proposed for reducing overall N fertilizer use and improving water quality by reducing NO3 concentrations in surface and groundwaters. Most techniques to date, however, would necessitate delaying N fertilizer sidedressing until midseason, when useful sensor information can be obtained. Side-dressing N fertilizer as late as tasseling has been shown to recover much of the yield potential of a corn crop, but the water quality impacts were unknown. In this study, midseason application of liquid UAN yielded significantly less corn grain than if the same amount of N was applied all postemergence. When insufficient N was present, however, the midseason application of N increased yield 9 and 29%. None of the N treatments on corn affected yields of the following soybean crop. Nitrate losses in tile drainage were increased by the midseason application and when compared across the 4 yr, were significantly greater than losses from when the same amount of N fertilizer was applied in one application after emergence. Thus, a midseason N application may be bene-
ficial for recovering some of the potential yield in corn when insufficient N is applied or the applied N is lost early in the growing season, but the practice should not be considered a best management practice for water quality. ACKNOWLEDGMENTS We appreciate and acknowledge the helpful comments provided by T. Kaspar and L. Hendrickson on earlier versions of this manuscript, the assistance of K. Heikens, J. Cook, P. Buck, M. Creswick, and C. Thimmesch with the field operations, the chemical analysis of NO3 supervised by A. Morrow, and the cooperation of R. Larson, K. Larson, and B. Larson and families.
REFERENCES Bakhsh, A., R.S. Kanwar, T.B. Bailey, C.A. Cambardella, D.L. Karlen, and T.S. Colvin. 2002. Cropping system effects on NO3–N loss with subsurface drainage water. Trans. ASAE 45:1789–1797. Binder, D.L., D.H. Sander, and D.T. Walters. 2000. Maize response to time of nitrogen application as affected by level of nitrogen deficiency. Agron. J. 92:1228–1236. Binford, G.D., A.M. Blackmer, and N.M. El-Hout. 1990. Tissue test for excess nitrogen during corn production. Agron. J. 82:124–129. Binford, G.D., A.M. Blackmer, and B.G. Meese. 1992. Optimal concentrations of nitrate in cornstalks at maturity. Agron. J. 84:881–887. Bjorneberg, D.L., D.L. Karlen, R.S. Kanwar, and C.A. Cambardella. 1998. Alternative N fertilizer management strategies effects on subsurface drain effluent and N uptake. Appl. Eng. Agric. 14:469–473. Blackmer, A.M., D. Pottker, M.E. Cerrato, and J. Webb. 1989. Correlations between soil NO3 concentrations in late spring and corn yields in Iowa. J. Prod. Agric. 2:103–109. Blackmer, A.M., and A.P. Mallarino. 1996. Cornstalk testing to evaluate nitrogen management. Pm-1584. Iowa State Univ. Ext. Serv., Ames. Blackmer, A.M., and S.E. White. 1998. Using precision farming technologies to improve management of soil and fertiliser nitrogen. Aust. J. Agric. Res. 49:555–564. Blackmer, T.M., and J.S. Schepers. 1995. Use of a chlorophyll meter to monitor nitrogen status and schedule fertigation for corn. J. Prod. Agric. 8:56–60. Blackmer, T.M., J.S. Schepers, G.E. Varvel, and G.E. Meyer. 1996. Analysis of aerial photography for nitrogen stress within corn fields. Agron. J. 88:729–733. Blackmer, T.M., J.S. Schepers, and M.F. Vigil. 1993. Chlorophyll meter readings in corn as affected by plant spacing. Commun. Soil Sci. Plant Anal. 24:2507–2516. Brevik, E.C., T.E. Fenton, and D.B. Jaynes. 2000. Evaluation of the accuracy of a central Iowa soil survey and implications for precision soil management. In P.C. Robert et al. (ed.) Proc. Int. Conf. on Precision Farming, 5th, Bloomington, MN. 16–19 July 2000 [CDROM]. ASA, CSSA, and SSSA, Madison, WI. Colvin, T.S. 1990. Automated weighing and moisture sampling for a field-plot combine. Appl. Eng. Agric. 6:713–714. David, M.B., L.E. Gentry, D.A. Kovacic, and K.M. Smith. 1997. Nitrogen balance in and export from an agricultural watershed. J. Environ. Qual. 26:1038–1048. Dinnes, D.L., D.L. Karlen, D.B. Jaynes, T.C. Kaspar, J.L. Hatfield, T.S. Colvin, and C.A. Cambardella. 2002. Nitrogen management strategies to reduce NO3 leaching in tile-drained midwestern soils. Agron. J. 94:153–171. Goel, P.K., S.O. Prasher, J.A. Landry, R.M. Patel, R.B. Bonnell, A.A. Viau, and J.R. Miller. 2003. Potential of airborne hyperspectral remote sensing to detect nitrogen deficiency and weed infestation in corn. Comput. Electron. Agric. 38:99–124. Goolsby, D.A., W.A. Battaglin, B.T. Aulenbach, and R.P. Hooper. 2001. Nitrogen input to the Gulf of Mexico. J. Environ. Qual. 30: 329–336. Goolsby, E.A., W.A. Battaglin, G.B. Lawrence, R.S. Artz, B.T. Aulenbach, R.P. Hooper, D.R. Keeney, and F.J. Stensland. 1999. Flux and sources of nutrients in the Mississippi–Atchafalaya river basin: Topic 3 report for the integrated assessment of hypoxia in the Gulf of
Reproduced from Agronomy Journal. Published by American Society of Agronomy. All copyrights reserved.
JAYNES & COLVIN: CORN YEILD & NITRATE LOSS IN DRAINAGE
Mexico. Decision Analysis Ser. no. 17. NOAA Coastal Ocean Program, Silver Spring, MD. Guillard, K., T.F. Morris, and K.L. Kopp. 1999. The pre-sidedress soil nitrate test and nitrate leaching from corn. J. Environ. Qual. 28: 1845–1852. Hendrickson, L.L., and S. Han. 2000. A reactive nitrogen management system. In P.C. Robert et al. (ed.) Proc. 5th Int. Conf. Precision Agric., 5th [CD-ROM]. ASA, CSSA, SSSA, Madison, WI. Hendrickson, L.L., S. Han, and G.C. Gries. 2002. Development of nitrogen stress maps from aerial images.. In P.C. Robert et al. (ed.) Proc. 6th Int. Conf. Precision Agric., Minneapolis, MN [CD-ROM]. 14–17 July 2000. ASA, SSSA, and CSSA, Madison, WI. Hewes, L., and P.E. Frandson. 1952. Occupying the wet prairie: The role of artificial drainage in Story County, Iowa. Ann. Assoc. Am. Geogr. 42:24–50. Jaynes, D.B., T.S. Colvin, D.L. Karlen, C.A. Cambardella, and D.W. Meek. 2001. Nitrate loss in subsurface drainage as affected by nitrogen fertilizer rate. J. Environ. Qual. 30:1305–1314. Jaynes, D.B., D.L. Dinnes, D.W. Meek, D.L. Karlen, C.A. Cambardella, and T.S. Colvin. 2004. Using the late spring nitrate test to reduce nitrate loss within a watershed. J. Environ. Qual. 33:669–677. Jaynes, D.B., J.L. Hatfield, and D.W. Meek. 1999. Water quality in Walnut Creek watershed: Herbicides and nitrate in surface waters. J. Environ. Qual. 28:45–59. Keeney, D.R., and D.W. Nelson. 1982. Nitrogen: Inorganic forms. p. 743–698. In A.L. Page et al. (ed.) Methods of soil analysis. Part 2. 2nd ed. Agron. Mongr. 9. ASA and SSSA, Madison, WI. Magdoff, F.R., D. Ross, and J. Amadon. 1984. A soil test for nitrogen availability to corn. Soil Sci. Soc. Am. J. 48:1301–1304. Martinez, D.E., and J.J. Guiamet. 2004. Distortion of the SPAD 502 chlorophyll readings by changes in irradiance and leaf water status. Agronomie 24:41–46. Mitchell, J.K., G.F. McIsaac, S.E. Walker, and M.C. Hirshi. 2000. Nitrate in river and subsurface drainage flows from an east central Illinois watershed. Trans. ASAE 43:337–342. Peterson, T.A., T.M. Blackmer, D.D. Francis, and J.S. Scheppers. 1993. Using a chlorophyll meter to improve N management. Nebguide G93-1171-A. Univ. of Nebraska Coop. Ext. Serv., Lincoln. Piekielek, W.P., and R.H. Fox. 1992. Use of a chlorophyll meter to predict sidedress nitrogen requirements for maize. Agron. J. 84:59–65. Rabalais, N.N., W.J. Wiseman, R.E. Turner, B.K. Sen Gupta, and Q.
1487
Dortch. 1996. Nutrient changes in the Mississippi River and system responses on the adjacent continental shelf. Estuaries 19:386–407. Randall, G.W., T.K. Iragavarapu, and B.R. Bock. 1997. Nitrogen application methods and timing for corn after soybean in a ridgetillage system. J. Prod. Agric. 10:300–307. Randall, G.W., J.A. Vetsch, and J.R. Huffman. 2003. Nitrate losses in subsurface drainage from a corn–soybean rotation as affected by time of nitrogen application and use of nitrapyrin. J. Environ. Qual. 32:1764–1772. Ritchie, S.W., J.J. Hanway, and G.O. Benson. 1996. How a corn plant develops. Spec. Publ. 48. Iowa State Univ. Coop. Ext. Serv., Ames. SAS Institute. 1990. SAS/STAT user’s guide. Version 6. 4th ed. SAS Inst., Cary, NC. Scharf, P.C., W.J. Wiebold, and J.A. Lory. 2002. Corn yield response to nitrogen fertilizer timing and deficiency level. Agron. J. 94:435–441. Schepers, J.S., D.D. Francis, M. Vigil, and R.E. Below. 1992. Comparison of corn leaf nitrogen concentration and chlorophyll meter readings. Commun. Soil Sci. Plant Anal. 23:2173–2187. Siambi, M.M., D.L. Karlen, and R.M. Shibles. 1999. Chlorophyll meter assessments of corn response to nitrogen management practices. J. Iowa Acad. Sci. 106:34–39. Sripada, R.P., R.W. Heiniger, J.G. White, and R. Weisz. 2005. Aerial color infrared photography for determining late-season nitrogen requirements in corn. Agron. J. 97:1443–1451. Timmons, D.R., and J.L. Baker. 1991. Recovery of point-injected labeled nitrogen by corn as affected by timing, rate, and tillage. Agron. J. 83:850–857. Timmons, D.R., and J.L. Baker. 1992. Fertilizer management effect on recovery of labeled nitrogen by continuous no-till. Agron. J. 84: 490–496. Tisdale, S.L., and W.L. Nelson. 1975. Soil fertility and fertilizers. Macmillan Publ. Co., New York. Tomer, M.D., and M.R. Burkart. 2003. Long-term effects of nitrogen fertilizer use on ground water nitrate in two small watersheds. J. Environ. Qual. 32:2158–2171. Weber, R.W., R.D. Grisso, C.A. Shapiro, W.L. Kranz, and J.L. Schinstock. 1995. Anhydrous ammonia application rate errors. Appl. Eng. Agric. 11:211–217. Zucker, L.A., and L.C. Brown. 1998. Agricultural drainage: Water quality impacts and subsurface drainage studies in the Midwest. Ext. Bull. 871. Ohio State Univ., Columbus.