principal axis of the image volume was calculated and the image volume ... Saunders Company ... Algorithms were created with a software development.
Coronary Artery Mapping: A Method for Three-Dimensional Reconstruction of Epicardial Anatomy Christopher M. Speidel, Ronald K. Walkup, Dana R. Abendschein, Joseph L. Kenzora, and Michael W. Vannier Evaluation of coronary anatomy with conventional coronary angiography requires visual integration of multiple images from different viewing orientations to generate a mental interpretation of three-dimensional (301 structure. The epicardial surface is, in many ways, analogous to the earth's surface topography and may be effectively depicted using cartographic methods. To show coronary anatomy visualized as topographic maps, we used cartographic projection methods to analyze the coronary vessels of a canine heart after immediate postmortem injection with a radio-opaque gelatinous solution. A volumetric image data set was obtained with x-ray spiral computed tomography. The principal axis of the image volume was calculated and the image volume reformatted to a reference coordinate system defined by the principal axis as the ordinate. A cylindrical projection map of the epicardial surface was created using a maximum-intensity projection volume-rendering technique. After converting the Cartesian reference coordinate system to a polar coordinate system, additional mapping projections from user-defined orientations were generated. The results show that interpretative difficulties of coronary angiography may be diminished by generating 3D maps of coronary anatomy using volumetric datasets acquired noninvasively and displayed with cartographic methods. Copyright © 1995 by W.B. Saunders Company KEY WORDS: Coronary artery disease, angiography, cartography, spiral computed tomography.
A
CCU RATE interpretation of conventional coronary angiograms requires visual integration of numerous sequential images from different reviewing orientations to generate a three-dimensional (3D) mental representation of the coronary anatomy. This subjective process of visual interpretation can result in variable results regarding the observed object's size and shape. Furthermore, the comprehension of this complex anatomy is often hampered by superimposed semitransparent structures or opaque scene components. Despite these interpretive difficulties, invasive coronary angiography remains the only clinical method available to visualize the epicardial coronary anatomy. The noninvasive evaluation of coronary arteries with magnetic resonance angiography has been described.t-' These initial attempts have met with limited success because of respiratory
Journal of Digital/maging, Vol 8, No 1 (February). 1995: pp 35-42
and cardiac motion artifacts. Recently, a fatsuppressed, breath-hold, electrocardiogramgated gradient-echo pulse sequence has been described with which the major epicardial arteries, as well as significant stenoses and occlusions, can be identified.' Similar to conventional coronary angiography, the interpretation of magnetic resonance coronary angiograms requires mental integration of multiple 2D images to formulate a visual 3D interpretation of the epicardial coronary anatomy," and is likewise subject to interpretative difficulties because of overlapping semitransparent or opaque scene components. The 3D characteristics of geographic structures can be analyzed and displayed in two dimensions using map projections or cartography.' Cartography relies on the projection of surface structures onto a superimposed transparent object (eg, a cone or a sphere). In some instances, the surface of this object is then "unwrapped" about the longitudinal principal axis that corresponds to the object's major axis, and displayed as a 2D map." The principal axes correspond to the coordinate triad that passes through the centroid of the object, and are intrinsic properties of the object's shape. The use of principal moments and axes of inertia for our study was motivated by the need to define a local coordinate system for the heart, independent of the tomographic imaging device. The principal axes of inertia satisfy this requirement and have long been used for this purpose? and for the registration of image volumes.f The epicardial surface contains features analogous to earth topography. The spatial characteristics of the coronary arterial tree, for example, are analogous to geographic strucFrom the Department of Medicine, Washington University School of Medicine; and the Mallinckrodt Institute of Radiology, St. Louis, MO. Address reprint requests to Michael W Vannier, MD, Mallinckrodt Institute ofRadiology, 5/0 S Kingshighway Blvd, St Louis, MO 631/0. Copyright © 1995 by WB. Saunders Company 0897-1889/95/0801-0005$3.00/0 35
36
SPEIDEL ET AL
tures (eg, fivers, roads). 9 Accordingly, cartographic methods developed to analyze geographic structures and display their 3D characteristics as 2D maps may be used to analyze and display anatomic structures. Presented here are the results of two 3D reformation techniques of postmortem canine coronary anatomy using ANALYZE (Mayo Clinic, Rochester, MN)lO and the software development package, IDL (Research Software Inc, Denver, CO). The principal axis of the canine heart was identified and the object reformatted to a reference coordinate system defined by the principal axis as the ordinate. The surface coordinates describing the epicardial anatomy were then displayed as 2D surface maps. MATERIALS AND METHODS
Materials An iodinated solution was prepared for injection into the coronary arteries by dissolving gelatin (Knox Gelatin, Inc, Englewood Cliffs, NI) in preheated iodinated intravascular contrast (Conray 30, Mallinckrodt Medical, St Louis, MO). Food coloring (FD&C No.1) was added to the solution so that the extent of coronary perfusion could be determined visually.
Animal Preparation All procedures were conducted according to the guiding principles of the American Physiological Society. A male mongrel dog weighing - 20 kg was premedicated with subcutaneous acepromazine maleate (0.5 mg/kg) and atropine sulfate (0.04 rng/kg) after an overnight fast. Anesthesia was induced with intravenous thiopental (15 rug/kg). The lungs were mechanically ventilated and anesthesia was maintained with halothane (1.4%). An intravenous catheter was placed in the external jugular vein. At the completion of a femoral artery thrombosis experiment being performed at the medical center, II a median sternotomy was performed and the heart exposed. Heparin (5,000 U) was infused intravenously to minimize intracoronary coagulation. The aorta, pulmonary artery, pulmonary veins, superior and inferior vena cavae, and the azygous vein were ligated and the heart removed. To further minimize intracoronary coagulation, the coronary ostia were cannulated and flushed with a heparinized saline solution (20 U/mL). The warm contrast-gelatin solution was then selectively infused into each coronary ostia using a syringe and a flanged catheter. The infusion was continued until the perforating vessels were filled by contrast, as determined by visual inspection. The specimen was placed in a cold 4% paraformaldehyde bath and refrigerated overnight to allow the gelatin to solidify.
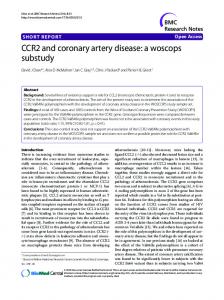
Image Acquisition and Preparation To stabilize the canine heart during the acquisition of image data, it was pierced with a pair of positioning rods
and suspended within a plexiglass container (Fig 1). A sequence of contiguous transaxial computed tomography (CT) images were obtained from apex to base using spiral CT (Soma tom Plus S, Siemens Medical Systems Inc, Iselin, NI). These images were obtained with l-rnm-slice thickness and no interspace gaps. CT was used rather than magnetic resonance imaging (MRI) because of its lower costs, ease of use with this model, and analogy of CT data to MRI volumetric data sets. The image sets were stored on optical disks. The 159 individual CT images were postprocessed with the menu-driven software package, ANALYZE, and an imaging workstation (SparcStation 2, Sun Microsystems, Mountain View, CAl. Each individual transaxial slice was reduced in size from 512- x 512- x l-pixel to 256- x 256- x l-pixel and scaled to an output maximum pixel intensity of 255. Each image was converted from 16 bits per pixel to 8 bits per pixel. Semiautomatic segmentation of the individual 2D CT images was used to remove the extracoronary structures (ie, positioning rods, myocardium, and plexiglass container). The resulting l16 eight-bit transaxial CT images depicting the coronary arteries were converted to binary data. Algorithms were created with a software development package, PV Wave (Precision Visuals Inc, Boulder, CO), to calculate the principal axis and centroid of the volumetric data set. A rotation matrix describing the conversion of the volumetric data set to a coordinate system defined by the principal axes was then calculated.
Reformation ofthe Volumetric Image Data The rotation matrix, describing the spatial reformation of the original data set to an orthogonal reference system defined by the principal axes of the coronary artery tree, was used to reformat the original 8-bit dataset. Using ANALYZE, the 8-bit volumetric dataset was converted to the reference coordinate system described by the principal axis. The reformatted image volume was then projected using a maximum-intensity projection volume-rendering algorithm to display a panoramic cylindrical projection.
Conversion to a Polar Coordinate System Because the data points describing the coronary anatomy are projected to a sphere with this panoramic rendering technique, certain scene components are necessarily distorted. The software development package, IDL, was used to generate additional mapping projections of the volumetric dataset. IDL requires polar coordinates as input to the mapping algorithms. Therefore, the orthogonal coordinates defining the coronary arteries were converted to polar coordinates. A second binary file describing the coronary anatomy was created from the reformatted 8-bit dataset using segmentation algorithms and ANALYZE. The surface of the canine heart, defined by the coronary arteries, was assumed to approximate a sphere. Algorithms to calculate the representative latitude and longitude of each binary pixel (each pixel describing a portion of the coronary tree) were implemented. The longitudinal coordinate of each pixel defining the coronary arteries was defined as the angle (in radians) formed by a line passing through the centroid of the volume
3D RECONSTRUCTION OF EPICARDIAL ANATOMY
37
Fig 1. A plexiglass container constructed to stabilize the canine heart during imaging. The positioning rods are inserted through the myocardium at right angles. The heart is then placed within the container and the container placed on its side during image acquisition.
and the data point and a plane perpendicular to the principal axis and passing through the centroid. Pixels lying in the transverse plane intercepting the centroid were assigned a longitude of zero. Pixels lying between this transverse plane and the apex were assigned a negative value, and conversely, pixels lying between this transverse plane and the base were assigned a positive value. Similarly, the latitude coordinates were calculated by arbitrarily defining a line with a latitude of zero. The angle (in radians) formed by a plane formed by this line and the principal axis and a line extending from the centroid to the data point was determined. The latitude and longitude coordinates saved to a file. The file containing these latitude and longitude coordinates is then used by IDL's built-in mapping algorithms. The IDL mapping algorithms (ie, Mercator, Mollwiede, conical, azimuthal, sinusoidal, cylindrical, Lambert, orthographic) were then used to display the coronary artery tree from a user defined oblique orientation.l-
RESULTS
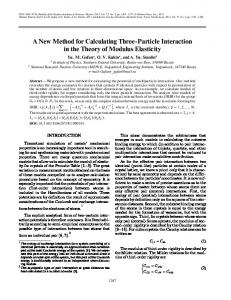
Using ANALYZE, both orthogonal (Fig 2) and cylindrical or panoramic representation of the canine coronary anatomy were created using a maximum-intensity projection volume ren-
dering technique (Fig 3). This cylindrical projection was created from 116 individual 8-bit CT images reformatted to an orthogonal reference system defined by the principal axis of the canine heart. The spatial distortion of some scene components in this cylindrical projection is a consequence of the geometry of the mapped object. The spatial characteristics on the surface of certain 3D objects, such as a sphere, can only be approximated in the 2D representation. The spatial orientation of each pixel in a volume of CT data is defined by Cartesian coordinates (ie, X, Y, Z). In addition, each pixel is further defined by the amount of information it contains (eg, binary, 8 bit, or 16 bit). The software development package, IDL, contains multiple mapping algorithms. These mapping algorithms require polar coordinates as input necessitating conversion of the individual data points in the 116 CT images to their respective latitude and longitude equivalents. Further-
38
SPEIDEL ET AL
Fig 2. The orthogonal representations of the image volume are displayed. The images were created with ANALYZE using a maximum-intensity volume-rendering technique.
more, each coordinate is mapped as a binary pixel forcing the loss of resolution across the epicardial surface. Therefore, extracoronary structures were removed using segmentation and the remaining pixels depicting the coronary
arteries were converted to binary format. After converting the orthogonal pixel positions to polar coordinates, the IDL mapping algorithms generated maps of coronary anatomy from multiple oblique orientations (Figs 4 and 5).
3D RECONSTRUCTION OF EPICARDIAL ANATOMY
39
Fig 3. A panoramic rendering of the image volume using ANALVZE. This projection is generated using a maximum-intensity volume-rendering technique and a cylindrical projection process. The apparent defect in the lett-anterior descending artery results from poor ex vivo injection of the contrast material.
DISCUSSION
Accurate identification of the epicardial arterial tree is necessarily subject to varied interpretations because of the superimposition of adjacent structures and the requirement for visual integration of multiple images. Conventional 3D reformation techniques may obscure scene components when viewed from certain orthogonal orientations (Fig 2). To overcome this deficiency, cartographic techniques may be used to display 3D volumes as 2D maps. These difficulties, as well as a recognition of the similarities between image analysis and cartography prompted this attempt at cartographic display of coronary anatomy. A variation of this principle was previously appreciated in the postmortem analysis of coronary anatomy.P Our methods used computed tomographic data, but the technique is intuitively adaptable to other imaging modalities whose datasets are intrinsically volumetric, ie, echocardiography'