DOI: 10.4025/actascibiolsci.v33i2.7842
Correlation between Escherichia coli and limnological variables in water samples of the Lagoa da Maraponga, Fortaleza, Ceará State, Brazil Vitor Matheus Galdino Pereira¹, Raimundo Bemvindo Gomes² and Marcelo Vinícius do Carmo e Sá1,3* 1
Departamento de Engenharia de Pesca, Centro de Ciências Agrárias, Universidade Federal do Ceará, 60356-000, Campus 2 Universitário do Pici, Fortaleza, Ceará. Brazil. Laboratório Integrado de Águas de Mananciais e Residuárias do Instituto Federal de 3 Educação, Ciência e Tecnologia do Ceará, Fortaleza, Ceará, Brazil. Centro Federal de Educação Tecnológica do Estado do Ceará, Av. Treze de Maio, 2081, 60040-531, Fortaleza, Ceará, Brazil. *Author for correspondence. E-mail:
[email protected]
ABSTRACT. The present work examined possible relationship between the Escherichia coli counts and the concentrations of free CO2, dissolved oxygen, reactive phosphorus, total ammonia, nitrite, pH, transparency and electric conductivity in water samples from the Lagoa da Maraponga (Fortaleza, Ceará State). Eight samplings were carried out every fifteen days to take samples under the water’s surface at three sampling stations. Regression analyses were performed with the variable with the greatest Pearson coefficients searching for the best fitted curve to observed data. The correlation between the water pH and E. coli was best represented by the equation ŷ = 7.63 – 2.92 * 10-4 x (r² = 0.53; P = 0.06) where x is the E. coli count (MPN 100 mL-1) and y is the water pH. We concluded that the inflow of sewage and other affluent rich in organic matter decreases the lake's alkalinity and make it susceptible to the acidification process. Keywords: eutrophication, fecal coliforms, pH, urban lakes.
RESUMO. Correlação entre Escherichia coli e variáveis limnológicas em amostras de água da Lagoa da Maraponga, Fortaleza, Estado do Ceará, Brasil. O presente trabalho teve como objetivo estudar o possível relacionamento existente entre as contagens de Escherichia coli e as concentrações de CO2 livre, oxigênio dissolvido, fósforo reativo, amônia total, nitrito, pH, transparência e condutividade elétrica, em amostras de água da lagoa da Maraponga (Fortaleza, Estado do Ceará). Foram realizadas oito campanhas, com periodicidade quinzenal, nas quais foram coletadas amostras de água subsuperficial, em três pontos de amostragem. Para a variável que apresentou o maior coeficiente de correlação linear em módulo, realizou-se a análise de regressão dos dados. Analisando-se matematicamente a relação entre a concentração de E. coli (NMP 100 mL-1), como variável independente, e a concentração o pH da água da lagoa da Maraponga, como variável dependente, chegou-se à equação ŷ = 7,63 – 2,92 * 10-4 x (r² = 0,53; P = 0,06). Concluiuse que a entrada de esgotos e/ou afluentes ricos em matéria orgânica na lagoa reduz a sua alcalinidade e a torna vulnerável ao processo de acidificação. Palavras-chave: eutrofização, coliformes fecais, pH, lagoas urbanas.
Introduction One of the oldest fields of Limnology and one of the most important in the present times is that related to the metabolism of the continental aquatic ecosystems. These studies allow understanding the structure and functioning of these ecosystems and, therefore, make feasible their management and the maximization of their productivity. The results produced by these studies are very useful for several techniques of management, especially those designed for freshwater aquaculture (ESTEVES, 1998). Acta Scientiarum. Biological Sciences
The Lagoa da Maraponga (LM) is situated in the city of Fortaleza, capital of Ceará State, in the Maraponga district, and belongs to Cocó’s hydrographic basin. In this basin, there are other urban lakes and reservoirs, such as the Açude do Jangurussu, the Lagoa do Passaré, the Lagoa da Sapiranga, the Lagoa de Messejana and the Lagoa de Porangabussu, among others water bodies from the Fortaleza Metropolitan Region. The LM has a surface area of 10.7 ha, volume of 134,050 m³ and a perimeter of 1,769 m. The mean and maximum depths are 1.74 and 3.90 m, respectively. It presents Maringá, v. 33, n. 2, p. 145-151, 2011
146
a potential area for aquaculture of 1,070 m², if this is considered equals to 1% of its surface area (FORTALEZA, 2007). Until the present time, however, there are no aquaculture activities in development in the LM. During the weekends, only sport fishing is carried out in a disorganized fashion. According to the Secretaria Municipal de Meio Ambiente e Controle Urbano – SEMAN, of the Prefeitura Municipal de Fortaleza, the LM’s water are unsuitable for bathing. As stated by the SEMAN’s bulletin from October 1st 2008, the mean concentration of thermotolerant coliforms (TTC) in LM was 221 MPN/100 mL while the maximum limit for bathing is 500 MPN 100 mL-1. The mean concentration of Escherichia coli was 127 MPN 100 mL-1 against an acceptance standard of 400 MPN 100 mL-1. In spite of the mean concentrations of TTC and E. coli have satisfied the legal standards for water suitable for bathing, it was verified that the percentage of water samples collected in the last five weeks of monitoring that followed the established standards was lower than 80%, explaining why the lake was considered unsuitable for bathing (CONAMA, 2005). Moreover, those results have already exceeded very much the reference values as happened, for instance, in February 2008 when the mean concentrations of TTC and E. coli were higher than 1,600 and 1,100 MPN 100 mL-1, respectively. Taking into account the resolution #357/05 of the Conselho Nacional do Meio Ambiente – CONAMA and the bathing report performed by the SEMAN, cited above, the LM’s waters are put into the CONAMA’s class #3. This class comprises waters used solely for human consumption after conventional or advanced treatment; recreation of secondary contact, irrigation of some vegetal cultures, sport fishing and to animal consumption. Therefore, the present physical and chemical condition of the LM’s waters limits its use for aquaculture. The development of systematic studies about the LM’s limnology is very important to allow its recovery and its use in further fishing and aquaculture projects. Before the start of its recuperation, however, it is necessary to carry out an intense program of basic limnological studies to achieve an accurate diagnosis of real situation (ESTEVES, 1998). Among the important questions that deserve research effort, we highlight the possible correlation between the Escherichia coli counts and some of the LM’s water quality indicators. Thus, the present examined the possible correlation between the E. coli counts and the pH, water transparency, electric Acta Scientiarum. Biological Sciences
Pereira et al.
conductivity and the concentrations of free CO2, dissolved oxygen, reactive phosphorus, total ammonia and nitrite in samples taken under the water’s surface of LM. Material and methods Sampling was conducted in the Lagoa da Maraponga (LM) from March through September 2008 and the water samples were analyzed in the laboratory of limnology - Lablim of the Departamento de Engenharia de Pesca of the Universidade Federal do Ceará, and in the Laboratório Integrado de Águas de Mananciais e Residuárias – Liamar, of the Instituto Federal de Educação Tecnológica, both located in Fortaleza, Ceará State. Eight samplings were performed fortnightly and sub-superficial water samples (20 – 30 cm under the surface) were collected at three sampling stations (Table 1). The sampling stations were defined as water entrance (main tributary), middle and water discharge. The stations ‘entrance’ and ‘discharge’ were located at the edge; the station ‘middle’ was a center point. The LM’s samplings performed by the Lablim’s staff were carried out together with the Liamar’s team. Therefore, the water samples used for physical and chemical analyses at Lablim were collected in the same moment and place in which the water samples were collected for microbiologic analysis (E. coli) by Liamar. Table 1. Geographical coordinates of the Lagoa da Maraponga’s sampling stations (Fortaleza, Ceará State). Sampling Station Entrance Middle Discharge
Latitude 3°46'140"S 3°33'977"S 3°45'870"S
Longitude 38°34'090"W 38°46'085"W 38°33'932"W
The water samplings were undertaken between 10 a.m. and noon. One-liter plastic bottles were used to collect water samples. Immediately after the water sample collection, the bottles were stored in one isothermal box (polystyrene) with ice. As soon as possible, the water samples followed to the lab for prompt analysis. The following physical and chemical variables were determined in the water samples in duplicate: dissolved oxygen, salinity, total alkalinity, calcium hardness, pH, free CO2, reactive phosphorus, total ammonia, nitrite, iron, electric conductivity and water transparency. The physical and chemical analyses were carried out according to the methodologies presented by APHA (1999). The E. coli concentrations in the water samples were determined according to the method 9223-B from APHA (1999) with the use of the chromogenic Maringá, v. 33, n. 2, p. 145-151, 2011
Maraponga lake: Escherichia coli and limnology
substrate ONPG-MUG. Taking into account the suggestions pointed out by the specialized literature (KULKOYLUOGLU et al., 2007), only the results of dissolved oxygen, pH, free CO2, reactive phosphorus, total ammonia, nitrite, water transparency and electric conductivity were correlated with the concentrations of E. coli. The last values are made available weekly by the Liamar/IFCE at the SEMAN web page (http://www.seman.fortaleza.ce.gov.br). For the experimental variable that presented the highest linear correlation coefficient (r) in module and had a value of r higher than 0.5, it was made the analysis of regression of its data to determine the curve that best fitted to observed points. Afterwards, it was discussed the possible environmental and biological explanations for the observed phenomena, as well as the main implications of these relationships in the maintenance of the LM’s ecological balance (or unbalance). All the statistical and mathematical analyses were performed with the aid of the software Microsoft Office Excel 2007 and SigmaStat 2.0 (Jandel Statisticas, US). Results and discussion Physical and chemical characteristics of water
The Table 2 presents the results of the physical and chemical analyses of the water samples from the LM’s entrance, middle point and discharge performed between March 8th and September 27th, 2008. All reference values presented hereafter were taken from Boyd and Tucker (1998). Over the observational period, the mean concentration of dissolved oxygen in LM was 5.08 ± 0.28 mg L-1. The middle point presented a DO2 concentration slightly inferior than those observed for the other points (entrance and discharge). The range for this variable was considerable with values as low and as high as 2.0 and 8.4 mg L-1 respectively. In spite of the mean concentration of dissolved oxygen is above the minimum limit recommended for aquaculture, i.e., 4.0 mg L-1, it was verified some occasions of
147
hypoxia in LM. Over these episodes, massive mortalities of aquatic organisms can occur by asphyxia and only the most resistant ones are capable to resist and survive. It is noteworthy that the middle point, exactly the one that best represent the environment, presented the lowest mean concentration of dissolved oxygen. Therefore, despite the mean concentration of dissolved oxygen has satisfied the minimal level required for aquatic life, it was noted that the LM suffers eventual episodes of hypoxia that can bring serious difficulties for the biota. These situations are probably related to heavy discharge of domestic sewages into the lake (SUMMERFELT; PENNE, 2007). The average salinity of the LM’s waters was 0.26 ± 0.01 g L-1, with a great homogeneity between the three sampling stations. The water salinity ranged between 0.18 and 0.40 g L-1. The mean salinity of the LM’s waters allows its classification as ‘fresh’ since oligohaline waters are those with a concentration of dissolved ions between 0.5 and 3.0 g L-1 (CONAMA, 2005). The mean electric conductivity (EC) of the LM’s waters was 500.6 5.95 S cm-1 with extreme values of 354 and 671 S cm-1. The sampling stations were very mutually similar regarding this variable. The mean LM’s EC indicates that this ecosystem is eutrophic and that there is the release of great amounts of ions into the water from the bacterial activity of organic matter decaying. It is considered as eutrophic aquatic ecosystems those presenting an EC higher than 100 S cm-1 (WETZEL, 2001). Thus, the LM presented an average EC value five times higher than the maximum value of reference for that variable. Eutrophic aquatic ecosystems are more susceptible to events of hypoxia and anoxia and, consequently, to related problems to aquatic life. Additionally, there is the occurrence of toxic gases into the water by the fermentation of organic matter into the mud, such as hydrogen sulfide and methane (HU et al., 2007).
Table 2. Physical and chemical characteristics of the Lagoa da Maraponga (Fortaleza, Ceará State) from sub-superficial water samples collected at its entrance, middle and discharge area between March 8th and September 27th, 2008 (mean ± S.D.) Variable¹ DO2 S EC TAlc CaHard pH FCO2 R-PO4-3 NH3-NH4+ NO2Transp TFe
Entrance 5.1 ± 1.6 0.26 ± 0.05 507 ± 91.2 34.2 ± 24.7 48.2 ± 8.3 7.24 ± 0.72 22.9 ± 5.9 0.010 ± 0.01 0.34 ± 0.18 0.25 ± 0.06 49 ± 10.5 0.13 ± 0.19
Samplings Middle 4.4 ± 2.1 0.25 ± 0.05 496 ± 94.7 33.1 ± 25.3 47.6 ± 8.0 7.31 ± 0.59 21.7 ± 6.9 0.016 ± 0.01 0.31 ± 0.13 0.26 ± 0.08 49 ± 8.0 0.10 ± 0.09
Discharge 5.3 ± 2.6 0.26 ± 0.06 498 ± 92.2 31.9 ± 24.6 48.7 ± 6.7 7.25 ± 0.51 24.4 ± 9.0 0.020 ± 0.03 0.34 ± 0.26 0.26 ± 0.05 49 ± 10.2 0.10 ± 0.12
Mean ± S.D 5.08 ± 0.28 0.26 ± 0.01 500.6 ± 5.95 33.1 ± 1.19 48.2 ± 0.56 7.27 ± 0.04 23.0 ± 1.33 0.02 ± 0.01 0.33 ± 0.02 0.26 ± 0.01 48.9 ± 0.14 0.11 ± 0.02
CV (%)² 5.52 1.97 1.19 3.59 1.17 0.52 5.77 35.02 5.13 2.67 0.30 15.32
Min
Max
2.0 0.18 354 3.0 37.1 5.9 13.0 0.0 0.0 0.14 35 0.0
8.4 0.4 671 66.5 65.1 8.1 39.0 0.1 0.6 0.40 70 0.6
1 DO2: dissolved oxygen (mg L-1), S: salinity (g L-1), EC: electric conductivity (S cm-1), TAlc: total alkalinity (mg L-1 CaCO3), CaHard: calcium hardness (mg L-1 CaCO3), FCO2: free carbon dioxide (mg L-1), R-PO4-3: reactive phosphorus (mg L-1), NH3-NH4+: total ammonia (mg L-1), NO2-: nitrite (mg L-1), Transp: water transparency or Secchi depth (cm), TFe: total iron (mg L-1); 2Coefficient of variation.
Acta Scientiarum. Biological Sciences
Maringá, v. 33, n. 2, p. 145-151, 2011
148
Over the samplings, the mean water pH was 7.27 0.04 with minimum and maximum values of 5.9 and 8.1, respectively. There was not a significant difference between the three sampling stations (entrance, middle and discharge) in regards to water pH. As discussed previously, although the average water pH is inside the adequate range for aquaculture (6.5 – 9.0), there were values as low as 5.9. In these moments, there was a close matching between low water pH and low concentration of dissolved oxygen. These two factors combined can take the animals to death. In acidic waters, the branchial epithelium is damaged and the gaseous exchange by fish is hindered. The total alkalinity of LM’s water was 33.1 1.19 mg L-1 CaCO3 eq. The sampling station ‘discharge’ presented a result of alkalinity slightly lower than those seen for the other points (31.9 mg L-1). There was a great variation between the results for that variable over the study period. The minimum and maximum values observed were 3.0 and 66.6 mg L-1, respectively. The total alkalinity of water indicates the buffering capacity of the system to pH variations, especially those related to acidification processes. The bicarbonates and carbonates are the main compounds that provide the buffering power to the ecosystem and it is desirable that the total alkalinity of water may be greater than 20 mg L-1 CaCO3 eq. (DODDS, 2002). Thus, the average value of LM’s total alkalinity (33.1 mg L-1) satisfied the minimum recommendation required to large or sudden variations in water pH. On the other hand, there is a decrease in water alkalinity always when acidifying agents enter the environment. In this situation, the water pH is maintained relatively stable due to the consumption of bicarbonates and carbonates (ARANA, 2000). This way, the result of LM’s total alkalinity equal to 3.0 mg L-1 indicates that, in that occasion (April 19th) 2008, there was probably an intense input of sewage and/or organic matter rich tributaries into the lake, reducing the LM’s total alkalinity. Therefore, although the LM’s mean total alkalinity was satisfactory, the frequent input of sewage to the lake makes it vulnerable to the acidification process. The calcium hardness of water was, on average, 48.2 0.56 mg L-1 CaCO3 eq. There was a great homogeneity between the sampling stations for this variable. The range for calcium hardness was 37.1 and 65.1 mg L-1 CaCO3 eq. Considering the mean calcium hardness, the LM’s waters are classified as soft (< 55 mg L-1). However, the hardness requirement for aquaculture is over 20 mg L-1. Therefore, there was enough calcium dissolved in water to supply the nutritional requirement of fish for growth and health (SHIAU; TSENG, 2007). Acta Scientiarum. Biological Sciences
Pereira et al.
On average, the concentration of free CO2 in the LM’s water was 23.0 1.33 mg L-1 over the present study. The concentration of free CO2 in the LM’s discharge was higher than those observed for the other points (entrance and middle). The lowest and the highest values observed for this variable were 13.0 and 39.0 mg L-1, respectively. The LM’s mean concentration of free CO2 is above the maximum acceptable limit for fish and shrimp culture that is 10 mg L-1. In this context, the animals cannot eliminate carbon dioxide correctly from their blood or haemolymph through branchial exchange and, by consequence, present high internal concentrations of this gas. This pathological syndrome is called hypercapnia. When this happens, there is a break in the ionic homeostasis of blood which lowers its pH. At the end of this process, the animal can die. In eutrophic urban lakes, the activity of bacterial decomposition upon organic detritus is one of the main sources of carbon dioxide to water (MULLER et al., 2006). Hence, considering that the concentrations of free CO2 were higher in the LM’s discharge sampling station, it is suggested that the latter point is the one which receives more organic pollution. The average concentration of reactive phosphorus was 0.02 0.01 mg L-1 with extremes of 0.0 and 0.1 mg L-1. There was a great variation between the sampling spots for this variable. The LM’s entrance presented a concentration of reactive phosphorus much lower than those observed for the other points (10 g L-1 vs. 16 and 20 g L-1, respectively). The analysis of reactive phosphorus measures just the orthophosphate (dissolved inorganic phosphorus), besides fractions of the dissolved organic phosphorus which spontaneously suffered hydrolysis, and of the particulate inorganic phosphorus, naturally dissolved into the water. Therefore, the reactive phosphorus analysis does not present the real load of phosphorus present in the environment. This evaluation is only possible when there are results of total phosphorus (APHA, 1999). Thus, it is difficult to evaluate the results of reactive phosphorus obtained in the present study because the specialized literature presents generally information about the total phosphorus concentration in the continental aquatic ecosystems. Nevertheless, we may infer from the obtained results that the LM’s entrance is the least eutrophic site. The concentration of total ammonia in LM’s waters was, on average, 0.33 0.02 mg L-1 and at its middle point we verified the lowest concentration (0.33 0.02 mg L-1). The minimum and maximum values were 0.0 and 0.6 mg L-1, respectively. Over the observational period, the mean LM’s nitrite Maringá, v. 33, n. 2, p. 145-151, 2011
Maraponga lake: Escherichia coli and limnology
concentration was 0.26 0.01 mg L-1. There was a great homogeneity between the LM’s entrance, middle and discharge for nitrite values. The lowest and highest concentrations of nitrite in the LM’s waters were 0.14 and 0.40 mg L-1, respectively. The concentrations of inorganic nitrogenous compounds in the LM’s waters were high, and values as high as 0.6 mg L-1 for total ammonia and 0.4 mg L-1 for nitrite were observed in the present study. Concentrations of non-ionized ammonia (NH3) and nitrite higher than 0.05 mg L-1 are already capable to distress aquatic animals. In this situation, the animals present impaired growth and become susceptible to opportunistic diseases (GOLOMBIESKI et al., 2005). The LM’s mean concentration of total iron, that comprises the dissolved and in suspension forms, was 0.11 0.02 mg L-1. The LM’s entrance presented a concentration of total iron higher than those seen for the middle and discharge sampling points. The minimum and maximum values observed for this variable were 0.0 and 0.6 mg L-1, respectively. In spite of the LM’s mean concentration of total iron is inside the proper range for aquaculture (0.05 and 0.5 mg L-1), results as high as 0.6 mg L-1 were verified in the present work. Excess of iron in water, especially in its particulate form, can clog aquatic animal’s gills and, by consequence, takes them to death by asphyxia. There are, then, certain periods over the year when the concentrations of iron in the LM are excessive. This iron can come from the LM’s surface tributaries as well as from sediments, especially when its hypolimnion is anaerobic. The average LM’s water transparency measured by Secchi disk was 48.9 ± 0.14 cm with little variation between the sampling sites. Over the study period, the lowest and highest values of Secchi disk were 35 and 70 cm, respectively. The average water transparency was 48.9 cm which is considered high and suggests the presence of insoluble metallic compounds in water that co-precipitate dissolved organic substances and phosphates to the sediments. The final consequence of this process is an increase of water transparency (ESTEVES, 1998). Linear correlation coefficients
Among the twelve limnological variables here monitored (Table 2), we selected eight to be correlated with the respective concentrations of E. coli. The criterion used for selection was the probable adherence of the limnological variables studied with the alterations in the LM’s fecal material load, as suggested by specialized literature (KULKOYLUOGLU et al., 2007). Acta Scientiarum. Biological Sciences
149
The Pearson’s linear correlation coefficients (r) of the relationships between the concentrations of the E. coli and the eight limnological variables selected are presented in Table 3. In each sampling we grouped the data from the different sampling spots (entrance, middle and discharge). The results of dissolved oxygen, pH, free CO2, total ammonia, nitrite, reactive phosphorus, water transparency and electric conductivity were correlated with the E. coli counts in MPN 100 mL-1. The bacteriologic data were obtained from the weekly technical reports released by the Liamar/IFCE in the internet. Next, the variables were ranked according to its respective correlation coefficient in decreasing degree of importance. In this way, the limnological variable with the highest Pearson correlation coefficient (r) in module, whose r was higher than 0.5 was the water pH (r = -0.71). This variable was mathematically adjusted to the results of E. coli counts through linear regression analysis. Table 3. Pearson linear correlation coefficients (r) of the relationships between the concentrations of Escherichia coli (MPN 100 mL-1) and selected limnological variables of sub-superficial water samples from Lagoa da Maraponga (Fortaleza, Ceará State). Variable pH Secchi depth Electric conductivity Nitrite Dissolved oxygen Free CO2 Total ammonia Reactive phosphorus
r -0.71 -0.43 0.42 -0.38 0.19 -0.16 -0.02 0.02
Ranking 1st 2nd 3rd 4th 5th 6th 7th 7th
Escherichia coli concentration and water pH
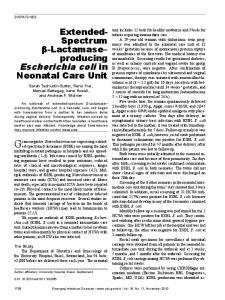
The Gram negative bacteria Escherichia coli are facultative anaerobic microorganisms which belong to the family Enterobacteriaceae. They live in the intestinal tract of homeothermic animals. In that family, there are pathogenic bacterial per se such as Salmonella, Shigella and Yersinia; and bacteria that, except at very high number, live in equilibrium with the host organism, such as Enterobacter and Klebsiella. The bacterium E. coli belongs to the last group which is, presently, called thermotolerant coliforms (HIGGINS; HOHN, 2008). The intestinal tract of homeothermic animals, as well as that of human, whether healthy or not, is generally colonized by E. coli. This bacterium can cause diarrhea when occurs in a very high number in the intestine. Besides, the concentration of E. coli in water samples is one of the main biological indicators of fecal contamination by the humans (SONIER et al., 2008). Figure 1 presents the simultaneous changes of the LM’s mean Maringá, v. 33, n. 2, p. 145-151, 2011
150
Pereira et al.
4000
8.0
7.6
3000
7.2 2000 6.8 1000
Water pH
Escherichia coli (MPN 100 mL-1)
6.4
0
6.0 8/3
22/3
19/4
17/5
31/5
20/9
27/9
Sampling date
E. coli
pH
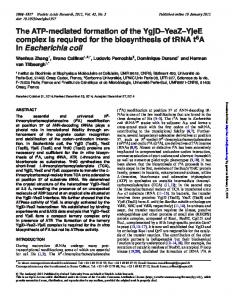
Figure 1. Mean concentrations of Escherichia coli (MPN 100 mL-1) and pH of water samples collected in the entrance, middle and discharge of the Lagoa da Maraponga (Fortaleza, Ceará State), during the period from March 8th to September 27th, 2008.
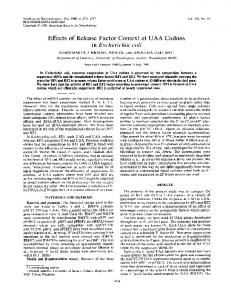
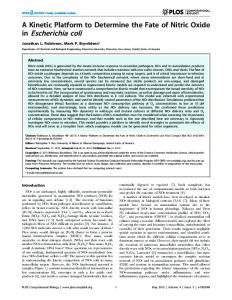
When the regression analysis of the relationship between the LM’s mean concentrations of E. coli, in MPN 100 mL-1 (independent variable) and its mean water pH (dependent variable) was performed, we noted that the linear model ŷ = a + bx was the one that best fitted to observed points (Figure 2). The application of the linear regression upon the observed data produced the following equation: ŷ = 7.63 – 2.92 * 10-4x, where y is the mean water Acta Scientiarum. Biological Sciences
pH, taking into account the results obtained in the LM’s entrance, middle and discharge; and x is the mean concentration of E. coli in MPN 100 mL-1 for the same sampling stations. The above mentioned regression equation presented a determination coefficient r² = 0.53 and a ANOVA P = 0.06. 9.0 pH = 7.63 - 2.92 * 10-4 Ec r² = 0.53 e ANOVA P = 0.06 8.0
Water pH
concentrations of E. coli, in MPN 100 mL-1, and the water pH, over the period from March through September 2008. Over the first three water samplings, the concentration of E. coli in the LM, in MPN 100 mL-1 decreased from 3,667 to 157. This last value, obtained in the sampling of April 19th, was the lowest one over the observational period. From that, the mean concentration of E. coli increased in the two following samplings and reached the value of 3,247 MPN 100 mL-1 in May 31st. Next, it was observed a strong decrease for this variable in the sampling of September 20th (197 MPN 100 mL-1) and a further stabilization in 179 MPN 100 mL-1 at the last water sampling performed (September 27th). The analysis of the Figure 1 clearly shows that there was an inverse relationship between the mean LM’s concentrations of E. coli, in MPN 100 mL-1, and the mean value of water pH. The expressive increase of pH happened in the first three sampling, followed by a significant reduction in the concentration of E. coli counts. The pH reduction from 7.9 to 6.1 that was observed between April 19th and May 31st had a respective variation in the E. coli counts from 157 to 3,247 MPN 100 mL-1. Finally, we observed that the pH increase from 6.1 to 7.4 was followed by the drop in the concentration of E. coli from 3,247 to 197 MPN 100 mL-1.
7.0
6.0
5.0 0
1000
2000
3000
Escherichia coli (MPN 100 mL-1)
4000
Figure 2. Regression analysis of the water pH as a function of the mean concentration of Escherichia coli (MPN 100 mL-1) recorded in Lagoa da Maraponga (Fortaleza, Ceará State). The black dots are values obtained from sub-superficial water samples collected in the entrance, middle and discharge of the lake.
The inverse relationship between the LM’s mean concentration of E. coli, in MPN 100 mL-1, and the water pH can be explained by the acidifying effect of the fecal matter decomposition. When high releases of domestic sewages took place in the LM, as happened in March 8th and May 31st, the increase of organic matter load in the ecosystem enhanced the biochemical oxygen demand (BOD) in the water column and sediments. This BOD can be understood as the increase of bacterial respiration upon the organic matter in decomposition. This way, the bacterial decomposition of the organic matter consumes oxygen and release CO2 to water. The free CO2 reacts with the water molecule and forms carbonic acid which dissociates in H+ and HCO3-, causing environmental acidification (GREEN et al., 2008). When the organic matter loading in LM was lower, and by consequence its fecal coliform concentrations, as observed during the samplings performed at April 19th and September 20th and 27th, there was probably a minor acidifying effect of free CO2 by the bacterial respiration. This allowed the restoration of the water pH to more alkaline values. Therefore, illegal sewage discharge in LM, beyond increase the degree of fecal contamination in the ecosystem, with the accompanying risks to human health, provoke also the acidification of its waters. Values of pH as low as 5.9 were observed in the present study. Acidic waters affect the respiratory capacity of aquatic animals and can take them to death by asphyxia (BOYD, 1992). Through human Maringá, v. 33, n. 2, p. 145-151, 2011
Maraponga lake: Escherichia coli and limnology
perspective, the environment becomes inappropriate for practically all possible purposes, remaining only the landscape function (CONAMA, 2005). Therefore, it is urgent to discover the hotspots of clandestine sewage and affluents potentially toxic in LM in order to eliminate them. Furthermore, it is necessary to remove through selective dredging the great amount of organic matter probably present in the sediment. Finally, the work of environmental education of the LM’s neighbors and users would allow the commitment of the population in the defense of the lake. Just by these actions it would be possible to change the present scenario of deterioration and to candidate the LM as a suitable place to receive projects of fish repopulation and culture. Conclusion The results of the present study enable us to conclude that: - There was an inverse relationship between the mean concentration of Escherichia coli and the subsuperficial water pH. This relationship can be expressed by the equation 7.63 – 2.92 * 10-4 x, where y is the average water pH and x is the mean concentration of E. coli, in MPN 100 mL-1 (r² = 0.53; P = 0.06); - The Lagoa da Maraponga suffers eventually episodes of hypoxia capable to bring serious difficulties to its biota. These facts are probably related to large releases of domestic sewage made to the lake; - The high values of electric conductivity of LM indicate its eutrophic condition and the release of great amounts of ions to its water from the activity of organic matter decomposition; - The input of sewage and/or affluents rich in organic matter into the lake decreases the alkalinity and turn it a vulnerable ecosystem to the acidifying process. References APHA-American Public Health Association. Standard methods for the examination of water and waste water. 20th ed. Washington, D.C., 1999. ARANA, L. V. Princípios químicos da qualidade da água em aqüicultura: uma revisão para peixes e camarões. 2. ed. Florianópolis: Edufsc, 2000. BOYD, C. E. Water quality management for pond fish culture. 1st ed. Amsterdam: Elsevier, 1992. (Developments in aquaculture and fisheries science, 9). BOYD, C. E.; TUCKER, C. S. Pond aquaculture water quality management. 1st ed. Norwell: Kluwer, 1998. CONAMA-Conselho Nacional do Maio Ambiente. Resolução n. 357, de 17 de março de 2005. Dispõe sobre a classificação dos corpos de água e diretrizes ambientais para o seu enquadramento, bem como estabelece as Acta Scientiarum. Biological Sciences
151 condições e padrões de lançamento de efluentes, e dá outras providências. Diário Oficial da União, n. 53, 18 mar. 2005. (Seção 1, p. 58-63). DODDS, W. K. Freshwater ecology: concepts and environmental applications (Aquatic ecology). 1st ed. New York: Academic Press, 2002. ESTEVES, F. A. Fundamentos de limnologia. 2. ed. Rio de Janeiro: Interciência, 1998. FORTALEZA. Prefeitura Municipal. Programa Lagoas de Fortaleza: relatório do mapeamento batimétrico. Fortaleza: PMF/SEMAN, 2007. GOLOMBIESKI, J. I.; MARCHEZAN, E.; MONTI, M. B.; STORCK, L.; CAMARGO, E. R.; SANTOS, F. M. Qualidade da água no consórcio de peixes com arroz irrigado. Ciência Rural, v. 35, n. 6, p. 1263-1268, 2005. GREEN, R.; WAITE, T. D.; MELVILLE, M. D.; MACDONALD, B. C. T. Treatment of acid sulfate soil drainage using limestone in a closed tank reactor. Water Air and Soil Pollution, v. 191, n. 1-4, p. 319-330, 2008. HIGGINS, J.; HOHN, C. Effects of prevalent freshwater chemical contaminants on in vitro growth of Escherichia coli and Klebsiella pneumoniae. Environmental Pollution, v. 152, n. 2, p. 259-266, 2008. HU, H. Y.; MYLON, S. E.; BENOIT, G. Volatile organic sulfur compounds in a stratified lake. Chemosphere, v. 67, n. 5, p. 911-919, 2007. KULKOYLUOGLU, O.; DUGEL, M.; KILIC, M. Ecological requirements of Ostracoda (Crustacea) in a heavily polluted shallow lake, Lake Yenicaga (Bolu, Turkey). Hydrobiologia, v. 585, n. 1, p. 119-133, 2007. MULLER, B.; WANG, Y.; WEHRLI, B. Cycling of calcite in hard water lakes of different trophic states. Limnology and Oceanography, v. 51, n. 4, p. 1678-1688, 2006. SHIAU, S. Y.; TSENG, H. C. Dietary calcium requirements of juvenile tilapia, Oreochromis niloticus x O. aureus, reared in fresh water. Aquaculture Nutrition, v. 13, n. 4, p. 289-303, 2007. SONIER, R.; MAYRAND, E.; BOGHEN, A. D.; OUELLETTE, M.; MALLET, V. Concentrations of Escherichia coli in sediments as an indicator of the sanitary status of oyster (Crassostrea virginica) aquaculture sites. Journal of Applied Ichthyology, v. 24, n. 6, p. 678-684, 2008. SUMMERFELT, R. C.; PENNE, C. R. Septic tank treatment of the effluent from a small-scale commercial recycle Aquaculture system. North American Journal of Aquaculture, v. 69, n. 1, p. 59-68, 2007. WETZEL, R. G. Limnology: lake and river ecosystems. 3rd ed. San Diego: Academic Press, 2001. Received on July 31, 2009. Accepted on October 8, 2009.
License information: This is an open-access article distributed under the terms of the Creative Commons Attribution License, which permits unrestricted use, distribution, and reproduction in any medium, provided the original work is properly cited.
Maringá, v. 33, n. 2, p. 145-151, 2011